. 2022 Feb;600(4):769-796.
doi: 10.1113/JP281535. Epub 2021 Jul 9.

Transcriptomic, proteomic and phosphoproteomic underpinnings of daily exercise performance and zeitgeber activity of training in mouse muscle

Affiliations

Transcriptomic, proteomic and phosphoproteomic underpinnings of daily exercise performance and zeitgeber activity of training in mouse muscle

Geraldine Maier et al. J Physiol. 2022 Feb.

Abstract

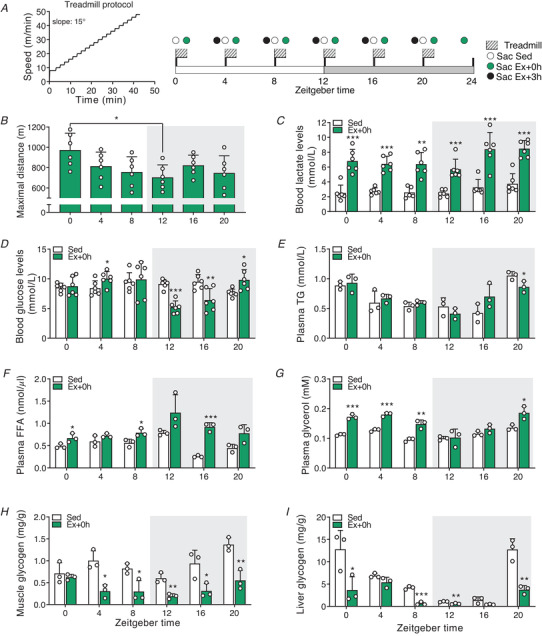
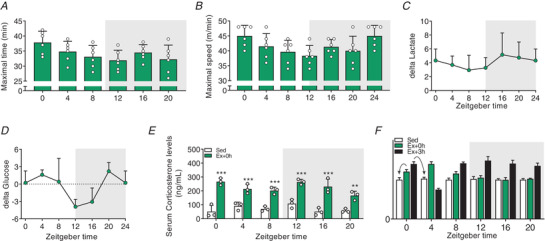
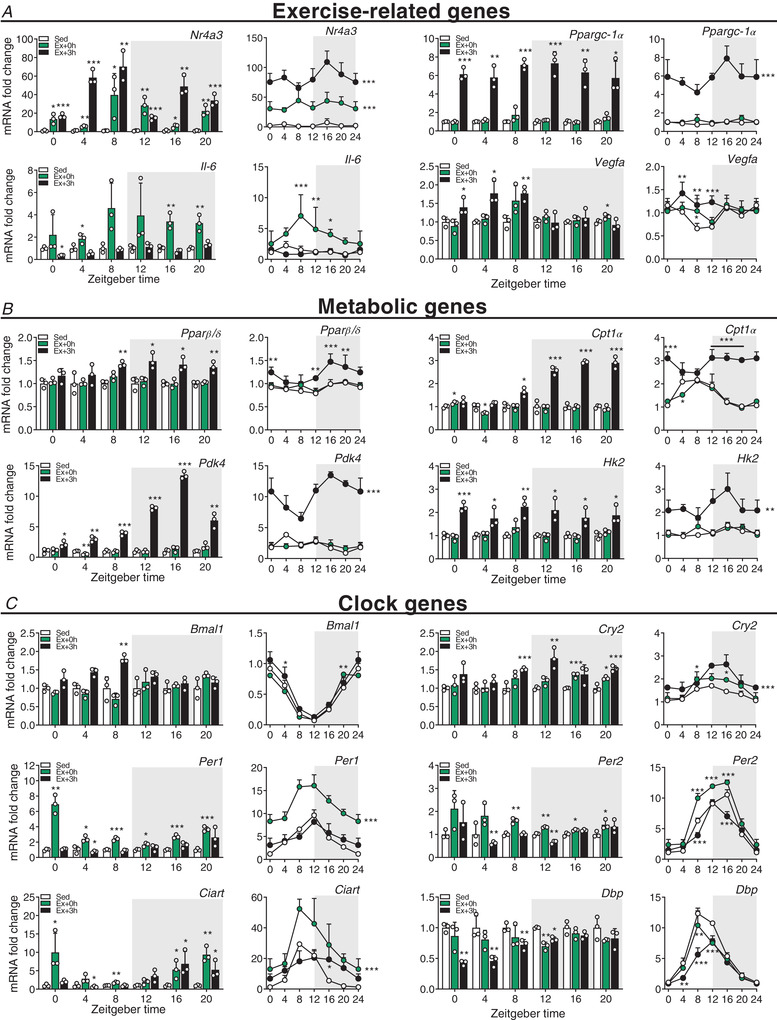
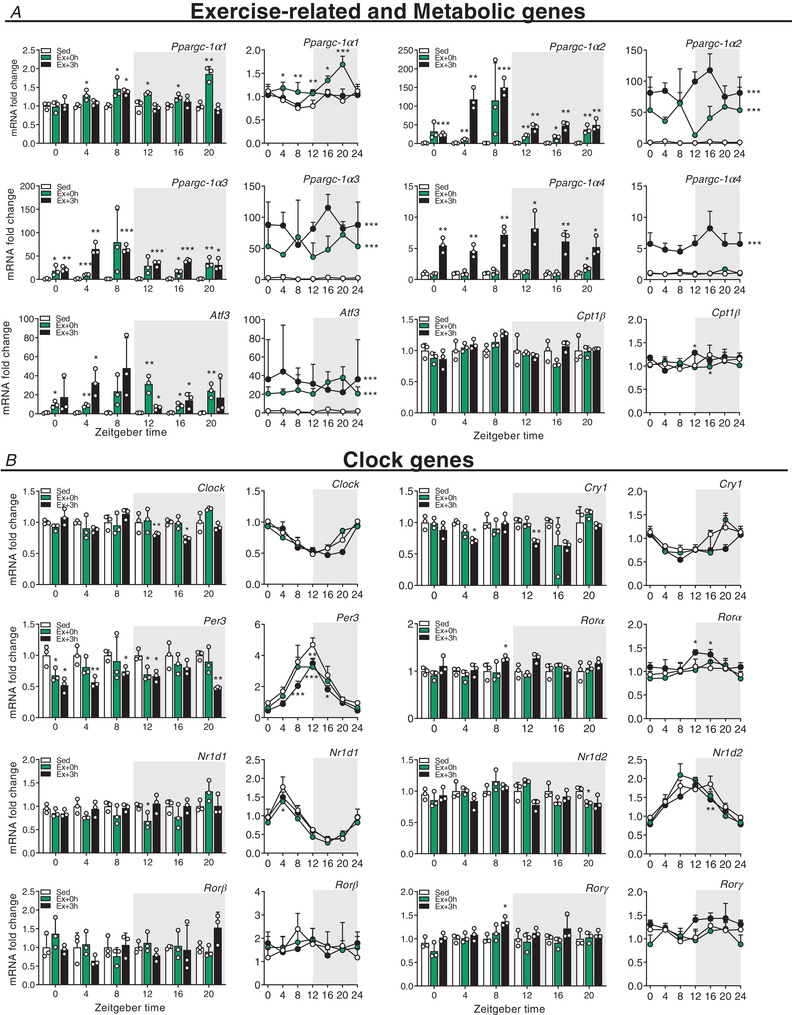
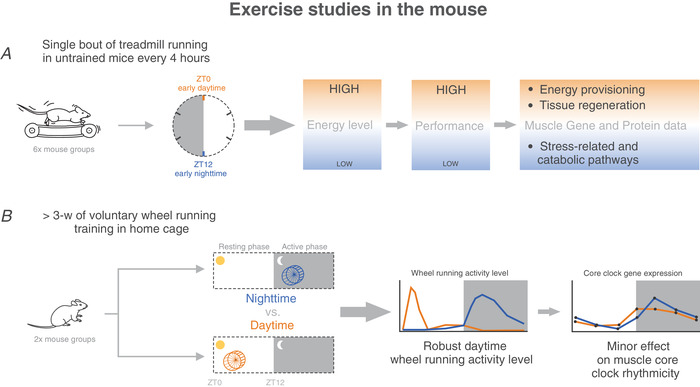
Key points: Maximal endurance performance is greater in the early daytime. Timed exercise differentially alters the muscle transcriptome and (phospho)-proteome. Early daytime exercise triggers energy provisioning and tissue regeneration. Early night-time exercise activates stress-related and catabolic pathways. Scheduled training has limited effects on the muscle and liver circadian clocks.

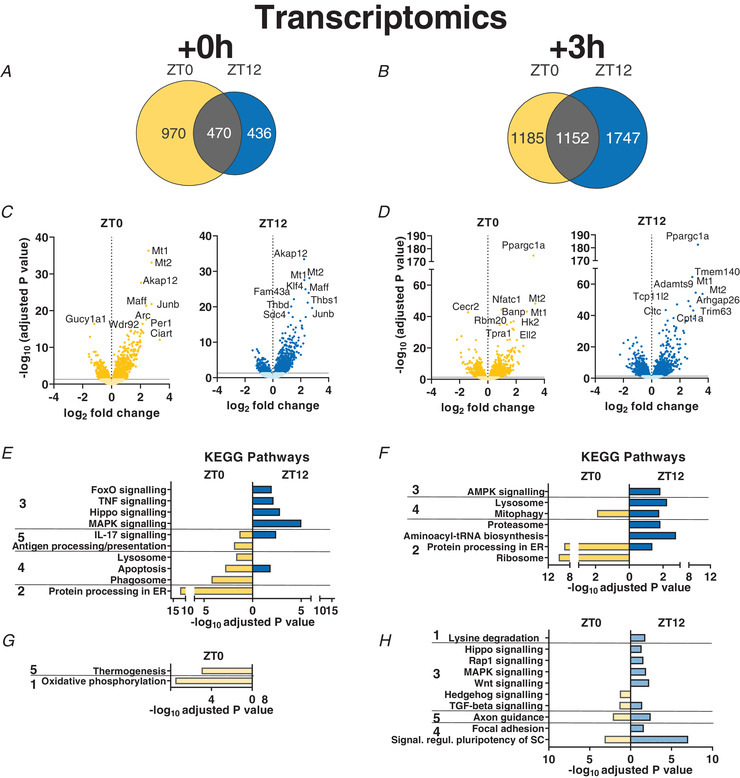
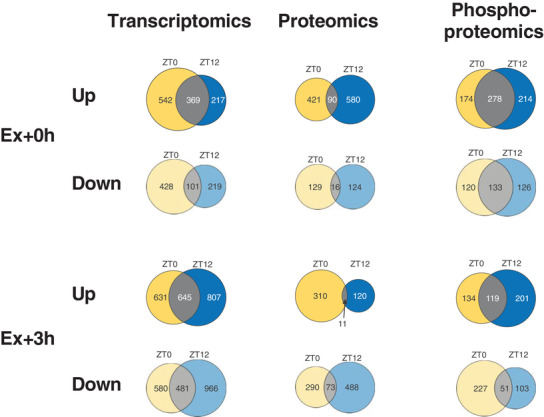
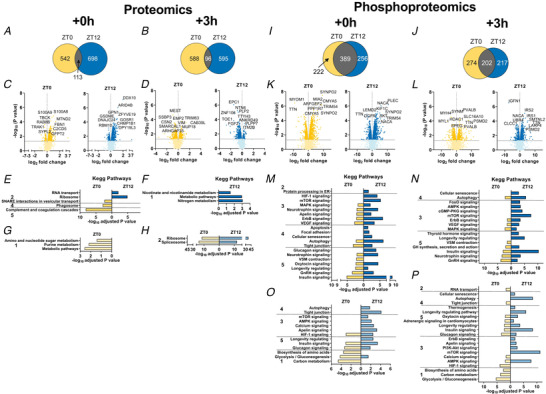
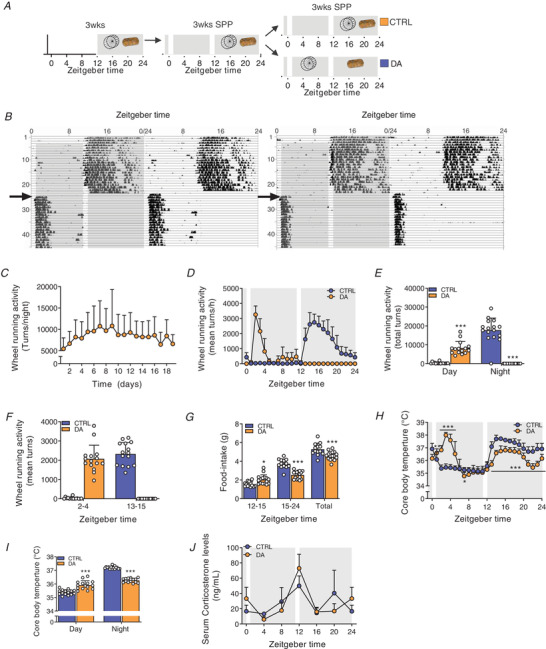
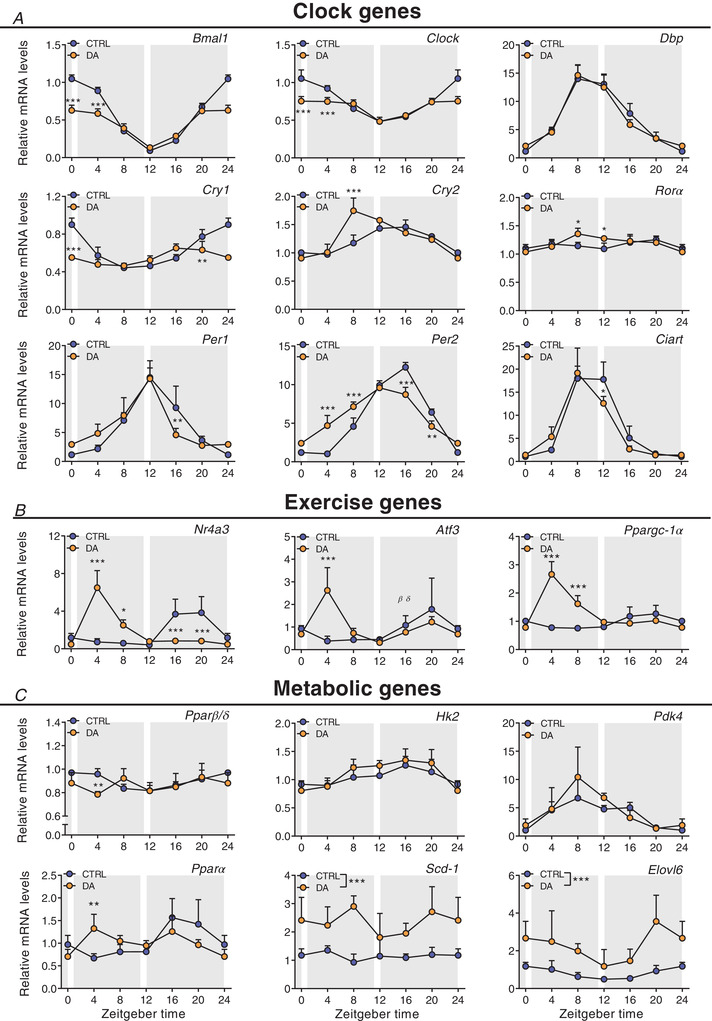
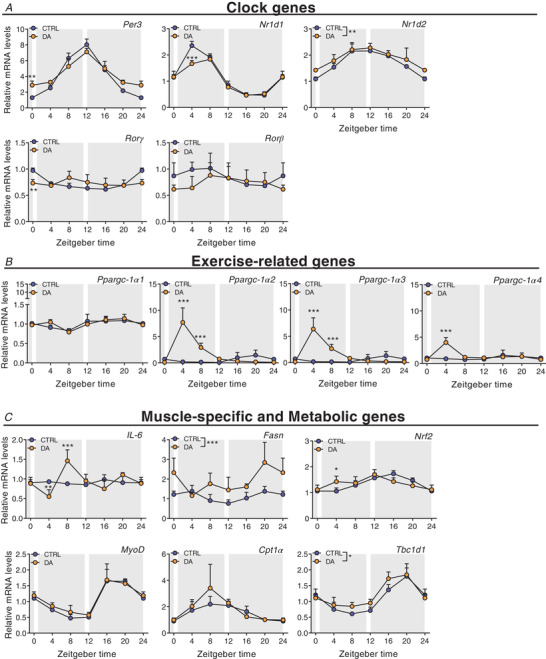
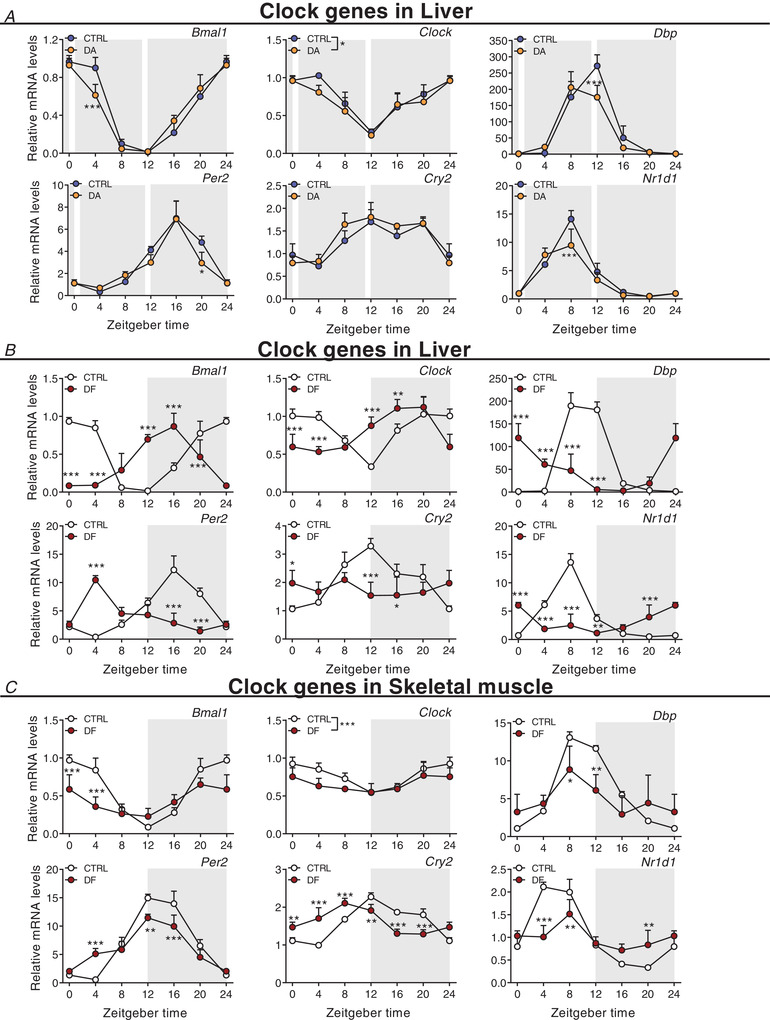
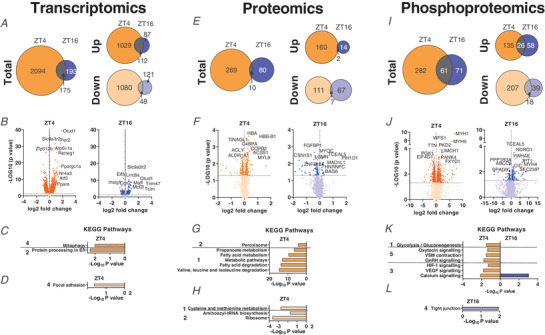
Abstract: Timed physical activity might potentiate the health benefits of training. The underlying signalling events triggered by exercise at different times of day are, however, poorly understood. Here, we found that time-dependent variations in maximal treadmill exercise capacity of naïve mice were associated with energy stores, mostly hepatic glycogen levels. Importantly, running at different times of day resulted in a vastly different activation of signalling pathways, e.g. related to stress response, vesicular trafficking, repair and regeneration. Second, voluntary wheel running at the opposite phase of the dark, feeding period surprisingly revealed a minimal zeitgeber (i.e. phase-shifting) effect of training on the muscle clock. This integrated study provides important insights into the circadian regulation of endurance performance and the control of the circadian clock by exercise. In future studies, these results could contribute to better understanding circadian aspects of training design in athletes and the application of chrono-exercise-based interventions in patients.

Keywords: circadian clock; energy homeostasis; exercise; metabolism; proteomics; skeletal muscle; transcriptomics; zeitgeber.


Figures

Figure 1
Figure 1. Time‐of‐day‐dependent variations in mouse treadmill exercise performance and physiological responses to exercise
A, treadmill protocol and experimental scheme. Mice were divided into two groups, sedentary (Sed) and exercise (Ex). The latter group was further divided into two groups: sacrificed immediately (+ 0 h) or 3 h after exhaustion (+ 3 h). B, maximal distance reached at exhaustion. CG, blood lactate (C), glucose (D), plasma triglyceride (TG) (E), free fatty acid (FAA) (F), and glycerol (G) levels. H and I, muscle (H) and liver (I) glycogen levels. Light and dark periods are depicted by white and grey background, respectively. Data are shown as the means ± SD (n = 3). * P < 0.05, ** P < 0.01, *** P < 0.001, one‐way ANOVA (B) and unpaired Student's t‐test (C–I). [Colour figure can be viewed at wileyonlinelibrary.com]
Figure 2
Figure 2. Time‐of‐day‐dependent fluctuations in exercise performance and exercise‐induced corticosterone release
A, maximal time reached at exhaustion. B, maximal speed reached at exhaustion. C and D, delta blood lactate (C) and delta glucose levels (D) (resting values subtracted from values at exhaustion). E, serum corticosterone levels in Sed and at exhaustion. Light and dark periods are depicted by white and grey background, respectively. Data are shown as the mean ± SD (n = 3). ** P < 0.01, *** P < 0.001, one‐way ANOVA (D). F, mock dataset to illustrate the analysis of the gene expression data depicted in Figs 3 and 4. Fold‐change (FC) values are plotted according to time at which exercise was started. FC estimation was performed according to the time of sacrifice (i.e. as indicated by the arrows: gene expression data of mice exercised from ZT0 and sacrificed directly at exhaustion are expressed relative to Sed ZT0 plotted at ZT0; and the gene expression of mice exercised at ZT0 and sacrificed 3 h after exhaustion are expressed relative to Sed ZT4, but plotted at ZT0). [Colour figure can be viewed at wileyonlinelibrary.com]
Figure 3
Figure 3. Exercise around the clock induces broad and time‐dependent gene responses in skeletal muscle
Gene expression in sedentary (Sed) and exercised mice at (Ex + 0 h) and 3 h (Ex + 3 h) after exhaustion. A, exercise‐related genes. B, metabolic genes. C, clock genes. Expression values were determined by qPCR and normalized to Hprt. Light and dark periods are depicted by white and grey background, respectively. Data in bar graphs are shown as the mean fold‐change ± SD (n = 3) relative to the expression in Sed set to 1 (see Methods for details on normalization). Data in line graph are shown as the mean fold‐change ± SD (n = 3) relative to the expression in the Sed ZT0 group set to 1. * P < 0.05, ** P < 0.01, *** P < 0.001, unpaired Student's t‐test (bar graphs) and one‐way ANOVA (line graphs). Group significance in line graphs is indicated on the right side of the group line. [Colour figure can be viewed at wileyonlinelibrary.com]
Figure 4
Figure 4. Scheduled treadmill induces broad and time‐dependent transcriptional responses in skeletal muscle
Gene expression in sedentary mice (Sed) and exercised mice at (Ex + 0 h) and 3 h (Ex + 3 h) after exhaustion. A, exercise‐related genes. B, metabolic genes. C, clock genes. Expression values were determined by qPCR and normalized to Hprt. Light and dark periods are depicted by white and grey background, respectively. Data in bar graphs are shown as the mean fold‐change ± SD (n = 3) relative to the expression in Sed set to 1 (see Methods for details on normalization). Data in line graph are shown as the mean fold‐change ± SD (n = 3) relative to the expression in the Sed ZT0 group set to 1. * P < 0.05, ** P < 0.01, *** P < 0.001, unpaired Student's t‐test (bar graphs) and one‐way ANOVA (line graphs). Group significance in line graphs is indicated on the right side of the group line. [Colour figure can be viewed at wileyonlinelibrary.com]
Figure 5
Figure 5. Daytime vs. night‐time treadmill exercise elicit distinct transcriptomic signatures
A and B, Venn diagrams displaying the number of DEGs immediately (A; Ex + 0 h) and 3 h (B; Ex + 3 h) after early daytime (ZT0) or early night‐time (ZT12) exercise, and resulting overlap. C and D, volcano plots displaying DEGs (with top 10 indicated) as described above. E–H, KEGG analysis (top 5 terms per category) of up‐regulated (E and F) and down‐regulated (G and H) genes by exercise as above. KEGG pathway categories: 1, metabolism; 2, genetic information processing; 3, environmental information processing; 4, cellular processes; 5, organismal systems. [Colour figure can be viewed at wileyonlinelibrary.com]
Figure 6
Figure 6. Distinct muscle gene expression signatures after early daytime vs. early night‐time treadmill exercise
Venn diagrams displaying the number of differentially regulated genes, proteins and phosphosites immediately (A; Ex + 0 h) or 3 h (B; Ex + 3 h) after early daytime (ZT0), early night‐time (ZT12) exercise, and the overlap. [Colour figure can be viewed at wileyonlinelibrary.com]
Figure 7
Figure 7. Phospho‐/proteomic analyses reveal time‐dependent differences in muscle response to early daytime vs. early night‐time exercise
A and B, Venn diagrams displaying the number of differentially regulated proteins immediately (A; Ex + 0 h) and 3 h (B; Ex + 3 h) after early daytime (ZT0) or early night‐time (ZT12) exercise, and resulting overlap. C and D, volcano plots showing the differentially regulated proteins (with top 10 indicated) as above. E–H, KEGG analysis of up‐regulated (E and F) and down‐regulated (G and H) proteins by exercise as described above. I–L, Venn diagrams (I and J) and volcano plots (K and L) displaying the differentially phosphorylated proteins in the same groups as above. M–P, KEGG analysis (top 5 terms per category) for increased (M and N) and decreased (O and P) protein phosphorylation in Ex + 0 h and Ex + 3 h groups. KEGG pathway categories: 1, metabolism; 2, genetic information processing; 3, environmental information processing; 4, cellular processes; 5, organismal systems. [Colour figure can be viewed at wileyonlinelibrary.com]
Figure 8
Figure 8. Scheduled daytime wheel‐running activity in mice exposed to a skeleton photoperiod
A, experimental scheme. Mice had free access to a wheel for 3 weeks under 12:12 L:D before transfer to a skeleton photoperiod (SPP). The SPP consists of 1 h light pulse from ZT0 to ZT1 and from ZT11 to ZT12. After 3 weeks under SPP conditions, mice were separated into two groups: one with free access to wheel and food, the other with exclusive access to wheel during day and food during night. B, representative double‐plotted actograms of DA mice. The grey background indicates light off, and the arrow indicates the time shift in wheel access. C, daily wheel‐running activity from the first day of restriction of the DA mice. D and E, 24‐h activity levels of CTRL and DA mice (D), and resulting average of day vs. night locomotor activity (E). F, quantified wheel‐running activity during the first 2 h of wheel excess. G, food intake during the active, feeding period and average over the full food access period. H and I, 24‐h core body temperature levels of CTRL and DA mice (H), and resulting day and night values (I). J, serum corticosterone levels. Light and dark periods are depicted by white and grey background, respectively. Data are shown as the mean ± SD (n = 24). * P < 0.05, ** P < 0.01, *** P < 0.001, unpaired Student's t‐test (E, G, I) and one‐way ANOVA (H). [Colour figure can be viewed at wileyonlinelibrary.com]
Figure 9
Figure 9. Daytime wheel running profoundly affects skeletal muscle gene expression but not the core clockwork
Gene expression in control (CTRL) and daytime activity (DA) mice. A, clock genes. B, exercise‐related genes. C, metabolic genes. Expression values were determined by qPCR and normalized to Hprt. Light and dark periods are depicted by white and grey background, respectively. Data are shown as the mean fold‐change ± SD (n = 4) relative to the expression in CTRL ZT0 set to 1. * P < 0.05, ** P < 0.01, *** P < 0.001, one‐way ANOVA. [Colour figure can be viewed at wileyonlinelibrary.com]
Figure 10
Figure 10. Distinct muscle gene expression signatures after daytime vs. night‐time wheel running training
Gene expression in control (CTRL) and daytime activity (DA) mice. A, clock genes. B, exercise‐related genes. C, muscle‐specific and metabolic genes. Expression values were determined by qPCR and normalized to Hprt. Light and dark periods are depicted by white and grey background, respectively. Data are shown as the mean fold‐change ± SD (n = 4) relative to the expression in CTRL ZT0 set to 1. * P < 0.05, ** P < 0.01, *** P < 0.001, one‐way ANOVA. [Colour figure can be viewed at wileyonlinelibrary.com]
Figure 11
Figure 11. Distinct liver clock gene expression signatures after daytime vs. night‐time wheel running training
Gene expression in control (CTRL) and daytime activity (DA) mice. Clock genes in liver of DA mice (A), of daytime feeding (DF) mice (B), and in skeletal muscle of DF mice (C). Expression values were determined by qPCR and normalized to Hprt. Light and dark periods are depicted by white and grey background, respectively. Data are shown as the mean fold‐change ± SD (n = 4) relative to the expression in CTRL ZT0 set to 1. * P < 0.05, ** P < 0.01, *** P < 0.001, one‐way ANOVA. [Colour figure can be viewed at wileyonlinelibrary.com]
Figure 12
Figure 12. Characterization of the muscle transcriptome, proteome and phosphoproteome responses of daytime wheel active mice
A, Venn diagrams with number of DEGs in DA mice at ZT4 and CTRL mice at ZT16, and resulting overlap. B, volcano plots displaying the DEGs (top 10 shown) as identified in the same groups as above. C and D, KEGG analysis (top 5) of up‐regulated (C) and down‐regulated (D) genes as above. E, Venn diagrams displaying the number of differentially regulated proteins for night‐time, and daytime wheel running and the overlap. F, volcano plot showing the differentially regulated proteins (top 10 only) by night‐time and daytime wheel running. G and H, KEGG analysis (top 5) for proteins induced (G) or decreased (H) by night‐time and daytime wheel running. I, Venn diagram displaying the number of differentially phosphorylated proteins as described above. J, volcano plot showing the differentially phosphorylated proteins (top 10 shown). K and L, KEGG analysis (top 5) for phosphorylated (K) and dephosphorylated (L) proteins. KEGG pathway categories: 1, metabolism; 2, genetic information processing; 3, environmental information processing; 4, cellular processes; 5, organismal systems. [Colour figure can be viewed at wileyonlinelibrary.com]
Figure 13
Figure 13. Graphical summary of key findings of exercise studies in the mouse
High energy levels, high performance and tissue regeneration‐related pathways were observed when treadmill exercise was performed at ZT0. In contrast, low energy levels decreased performance, and the activation of stress‐related and catabolic processes was observed when treadmill exercise was performed at ZT12. Moreover, chronic daytime wheel running has minor effects on muscle core clock gene expression. [Colour figure can be viewed at wileyonlinelibrary.com]

Comment in

References

    1. Ahrne E, Glatter T, Vigano C, Schubert C, Nigg EA & Schmidt A (2016). Evaluation and improvement of quantification accuracy in isobaric mass tag‐based protein quantification experiments. J Proteome Res 15, 2537–2547. - PubMed
    1. Albrecht U & Eichele G (2003). The mammalian circadian clock. Curr Opin Genet Dev 13, 271–277. - PubMed
    1. Allen DL, Harrison BC, Maass A, Bell ML, Byrnes WC & Leinwand LA (2001). Cardiac and skeletal muscle adaptations to voluntary wheel running in the mouse. J Appl Physiol 90, 1900–1908. - PubMed
    1. Bendtsen JD, Jensen LJ, Blom N, Von Heijne G & Brunak S (2004). Feature‐based prediction of non‐classical and leaderless protein secretion. Protein Eng Des Sel 17, 349–356. - PubMed
    1. Boergesen M, Pedersen TA, Gross B, van Heeringen SJ, Hagenbeek D, Bindesboll C, Caron S, Lalloyer F, Steffensen KR, Nebb HI, Gustafsson JA, Stunnenberg HG, Staels B & Mandrup S (2012). Genome‐wide profiling of liver X receptor, retinoid X receptor, and peroxisome proliferator‐activated receptor alpha in mouse liver reveals extensive sharing of binding sites. Mol Cell Biol 32, 852–867. - PMC - PubMed

Publication types