. 2021 Aug;599(16):3913-3936.
doi: 10.1113/JP281522. Epub 2021 Jul 9.

Functional development and regeneration of hair cells in the zebrafish lateral line

Affiliations

Functional development and regeneration of hair cells in the zebrafish lateral line

Katherine Hardy et al. J Physiol. 2021 Aug.

Abstract

Key points: We investigated hair-cell regeneration in the zebrafish lateral line following the application of the ototoxic compound copper. In early-larval zebrafish (<10 days post-fertilisation), regenerated hair cells drive action potentials (APs) in the afferent neurons 24 h post-copper treatment (24 hpt). Full regeneration of the early-larval neuromasts, the organs containing the hair cells, requires ∼48 h due to the progressive addition of hair cells and synaptic refinement. In older larval zebrafish, regenerated hair cells are active and drive afferent APs by 48 hpt, which is comparable to larvae, but the functional recovery of their neuromasts requires >120 hpt. Afferent terminals within the regenerating neuromast appear to initially contact supporting cells, and their complete ablation prevents the timely reappearance of supporting cells and hair cells. We conclude that the regeneration of zebrafish neuromasts is slower after the initial developmental stages, and that the afferent input plays a key role in driving this process.

Abstract: Hair cells are mechanosensory receptors responsible for transducing auditory and vestibular information into electrical signals, which are then transmitted with remarkable precision to afferent neurons. Different from mammals, the hair cells of lower vertebrates, including those present in the neuromasts of the zebrafish lateral line, regenerate following environmental or chemical insults. Here we investigate the time course of regeneration of hair cells in vivo using electrophysiology, two-photon imaging and immunostaining applied to wild-type and genetically encoded fluorescent indicator zebrafish lines. Functional hair cells drive spontaneous action potentials in the posterior lateral line afferent fibres, the frequency of which progressively increases over the first 10 days post-fertilisation (dpf). Higher firing-rate fibres are only observed from ∼6 dpf. Following copper treatment, newly formed hair cells become functional and are able to drive APs in the afferent fibres within 48 h in both early-larval (≤8 dpf) and late-larval (12-17 dpf) zebrafish. However, the complete functional regeneration of the entire neuromast is delayed in late-larval compared to early-larval zebrafish. We propose that while individual regenerating hair cells can rapidly become active, the acquisition of fully functional neuromasts progresses faster at early-larval stages, a time when hair cells are still under development. At both ages, the afferent terminals in the regenerating neuromast appear to make initial contact with supporting cells. The ablation of the lateral line afferent neurons prevents the timely regeneration of supporting cells and hair cells. These findings indicate that the afferent system is likely to facilitate or promote the neuromast regeneration process.

Keywords: afferent fibres; development; electrophysiology; hair cells; imaging; neuromast; otoxic compound; regeneration; ribbon synapses; zebrafish.


Conflict of interest statement

Competing interests: The Authors declare no conflict of interest

Figures

Figure 1
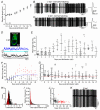
Figure 1. Spontaneous action potentials in the zebrafish posterior lateral line
A, Growth of the zebrafish (Danio rerio) under the husbandry conditions used at the University of Sheffield. The selected time window 2-17 dpf (10 zebrafish for each time point) reflected the age-range used for all of the following imaging and electrophysiological experiments. B and C, Spontaneous action potentials (APs) from the posterior lateral line ganglion (PLLg) recorded using cell-attached voltage clamp. Recordings are from 2 days post-fertilization (dpf) zebrafish that were manually (B) or naturally (C) hatched. Manually hatched recordings were from 6 zebrafish (total of 5854 spikes over 57.2 minutes); naturally hatched: 9 zebrafish (7233 spikes over 55.0 minutes). The panels on the right show an AP on an expanded time scale. D, Fluorescence image generated as an average projection of 1000 images of a lateral line hair cell from a 4 dpf Tg(Brn3c:GAL4);Tg(UAS:iGluSnFR) zebrafish expressing iGluSnFR (green: top panel). The bottom panel shows the iGluSnFR traces from two hair cells calculated from ROIs drawn at the synaptic pole (blue and black traces) or the neck of the cell (light-blue and grey traces). Note that the hair cells in the top image refer to the recordings depicted in the blue and light-blue traces; the image of the second hair cell (black-grey traces) is not shown. Note the high frequency signals present in the synaptic traces denoting spontaneous glutamate release (see also Supplementary Movie 1). The light traces are plotted as a visual reference of the intrinsic noise level of the recordings. E, Average frequency of spontaneous APs as a function of dpf. Overall 598,004 spike from 133 PLLg (8.1 ± 2.9 min/PLLg). F, The AP frequency as a function of dpf was subdivided in a low- (black circles) and a high-frequency (red circles) cluster using k-means clustering. The data was fitted with a Boltzman equation, with a half-peak value of 5.2 dpf. G, Coefficient of variation (CV) of the spontaneous APs plotted as a function of dpf. The red dotted line indicates the CV value for a random Poisson process, which is 1. H, Histogram of CV values (bin size, 0.1) for the two clusters highlighted in black and red in panel F. I, Histogram of individual AP inter-spike intervals of the two clusters identified in panel F. J, CV from each PPLg recording against their firing rate for the two groups. K, Example of spontaneous APs from a PPLg of a 10 dpf zebrafish showing a bursting firing patterns (CV: 2.7; Frequency: 6.9 Hz). In this and the following Figures, data are presented as mean ± SD.
Figure 2
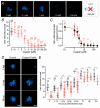
Figure 2. Copper ablates the posterior lateral line hair cells at μM concentrations
A, Confocal images of hair cells within individual neuromasts from Tg(Myosin6b:R-GECO) zebrafish (3 dpf) taken following a 2-hour application of varying concentrations of copper. Hair cells are labelled in blue (Myosin6b:R-GECO). Note that 250 μM is lethal for zebrafish. B, Number of hair cells per neuromast in control zebrafish (black circles and lines) and after the application of varying copper concentrations for 2 hours (red circles and lines). C, Dose–response curves for the ablation of hair cells by copper. The continuous line is the fits through the data using the Hill equation. D, Confocal images of hair cells (blue) within the neuromasts of Tg(Myosin6b:R-GECO) zebrafish at 0, 24 and 48 hours post-treatment (hpt) with 10 μM copper for 2 hours (right columns) and aged-matched untreated control zebrafish (left columns). Scale bar: 10 μm. E, Number of regenerating hair cells per neuromast as a function of hpt. Statistical significance from left to right: **P < 0.0001; n.s. P = 0.0702, P = 0.9997 and P = 0.1089, two-way ANOVA Sidak’s post-test. Number of neuromasts tested is shown above the data; 2-3 neuromasts per zebrafish.
Figure 3
Figure 3. Spontaneous activity in the regenerating early-larval zebrafish posterior lateral line
A, Cell-attached voltage clamp recordings from a PPLg neuron of a 3 dpf zebrafish immediately after the 2-hour treatment with a solution without (top) and with (bottom) 10 μM copper. A few spontaneous APs were only present in 1 (trace shown) out of the 11 recordings from copper-treated zebrafish between 0.5 and 4.5 hpt. All zebrafish were 3 dpf at the start of the experiment (0 hpt). B and C, Single data values for the frequency (B) and CV (C) of the spontaneous APs recorded from the PLLg of zebrafish undergoing hair cell regeneration after copper treatment and aged-matched control zebrafish. Statistical significance from left to right: B: **P = 0.0099; n.s. P > 0.9999 and P = 0.3692; C: **P = 0.0006; n.s. P = 0.3377 and P > 0.9999, two-way ANOVA Sidak’s post-test. D and E, Right: fluorescence image generated as average projection of 1000 images of a lateral line hair cell from Tg(Brn3c:GAL4);Tg(UAS:iGluSnFR) zebrafish expressing iGluSnFR (green). Left panels show spontaneous iGluSnFR signals from the synaptic region of 3 hair cells per experimental condition. Zebrafish were investigated at 36 hpt (top panels) and 48 hpt (bottom panels). Data shown are representative images and traces from a total of 10 hair cells recorded from 4 control zebrafish (7 neuromasts) and 20 hair cells from 8 copper-treated zebrafish (18 neuromasts). Orange traces in panel E indicate hair cells lacking spontaneous iGluSnFR signals.
Figure 4
Figure 4. Induced firing activity in the regenerating lateral line
A, Schematic of the experimental set-up used to displace the mechanoelectrical transducer apparatus of the hair cells. The image shows a PLL neuromast containing hair cells of opposite polarity (light and dark grey). The hair bundles of the hair cells are displaced by saturating stimuli applied using a piezo driven fluid-jet (see Methods) while recording firing activity in the PLLg neuron connected to the neuromast. B and C, Representative AP recordings from the PLLg afferent neurons while deflecting the cupula of a connected neuromast with the fluid jet (see Methods) from a control (B) and copper treated (C) zebrafish. The top trace represents the 3 s saturating driving voltage step to the piezoelectric actuator. Note the increase in firing rate at the onset of the stimulus and the subsequent adaptation. D, Raster plot of individual afferent neuron activity during the application of the stimuli in the excitatory direction (top panels: driving voltage). E and F, The peak firing rate (E) and the latency between the stimulus onset and the generation of the first spike (F) were not significantly different between control and copper-treated zebrafish (P = 0.4956 and P = 0.5243, t-test, respectively).
Figure 5
Figure 5. Synaptic activity in regenerating early-larval hair cells
A, Schematic of the experimental set-up used to displace the mechanoelectrical transducer apparatus of the hair cells. The image shows a PLL neuromast containing hair cells of opposite polarity (light and dark grey) viewed by the microscope objective (above the fish). The hair bundles of the hair cells are displaced by saturating stimuli applied using a piezo-driven fluid-jet (see Methods). Hair cells are excited by stimuli which displace their hair bundle towards the kinocilium, opening the MET channels and depolarising the membrane potential. The increase in intracellular Ca2+ ensues from the opening of voltage-gated Ca2+ channels in the plasma membrane. B, Image of a 3 dpf zebrafish (Tg(Myosin6b:R-GECO);Tg(NBT:GCaMP3)) neuromast, in which hair cells are label red and the afferent fibres/terminals in green (see also Supplementary Movie 2). C, R-GECO responses of four hair cells to two saturating bundle displacement stimuli showed by the driver voltage above the recordings. D, Calcium responses (GCaMP3) in the afferent terminals during the same stimulation protocol that elicited hair cell responses (C). Note that the traces in C and D are from the same recording, but not obtained simultaneously, due to the difficulty of having several hair cells and their afferent terminals in the same focal-plane. E, Percentage of hair cells showing presynaptic Ca2+ response during hair bundle stimulation in both control (black) and copper-treated (red) zebrafish as a function of hpt. F, Percentage of afferent synaptic terminals showing GCaMP3 responses during bundle stimulation in control (black) and copper-treated (red) zebrafish as a function of hpt. Number of neuromasts tested is shown above the data; 2-3 neuromasts per zebrafish. Statistical significance from left to right: E: **P < 0.0001; P < 0.0001; *P = 0.0204; n.s. P > 0.9999; F: **P < 0.0001; **P = 0.0003; *P = 0.0036; n.s. P > 0.9999, Sidak’s post-test two-way ANOVA.
Figure 6
Figure 6. Ribbon synapses and afferent fibres in regenerating early-larval hair cells
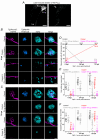
A, Confocal images of hair cells (blue) and afferent fibres (magenta) within the neuromasts of Tg(Myosin6b:R-GECO); Tg(NBT:GCaMP3) zebrafish at 0, 48, and 120 hpt in control and copper-treated zebrafish. Experiments were done using 3 dpf zebrafish. Ribbon synapses were visualized with an antibody against the presynaptic ribbon protein RIBEYE (CtBP: green). Scale bar: 10 μm. For larger images see Supplementary Figure 4. Note that the punctate-like labelling (column: Tg(Myosin6b:R-GECO) in hair cells, which co-localizes with the CtBP labelling (columns: CtBP and Merge), is a characteristic of the Tg(Myosin6b:R-GECO) zebrafish since it was also present in the absence of the anti-CtBP antibody (see Fig. 2). B, Number of CtBP puncta present in hair cells from untreated control zebrafish (black) and regenerating hair cells following copper-treatment (red) as a function of hpt. Statistical significance from left to right: **P < 0.0001; **P < 0.0001; n.s. P = 0.4370, P = 0.4465, P = 0.6064, P = 0.5057, P > 0.9999: two-way ANOVA Sidak’s post-test. C, Number of CtBP puncta colocalized with the afferent terminals as a function of hpt. **P < 0.0001; n.s. P < 0.0001, P = 0.7407, P = 0.0764, P = 0.9889, P = 0.2051, P = 0.7763: Sidak’s post-test. Number of neuromasts tested in panel B and C is shown above the data; 2-3 neuromasts per zebrafish. D, Confocal images as shown in panel A, indicating the presence of afferent terminals in the absence of hair cells. Scale bar: 10 μm.
Figure 7
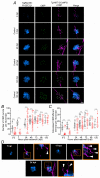
Figure 7. Hair cell regeneration and afferent activity in late-larval zebrafish
A, Confocal images of hair cells (blue) within the neuromasts of Tg(Myosin6b:R-GECO) zebrafish at 24, 48 and 72 hpt from copper-treated (bottom row) and control (top row) zebrafish. Experiments were done using 12 dpf zebrafish. Scale bar: 10 μm. B, Number of regenerating hair cells per neuromast as a function of hpt. Statistical significance from left to right: **P < 0.0001 for all comparisons: two-way ANOVA Sidak’s post-test. C and D, Spontaneous APs from the PLLg neurons. Age of the zebrafish is reported above the traces. E, Frequency of spontaneous APs as a function of hpt. Significance from left to right: **P = 0.0003; n.s. P = 0.2768; *P = 0.0027; n.s. P = 0.4255; n.s. P = 0.5101, two-way ANOVA Sidak’s post-test. F, Coefficient of variation (CV) of the spontaneous APs plotted as a function of hpt. Statistical significance from left to right: n.s. P = 0.4188; **P < 0.0001; n.s. P = 0.6057; n.s. P = 0.8508; n.s. P = 0.9727, two-way ANOVA Sidak’s post-test. In panels B, E and F, the number of neuromasts tested is shown above the data; 2-3 neuromasts per zebrafish.
Figure 8
Figure 8. Ribbon synapses and afferent fibres in regenerating late-larval hair cells
A, Confocal images showing the hair cells within a neuromast from Tg(Myosin6b:R-GECO);Tg(NeuroD:EGFP) zebrafish obtained at 0 and 120 hpt in control and copper-treated zebrafish. Experiments were done using 12 dpf zebrafish. Ribbon synapses were visualized with the anti-CtBP antibody (green). Scale bar: 10 μm. B, Number of CtBP puncta present in hair cells from the two different experimental conditions as a function of hpt. Significance from left to right: **P < 0.0001 for 0, 24 and 48 hpt; *P = 0.0007; *P = 0.0003, two-way ANOVA Sidak’s post-test. C, Number of CtBP puncta colocalized with the afferent terminals as a function of hpt. **P < 0.0001 for 0, 24, 48 and 72 hpt, *P = 0.0002: two-way ANOVA Sidak’s post-test. D, Confocal images as described in panel A, indicating the presence of afferent terminals in the absence of hair cells. Scale bar: 10 μm.
Figure 9
Figure 9. Synaptic activity in regenerating late-larval zebrafish hair cells
A, Images of a neuromast in a control (upper panel) and copper-treated (lower panel) 12 dpf zebrafish (Tg(Myosin6b:R-GECO);Tg(NBT:GCaMP3)), in which hair cells are label red and the afferent fibres/terminals in green. Scale bar: 10 μm. B and C, Ca2+ responses in hair cells (R-GECO, B) and afferent terminals (GCaMP3, C). Saturating driver voltage displacing the cupula is shown above the recordings. Note that some hair cells respond to the either the excitatory or inhibitory cupula displacement depending on their polarity sensitivity. D, Percentage of hair cells showing presynaptic Ca2+ responses during hair bundle stimulation in both (black) and copper-treated (red) 12 dpf zebrafish as a function of hpt (P = 0.7617, two-way ANOVA). The x-axis shows four time points (as hours post-treatments: hpt) following the application of copper at 12 dpf zebrafish. E, Percentage of afferent synaptic terminals showing GCaMP3 responses during bundle stimulation as a function of hpt in control (black) and copper-treated (red) zebrafish (P = 0.6531, two-way ANOVA). In panels E and F, the number of neuromasts tested is shown above the data; 2-3 neuromasts per zebrafish.
Figure 10
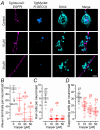
Figure 10. Afferent terminals and supporting cells are less sensitive to copper damage than hair cells
A, Confocal images showing the afferent fibres and terminals (magenta: Tg(NeuroD:EGFP) zebrafish line), hair cells (blue: Tg(Myosin6b:R-GECO) zebrafish line) and supporting cells (cyan: anti-Sox2 antibody) within a neuromast from control and copper-treated zebrafish (2 hours incubation with 10, 30 or 50 μM copper sulphate). Experiments were done using 3 dpf zebrafish. Scale bar: 10 μm. B-D, Number of afferent terminals (B), hair cells (C) and supporting cells (D) per neuromast after the application of different concentrations of copper. The presence of afferent terminals was defined as an enlargement of the fibre within the neuromast region (presence of afferent terminals was scored as 100; absence with 0, which were then converted in % based on the number of neuromast investigated). For all three comparisons in panels B-D, P < 0.0001, one-way ANOVA.
Figure 11
Figure 11. Afferent terminals within the regenerating neuromast colocalise with supporting cells
A, Confocal images showing the afferent fibres (magenta: 1), hair cells (blue: 2) and supporting cells (cyan: antibody anti-Sox2: 3) within a neuromast from control and copper-treated zebrafish (2 hr incubation with 30 μM copper). The next three columns are merge images showing: afferent fibres and hair cells (4); afferent fibres and supporting cells (5); and afferent fibres, hair cells and supporting cells (6). The two images in the “expanded” column (7) highlight the presence of afferent terminals in close proximity to supporting cells. Experiments were done using 3 dpf Tg(NeuroD:EGFP; Tg(Myosin6b:R-GECO) zebrafish. Scale bar: 10 μm. B, Percentage of neuromast showing afferent terminals as a function of hpt. Control neuromasts were only analyzed at 10 and 24 hpt. C, Number of supporting cells per neuromast obtained in control (black) and copper-treated (red) zebrafish has a function of hpt. At 10 hpt, control vs copper: P = 0.1668; At 24 hpt, control vs copper: P = 0.9998, one-way ANOVA, Tukey’s post-test. D, Confocal images as described in panel A, for 5, 7 and 10 hpt neuromasts showing some additional examples of afferent terminals in the proximity of the supporting cells. Scale bar: 10 μm.
Figure 12
Figure 12. Afferent nerve regeneration is rapid and does not cause any substantial delay in the regeneration of the neuromast
A, Two-photon confocal images showing an image of the PLLg and its afferent fibres before (arrowhead: left) and after laser ablation (arrow, right). Scale bar: 30 μm. B-D, B, Number of hair cells per neuromast as a function of hpt. Zebrafish subjected to the ablation of the afferent nerves are indicated as: Control (Aff. Ablation) and Copper (Aff. Ablation). The experiment “Control (no Aff.)”, was performed to test whether the severance of the afferent nerves has any unforeseen effect on the untreated neuromasts. C, Number of supporting cells per neuromast obtained under the same experimental conditions mentioned in panel B. In panels B and C, the number of neuromasts (zebrafish) tested is shown above the data points. D, Percentage of neuromasts showing afferent protrusion/total neuromast investigated. Data in B-D were obtained by analysing confocal images obtained from zebrafish (3 dpf: Tg(NeuroD:EGFP);Tg(Myosin6b:R-GECO) that were treated for 2 hr with 30 μM copper sulphate (see Supplementary Figure 3).
Figure 13
Figure 13. The PLLg is required for the regeneration of hair cells
A, Two-photon confocal images showing an image of the PLL before (arrowhead: left) and after laser ablation (of the PLLg arrows, right). Scale bar: 30 μm. B, C, Confocal images showing the afferent fibres (magenta), hair cells (blue) and supporting cells (cyan: antibody anti-Sox2) within a neuromast from control zebrafish (top panels, no-copper treated and no-PLLg ablated zebrafish), control-ablated zebrafish (second row of panels), copper-treated zebrafish (third row of panels) and copper treated zebrafish with ablated PLLg (bottom panels) at 0 hpt (B) and 72 hpt (C). Scale bar: 10 μm. Zebrafish (3 dpf: Tg(NeuroD:EGFP); Tg(Myosin6b:R-GECO)) were treated for 2 hr with 30 μM copper sulphate. The last column represents the merged images showing afferent fibres, supporting cells and hair cells. D, Percentage of neuromasts showing afferent protrusion/total neuromast investigated. Zebrafish subjected to the ablation of the PLLg are indicated as: Control (PLLg Ablation) and Copper (PLLg Ablation). E, Number of hair cells per neuromast as a function of hpt. The experiment “Control (PLLg Ablation)”, was performed to test whether the severance of the afferent nerves had any unforeseen effect on the untreated neuromasts. F, Number of supporting cells per neuromast obtained under the same experimental conditions mentioned in panel E. For additional statistical analysis see the “Statistical Summary” file. In panels E and F, the number of neuromasts (zebrafish) tested is shown above the data points.

Comment in

Similar articles

Cited by

References

    1. Andermann P, Ungos J, Raible DW. Neurogenin1 defines zebrafish cranial sensory ganglia precursors. Dev Biol. 2002;251:45–58. - PubMed
    1. Atkinson PJ, Huarcaya Najarro E, Sayyid ZN, Cheng AG. Sensory hair cell development and regeneration: similarities and differences. Development. 2015;142:1561–1571. - PMC - PubMed
    1. Bergmann K, Meza Santoscoy P, Lygdas K, Nikolaeva Y, MacDonald RB, Cunliffe VT, Nikolaev A. Imaging Neuronal Activity in the Optic Tectum of Late Stage Larval Zebrafish. J Dev Biol. 2018;6:6. - PMC - PubMed
    1. Bleckmann H, Zelick R. Lateral line system of fish. Integr Zool. 2009;4:13–25. - PubMed
    1. Brandt A, Striessnig J, Moser T. CaV1.3 channels are essential for development and presynaptic activity of cochlear inner hair cells. J Neurosci. 2003;23:10832–10840. - PMC - PubMed

Publication types