. 2021 Jun 18;17(6):e1009686.
doi: 10.1371/journal.ppat.1009686. eCollection 2021 Jun.

Transient viral replication during analytical treatment interruptions in SIV infected macaques can alter the rebound-competent viral reservoir

Affiliations

Transient viral replication during analytical treatment interruptions in SIV infected macaques can alter the rebound-competent viral reservoir

Taina T Immonen et al. PLoS Pathog. .

Abstract

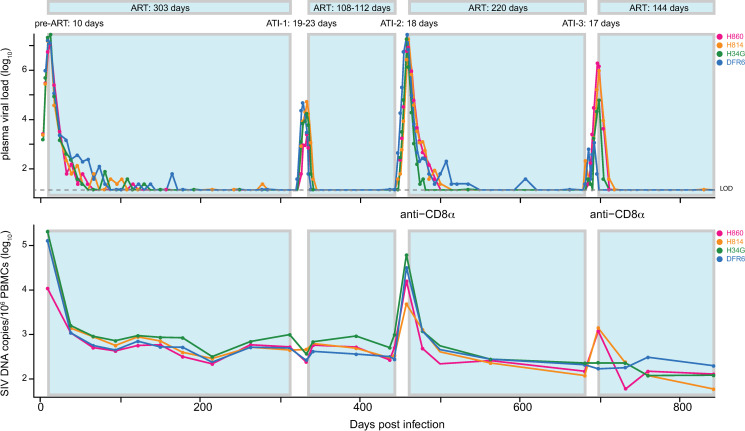
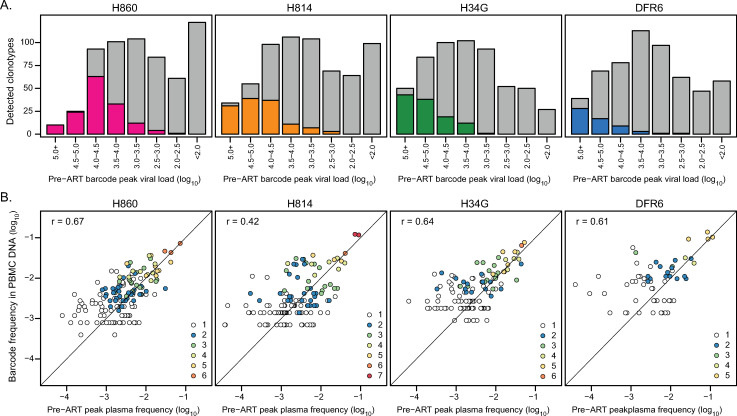
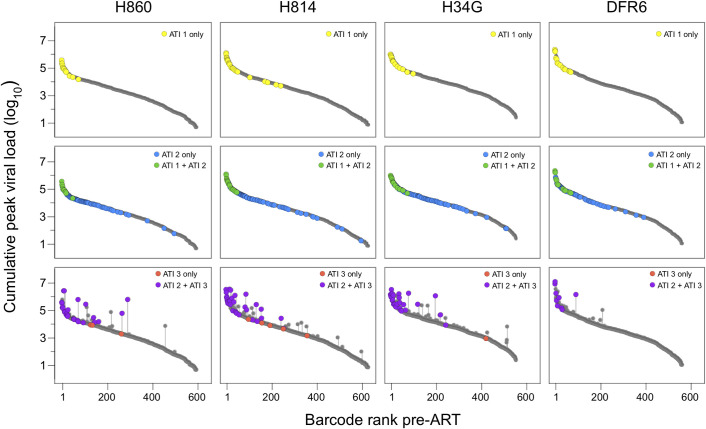
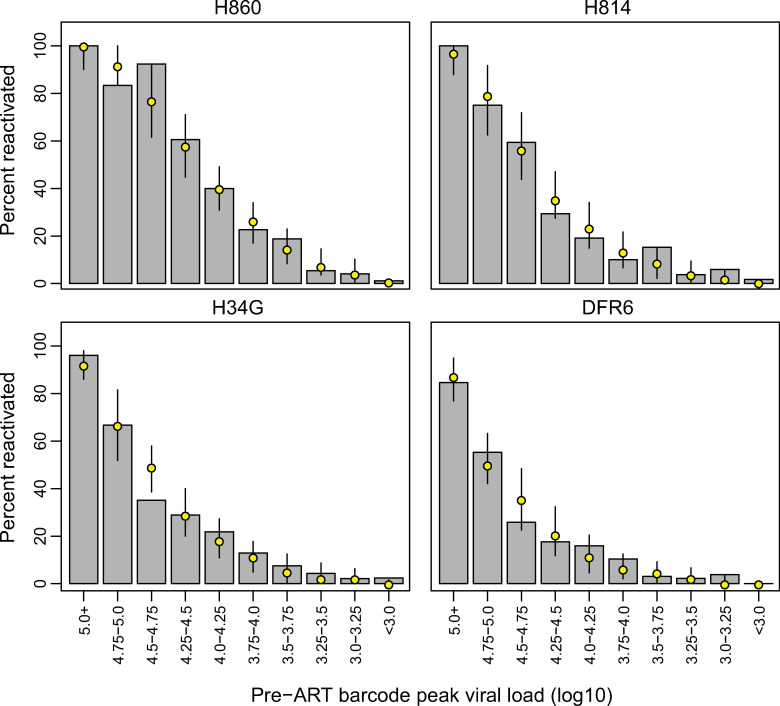
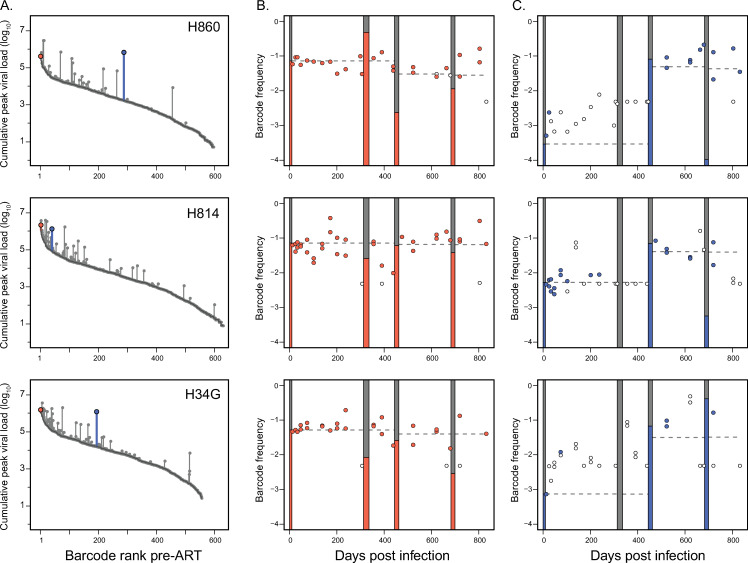
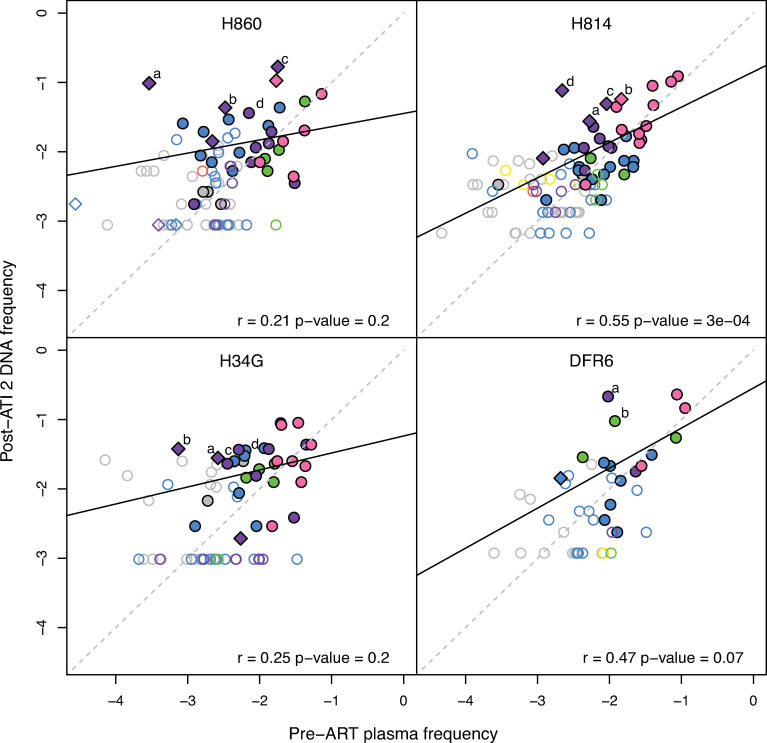
Analytical treatment interruptions (ATIs) of antiretroviral therapy (ART) play a central role in evaluating the efficacy of HIV-1 treatment strategies targeting virus that persists despite ART. However, it remains unclear if ATIs alter the rebound-competent viral reservoir (RCVR), the virus population that persists during ART and from which viral recrudescence originates after ART discontinuation. To assess the impact of ATIs on the RCVR, we used a barcode sequence tagged SIV to track individual viral lineages through a series of ATIs in Rhesus macaques. We demonstrate that transient replication of individual rebounding lineages during an ATI can lead to their enrichment in the RCVR, increasing their probability of reactivating again after treatment discontinuation. These data establish that the RCVR can be altered by uncontrolled replication during ATI.


Conflict of interest statement

The authors have declared that no competing interests exist.

Figures

Fig 1
Fig 1. Viral replication dynamics in plasma and PBMC CA-DNA.
Four Indian-origin Rhesus macaques were infected with SIVmac239M on day 0 and treated with ART on day 10. Viral RNA (copies per mL) were measured in plasma over 843 days with values below 15 copies/mL shown in grey. The animals underwent three treatment interruptions, between 313 to 336 dpi, 444 to 462 dpi, and 682 to 699 dpi. CD8 depletion with anti-CD8α mAb was performed 3 days prior to the last two ATIs. CA-vDNA (per 106 PBMC) was also quantified via qPCR at various times post infection.
Fig 2
Fig 2. Barcode size in pre-therapy plasma is predictive of detection and relative abundance in PBMC CA-vDNA.
(A) barcodes were partitioned into 0.5-log10 intervals based on their pre-ART peak plasma SIV RNA viral loads. The grey bars depict the number of barcodes in each viral load category, and the colored bars highlight the number of lineages that were observed in CA-vDNA in at least one PBMC sample during suppressed viremia between 172 and 313 dpi. (B) The pre-ART plasma frequency attributable to each lineage is plotted against its estimated frequency in vDNA. The Pearson correlation between all lineages detected in at least two PBMC samples is indicated for each animal, with the linear regression line shown in black. The dashed grey line represents a theoretical one-to-one ratio of barcode proportions. The color of the points indicates the number of PBMC samples each barcode was detected in. The number of PBMC samples analyzed was 6 for H860, 8 for H814, 6 for H34G and 5 for DFR6. For H814, no single barcode was detected in all 8 samples.
Fig 3
Fig 3. Reactivation of variants based on viral replication.
Each row depicts reactivation of lineages in the first (top panels), second (middle panels), or third (bottom panels) treatment interruption. The grey points depict the cumulative peak viral loads (pre-ART plus any previous ATI) attributable to each variant and rank-ordered based on their relative frequency at d10. The dark grey lines depict the pre-ART barcode viral loads and the vertical grey lines correspond to the contribution of replication during ATIs to cumulative barcode viral loads. Barcodes detected at ATI-1 are highlighted in yellow; green if also found in ATI-1; and blue if unique to ATI-2. Barcodes detected during ATI-3 are purple if also detected in ATI-2 and red if unique to ATI-3.
Fig 4
Fig 4. Size of viral lineage pre-ART predicts reactivation after treatment discontinuation.
Barcodes were partitioned into 0.25-log10 intervals based on their pre-ART plasma viral loads. The grey bars depict the proportion of barcodes from each viral load category that were observed at peak rebound viremia during ATI-2. The yellow points correspond to the median simulated number of reactivated barcodes in each category, with 90% credibility intervals.
Fig 5
Fig 5. Frequency of rebounding lineages in CA-vDNA on ART reflects replication during ATIs.
The relative DNA frequencies of select lineages that rebounded in ATI-3 are tracked in vDNA on ART for animals H860, H814, and H34G. In panel (A), the grey points correspond to the cumulative peak viral loads of barcodes, rank-ordered based on their relative frequency at d10. The dark grey lines depict the pre-ART barcode distribution, with increases in total viral load highlighted by vertical line segments. Select lineages that were dominant in pre-ART plasma viremia but subsequently increased negligibly in total viral load are highlighted in red, while variants with over 10-fold higher level of replication during ATI-2 than primary infection are highlighted in blue. In panel (B), the red filled circles depict the relative frequencies of predominant barcodes in vDNA while the open circles indicate the limit of detection at time points when a particular barcode was not observed. The grey bars highlight the time intervals when the animals were off therapy, with the red bars indicating the relative frequency of the barcode at peak viremia during each interval. In panel (C), the blue filled circles depict the vDNA frequencies of the lineages that replicated substantially during ATI-2, while the open circles indicate the limit of detection at time points when a particular barcode was not observed. The grey bars again highlight the time intervals when the animals were off therapy, with the blue bars indicating the relative frequency of that barcode at peak viremia during each interval. The dashed lines indicate the relative frequency of each lineage based on cumulative peak plasma viral load.
Fig 6
Fig 6. Changes to the composition of the PBMC CA-vDNA population.
The estimated average DNA frequencies of all barcodes in post-ATI-2 on-ART samples compared to their relative frequencies in pre-ART plasma. The open symbols designate barcodes detected only at a single time point. The diamonds highlight barcodes that replicated at least 10-fold more in ATI-2 than pre-ART. The color coding designates which ATIs the barcodes were detected in: no ATI (grey), ATI-1 only (yellow), ATI-2 only (blue), ATI-3 only (red), ATI-1 and ATI-2 (green), ATI-2 and ATI-3 (purple), all ATIs (pink). The dark solid lines depict the linear regressions, while the grey dashed lines represent theoretical one-to-one correspondence.

References

    1. Finzi D, Hermankova M, Pierson T, Carruth LM, Buck C, Chaisson RE, et al.. Identification of a reservoir for HIV-1 in patients on highly active antiretroviral therapy. Science. 1997;278(5341):1295–300. Epub 1997/11/21. doi: 10.1126/science.278.5341.1295 . - DOI - PubMed
    1. Chun TW, Stuyver L, Mizell SB, Ehler LA, Mican JA, Baseler M, et al.. Presence of an inducible HIV-1 latent reservoir during highly active antiretroviral therapy. Proc Natl Acad Sci U S A. 1997;94(24):13193–7. Epub 1997/12/16. doi: 10.1073/pnas.94.24.13193 ; PubMed Central PMCID: PMC24285. - DOI - PMC - PubMed
    1. Chun TW, Davey RT Jr., Engel D, Lane HC, Fauci AS. Re-emergence of HIV after stopping therapy. Nature. 1999;401(6756):874–5. Epub 1999/11/30. doi: 10.1038/44755 . - DOI - PubMed
    1. Davey RT Jr., Bhat N, Yoder C, Chun TW, Metcalf JA, Dewar R, et al.. HIV-1 and T cell dynamics after interruption of highly active antiretroviral therapy (HAART) in patients with a history of sustained viral suppression. Proc Natl Acad Sci U S A. 1999;96(26):15109–14. Epub 1999/12/28. doi: 10.1073/pnas.96.26.15109 ; PubMed Central PMCID: PMC24781. - DOI - PMC - PubMed
    1. Finzi D, Blankson J, Siliciano JD, Margolick JB, Chadwick K, Pierson T, et al.. Latent infection of CD4+ T cells provides a mechanism for lifelong persistence of HIV-1, even in patients on effective combination therapy. Nat Med. 1999;5(5):512–7. Epub 1999/05/06. doi: 10.1038/8394 . - DOI - PubMed

Publication types

MeSH terms

Substances