. 2021 Jun 24;184(13):3474-3485.e11.
doi: 10.1016/j.cell.2021.05.033. Epub 2021 May 24.

Coupling of N7-methyltransferase and 3'-5' exoribonuclease with SARS-CoV-2 polymerase reveals mechanisms for capping and proofreading

Affiliations

Coupling of N7-methyltransferase and 3'-5' exoribonuclease with SARS-CoV-2 polymerase reveals mechanisms for capping and proofreading

Liming Yan et al. Cell. .

Abstract

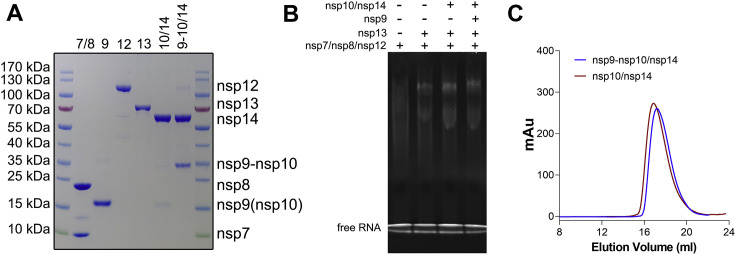
The capping of mRNA and the proofreading play essential roles in SARS-CoV-2 replication and transcription. Here, we present the cryo-EM structure of the SARS-CoV-2 replication-transcription complex (RTC) in a form identified as Cap(0)-RTC, which couples a co-transcriptional capping complex (CCC) composed of nsp12 NiRAN, nsp9, the bifunctional nsp14 possessing an N-terminal exoribonuclease (ExoN) and a C-terminal N7-methyltransferase (N7-MTase), and nsp10 as a cofactor of nsp14. Nsp9 and nsp12 NiRAN recruit nsp10/nsp14 into the Cap(0)-RTC, forming the N7-CCC to yield cap(0) (7MeGpppA) at 5' end of pre-mRNA. A dimeric form of Cap(0)-RTC observed by cryo-EM suggests an in trans backtracking mechanism for nsp14 ExoN to facilitate proofreading of the RNA in concert with polymerase nsp12. These results not only provide a structural basis for understanding co-transcriptional modification of SARS-CoV-2 mRNA but also shed light on how replication fidelity in SARS-CoV-2 is maintained.

Keywords: SARS-CoV-2; cryo-EM; mRNA capping; proofreading; replication-transcription complex.


Conflict of interest statement

Declaration of interests The authors declare no competing interests.

Figures

None
Graphical abstract
Figure S1
Figure S1
Biochemical analysis, related to Figure 1 (A) 10% SDS-PAGE analysis of the components used to constitute the RTCs. Lanes 1 and 8, markers; lane 2, nsp7/nsp8; lane 3, nsp9; lane 4, nsp12; lane 5, nsp13; lane 6, nsp10/nsp14 complex; lane 7, nsp9-10/nsp14 complex. The gel was stained with Coomassie blue. Because nsp14 cannot be purified in the absence of nsp10 or nsp9-nsp10, there is no sample for the individual nsp14. The molecular weights of protein markers are indicated on the left of the SDS-PAGE. (B) Native gel electrophoretic mobility shift assay reveals the formation of the stable complex. The 6% polyacrylamide gel was visualized with ethidium bromide to stain the RNA. (C) Purification of nsp10/nsp14 and nsp9-10/nsp14 complexes by size exclusion chromatography.
Figure S2
Figure S2
Cryo-EM reconstruction of SARS-CoV-2 Cap(−1)′-RTC incubated with nsp10/nsp14, related to Figure 1 (A) Raw image of the SARS-CoV-2 Cap(-)’-RTC with nsp10/14 complex particles in vitreous ice recorded at defocus values of −1.0 to −1.8 μm. Scale bar, 50 nm. (B) Power spectrum of the image shown in (A), with an indication of the spatial frequency corresponding to 3.0 Å resolution. (C) Representative class averages. The edge of each square is ~367 Å in length. (D) Flowchart of SARS-CoV-2 Cap(-)’-RTC with nsp10/14 reconstruction. Local resolution estimation is shown at the bottom panel. (E) Fourier shell correlation (FSC) of the final 3D reconstruction following gold standard refinement. FSC curves are plotted before and after masking. (F) Angular distribution heatmap of particles used for the refinement. (G) The 3DFSC sphericity analyzed with 3DFSC in cryoSPARC(Punjani et al., 2017)
Figure S3
Figure S3
Comparison of cryo-EM densities, related to Figure 1 The cryo-EM densities of Cap(−1)’-RTC (A), initial test dataset for Cap(−1)’-RTC incubated with nsp10/nsp14 (B), and mCap(0)-RTC with final resolution (C) are shown in the same orientation and threshold. The color scheme is the same as that used in Figure 1.
Figure 1
Figure 1
Overall structure (A) Domain organization of each component in Cap(0)-RTC. The color scheme for each component in Cap(0)-RTC is generally similar to that used previously (Gao et al., 2020; Yan et al., 2020, 2021), with modifications. Nsp7, deep purple; nsp8-1, gray; nsp8-2, green cyan; nsp9, purple blue; nsp10, slate; nsp12 NiRAN, yellow; nsp12 Interface, orange; nsp12 fingers, blue; nsp12 palm, red; nsp12 thumb, forest; nsp13 ZBD, light green; nsp13 S, salmon; nsp13 1B, violet; nsp13 1A, sand; nsp13 2A, hot pink; nsp14 ExoN, pale green; nsp14 N7-MTase, brown. (B and C) Structure of mCap(0)-RTC (B) and dCap(0)-RTC (C) in cartoon diagrams (top panels) and the cryo-EM densities (bottom panels) are shown in three perpendicular views. The 2-fold axis is indicated by ellipses (left and right panel) or an arrow (middle panel). The dashed lines roughly indicate the boundary of two Cap(0)-RTC protomers in dCap(0)-RTC (C).
Figure S4
Figure S4
Cryo-EM reconstruction of SARS-CoV-2 Cap(0)-RTC, related to Figure 1 (A) Raw image of the dCap(0)-RTC and mCap(0)-RTC particles in vitreous ice recorded at defocus values of −1.0 to −1.8 μm. Scale bar, 50 nm. (B) Power spectrum of the image shown in (A), with an indication of the spatial frequency corresponding to 3.0 Å resolution. (C) Representative class averages. The edge of each square is ~367 Å. (D) Flowchart of SARS-CoV-2 dCap(0)-RTC and mCap(0)-RTC reconstruction. Local resolution estimation is shown at the bottom panel.(E) Fourier shell correlation (FSC) of the final 3D reconstruction following gold standard refinement. FSC curves are plotted before and after masking. (F) Angular distribution heatmap of particles used for the refinement. (G) The 3DFSC sphericity analyzed with 3DFSC in cryoSPARC(Punjani et al., 2017).
Figure S5
Figure S5
Density and structure of Cap(0)-RTC, related to Figure 1 (A) Density of Cap(0)-RTC (Related to Figure 1). Structures of Nsp12 NiRAN, nsp9, nsp10 and nsp14 are overlaid with the cryo-EM map of dCap(0)-RTC protomer in the middle panel. Four parts are shown in enlarged panels. The polypeptides of Cap(0)-RTC are displayed as colored cartoons; residues in the enlarged panels are exhibited as colored sticks; the cryo-EM densities are shown as gray mesh with the sigma value of 10. The color scheme is the same as used in Figure 1. (B) Structure of dCap(0)-RTC (Related to Figure 1C). Structure of dCap(0)-RTC in cartoon diagrams (upper panels) and the cryo-EM densities (bottom panels) are shown in three perpendicular views. The two-fold axis is indicated as ellipses (left and right panel) or an arrow (middle panel). The dashed lines roughly indicate the boundary of two Cap(0)-RTC protomers in dCap(0)-RTC (C). Compared to Figure 1C, one Cap(0)-RTC protomer is shown in colored scheme, while the other protomer is colored in white.
Figure 2
Figure 2
Architecture of N7-CCC (A) N7-CCC in Cap(0)-RTC protomer is shown as colored cartoons from a side view (top panel) and a top view (bottom panel). For a clear representation, the components of EC in Cap(0)-RTC protomer is shown as a white molecular surface, whereas the primer-template RNAs are shown as cartoon diagrams. (B–D) Inter-molecular interactions in N7-CCC. The polypeptides of nsp9, nsp10, and nsp12 NiRAN are shown as colored cartoons; nsp14 is covered by a colored surface. The interacting residues of nsp14 to contact with nsp9 and nsp12 are highlighted by the color of their interacting partners with labels (B and C). The inter-molecular interactions of nsp14 with nsp9/nsp12 are shown in detail (C, right panel). The interacting residues of nsp14 to contact with nsp10 are highlighted by the color as in nsp10 (D).
Figure S6
Figure S6
Structure of nsp10/nsp14 and sequence comparison, related to Figure 2 (A) The structures of nsp10/nsp14 complex in Cap(0)-RTC and in crystallo(Ma et al., 2015) (PDB code: 5C8S) are aligned. Nsp14 as it appears in the crystal structure is colored in magenta; nsp14 in Cap(0)-RTC and nsp10 are colored as the same scheme in Figure 1. The cryo-EM density (at a sigma value of 8.5) of the loop region spanning residues nsp14S454-nsp14D464 is shown in the right panel. (B) The alignment of nsp14 encoding by SARS-2, SARS, MERS, RaTG13. The residues in blue, light blue, or white shading indicate the identical, conserved or non-conserved residues, respectively. The interacting residues of nsp14 are highlighted by colored frames.
Figure 3
Figure 3
Inter-protomer interactions (A) One Cap(0)-RTC protomer is shown as a cartoon diagram and the another is shown as a molecular surface. The inter-protomer interacting regions are indicated by the dashed frames. (B) Key residues on the inter-protomer interface. The Cap(0)-RTC protomer is colored as in Figure 1. The interacting residues are highlighted by a white color on the surface with labels. (C and D) The interaction details in regions 1 and 2. The interacting residues are displayed as colored sticks. Dashed lines indicate contact distances less than 3.5 Å.
Figure 4
Figure 4
Conformational change of nsp13-2 1B (A) Comparison of nsp13 in E-RTC and dCap(0)-RTC. The polypeptides of nsp13-1 and nsp13-2 in E-RTC are colored light blue, whereas these in dCap(0)-RTC are shown as the color scheme in Figure 1. (B–E) Comparison of orientations of nsp13 in mCap(0)-RTC (B), dCap(0)-RTC (C), E-RTC (D), and Cap(−1)′-RTC (E). The helicases are shown as colored surfaces, while nsp7, nsp8, and nsp12 are shown as white surfaces. Template and primer RNAs are shown as colored cartoons. Four structures are aligned with the guidance of nsp12 and shown in the same orientation. The red dashed lines indicate the positions of the edge of nsp8-2 to compare the locations of subunits. (F–I) Enlarged views of nsp13-2 1B in RTCs. The polypeptides in RTCs are shown as colored cartoons with the color scheme as in Figure 1. Nsp13-2 1B is covered by cryo-EM densities (gray mesh); the unpaired 5′ extension of template RNA bound with nsp13-2 in dCap(0)-RTC (G) and E-RTC (H) are covered by cryo-EM densities as red meshes. (J) Interaction of nsp13-2 1B with nsp13-1 ZBD and nsp8-1 in dCap(0)-RTC. The interacting residues are displayed as colored sticks. (K and L) Interaction of nsp13-2 1B with the unpaired 5′ extension of template RNA in dCap(0)-RTC (K) and E-RTC (L). Key interacting residues and RNA molecules are shown as colored sticks.
Figure 5
Figure 5
A potential transferring path for pre-mRNA in capping (A) An overall view of N7-CCC. N7-CCC is shown as colored cartoon and the EC is covered by white molecular surface. Nsp9, nsp10, nsp12 NiRAN, nsp14 ExoN, and nsp14 N7-MTase are colored purple, blue, yellow, pale green, and brown, respectively. A GpppA and a SAM bound to nsp14 N7-MTase in the crystal structure (Ma et al., 2015) (PDB code: 5C8S) are shown as spheres with colors as following: C atoms for SAM, cyan; C atoms for GpppA, yellow; O atoms, red; N atoms, blue; P atoms, gold. GDP-Mg2+ bound in the catalytic center of nsp12 NiRAN in Cap(−1)′-RTC (Yan et al., 2021) (PDB code: 7CYQ) is shown as spheres with C atoms in green color to indicate the catalytic center of nsp12 NiRAN. A zinc finger (ZF3) in nsp14 N7-MTase is highlighted by a black dashed circle. (B) The electrostatic potential surface of nsp14 in Cap(0)-RTC in views from the side of and the opposite side where the catalytic center of nsp12 NiRAN is located. Positively charged regions that potentially constitute pre-mRNA transferring path are highlighted by dashed frames.
Figure 6
Figure 6
An in trans backtracking model for proofreading (A) Distance between the catalytic center of nsp14 ExoN in one Cap(0)-RTC protomer with the 5′ end of primer RNA in the same Cap(0)-RTC protomer and the catalytic center of nsp12 polymerase in two Cap(0)-RTC protomers of the dimeric Cap(0)-RTC. The polypeptides of nsp14 ExoN are shown as a cartoon diagram in pale green, whereas other polypeptides in the dimeric Cap(0)-RTC are displayed as white cartoons. The catalytic residues in the nsp14 ExoN active center are shown as red spheres. The nucleotides at the 3′ end of the modeled primer RNA is displayed as red spheres to indicate the catalytic center of nsp12 polymerase. The nucleotide at the 5′ end of the modeled primer RNA is also displayed as red spheres. The distances are indicated by arrows with labels. (B and C) A close-up view of the machinery for in trans backtracking proofreading. In protomer A, the fingers, palm, and thumb domains of nsp12 are shown as cartoons in blue, red, and green. The template and primer RNAs are represented in cartoon diagram and the nucleotide at the 3′ end of primer is shown as colored spheres. Other components in protomer A are displayed as a semi-transparent white molecular surface. In protomer B, nsp14 ExoN is shown as cartoon in pale green, while other components in protomer B are shown as a molecular surface in the same colors used in Figure 1. The catalytic residues of nsp14 ExoN in protomer B are shown as colored stick models and are highlighted by a red dashed circle. The boundary of the two protomers is indicated by a black dashed line. A channel for the backtracked primer RNA is indicated by a red dashed line with an arrow. A view from the opposite side is shown in (C). (D) A schematic representation of an in trans backtracking model for proofreading. Triangles in brown represent nsp13 1B; blue and red bars represent the correct nucleotides in template and primer RNAs, while the green bars indicate the mis-matched nucleotides.

References

    1. Afonine P.V., Klaholz B.P., Moriarty N.W., Poon B.K., Sobolev O.V., Terwilliger T.C., Adams P.D., Urzhumtsev A. New tools for the analysis and validation of cryo-EM maps and atomic models. Acta Crystallogr. D Struct. Biol. 2018;74:814–840. - PMC - PubMed
    1. Bouvet M., Debarnot C., Imbert I., Selisko B., Snijder E.J., Canard B., Decroly E. In vitro reconstitution of SARS-coronavirus mRNA cap methylation. PLoS Pathog. 2010;6:e1000863. - PMC - PubMed
    1. Bouvet M., Imbert I., Subissi L., Gluais L., Canard B., Decroly E. RNA 3′-end mismatch excision by the severe acute respiratory syndrome coronavirus nonstructural protein nsp10/nsp14 exoribonuclease complex. Proc. Natl. Acad. Sci. USA. 2012;109:9372–9377. - PMC - PubMed
    1. Case J.B., Ashbrook A.W., Dermody T.S., Denison M.R. Mutagenesis of S-Adenosyl-l-Methionine-Binding Residues in Coronavirus nsp14 N7-Methyltransferase Demonstrates Differing Requirements for Genome Translation and Resistance to Innate Immunity. J. Virol. 2016;90:7248–7256. - PMC - PubMed
    1. Chen Y., Cai H., Pan J., Xiang N., Tien P., Ahola T., Guo D. Functional screen reveals SARS coronavirus nonstructural protein nsp14 as a novel cap N7 methyltransferase. Proc. Natl. Acad. Sci. USA. 2009;106:3484–3489. - PMC - PubMed

Publication types

LinkOut - more resources