

Comparison of two digital PCR methods for EGFR DNA and SARS-CoV-2 RNA quantification
- PMID: 34144041
- PMCID: PMC8206622
- DOI: 10.1016/j.cca.2021.06.016
Comparison of two digital PCR methods for EGFR DNA and SARS-CoV-2 RNA quantification
Abstract
Background: The COVID-19 pandemic caused by the severe acute SARS-CoV-2 virus has undeniably highlighted the importance of reliable nucleic acid quantification. Digital PCR (dPCR) is capable of the absolute quantification of nucleic acids.
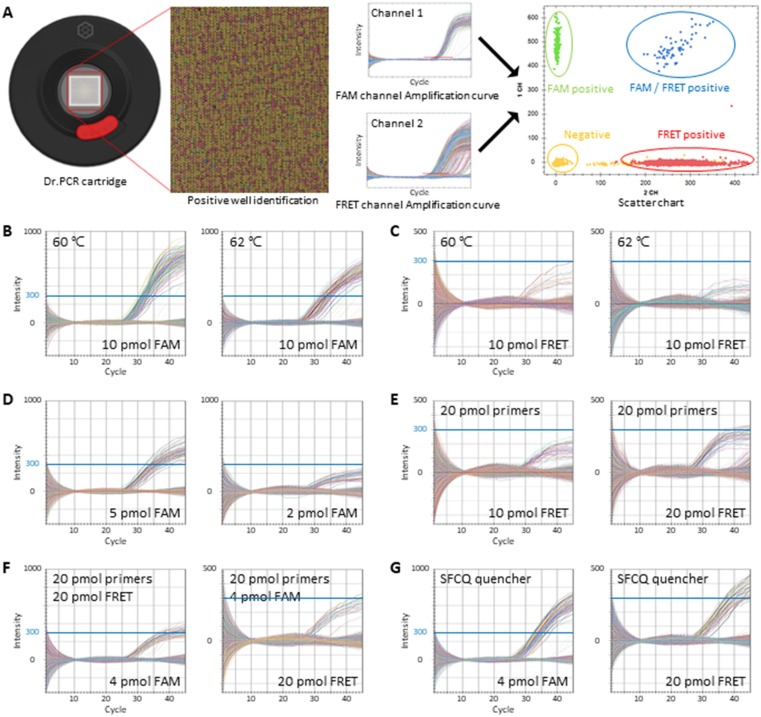
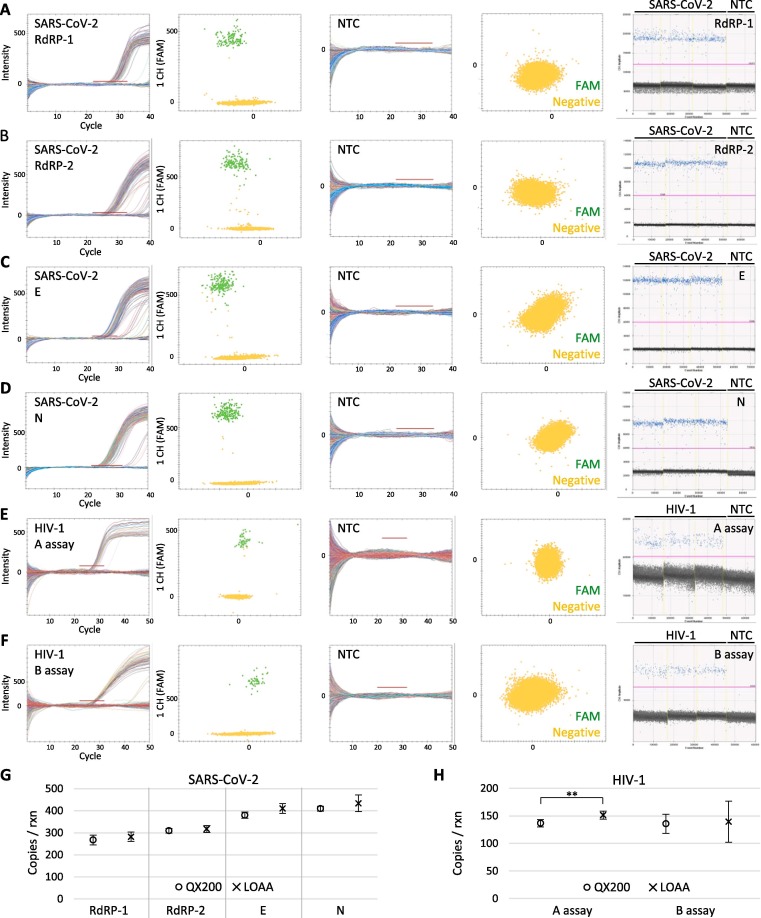
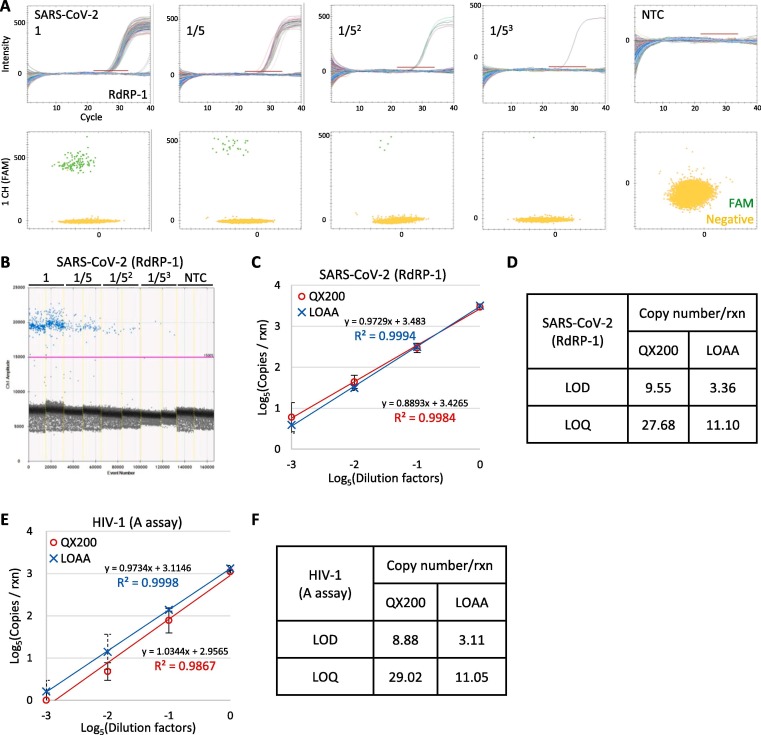
Method: By using the droplet dPCR (QX200) and the digital real-time PCR (LOAA), the copy numbers were compared via multiple assays for three distinct targerts; EGFR DNA, SARS-CoV-2 and HIV-1 RNA.
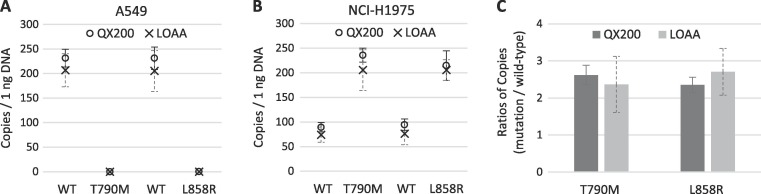
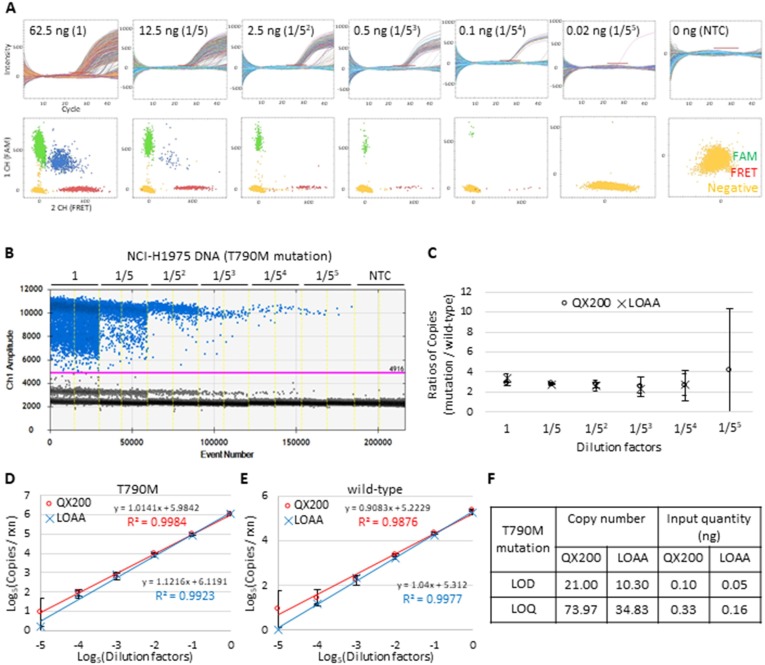
Results: The droplet dPCR and digital real-time PCR showed similar copy numbers for both DNA and RNA quantification. When the limit of detection (LOD) and limit of quantitation (LOQ) of each method were estimated for DNA and RNA targets, the digital real-time PCR showed a higher sensitivity and precision especially with low copy number targets.
Conclusion: The breath of nucleic acid testing in diagnostic applications continues to expand. In this study we applied common diagnostic targets to a novel digital real-time PCR methodology. It performed comparably to the established dPCR method with distinctive advantages and disadvantages for implementing in laboratories. These rapidly developing dPCR systems can be applied to benefit the accurate and sensitive nucleic acid testing for various clinical areas.
Keywords: Digital PCR; Digital real-time PCR; EGFR; HIV-1; SARS-CoV-2.
Copyright © 2021 The Author(s). Published by Elsevier B.V. All rights reserved.
Conflict of interest statement
The authors declare that they have no known competing financial interests or personal relationships that could have appeared to influence the work reported in this paper.
Figures
Similar articles
-
Interlaboratory assessment of quantification of SARS-CoV-2 RNA by reverse transcription digital PCR.Anal Bioanal Chem. 2021 Dec;413(29):7195-7204. doi: 10.1007/s00216-021-03680-2. Epub 2021 Oct 26. Anal Bioanal Chem. 2021. PMID: 34697653 Free PMC article.
-
Absolute quantification of SARS-CoV-2 with Clarity Plus™ digital PCR.Methods. 2022 May;201:26-33. doi: 10.1016/j.ymeth.2021.07.005. Epub 2021 Jul 15. Methods. 2022. PMID: 34273478 Free PMC article.
-
SARS-CoV-2 in digital era: Diagnostic techniques and importance of nucleic acid quantification with digital PCRs.Rev Med Virol. 2023 Sep;33(5):e2471. doi: 10.1002/rmv.2471. Epub 2023 Aug 2. Rev Med Virol. 2023. PMID: 37529971 Review.
-
Detection of SARS-CoV-2 RNA in nasopharyngeal swabs from COVID-19 patients and asymptomatic cases of infection by real-time and digital PCR.Klin Lab Diagn. 2020 Dec 29;65(12):785-792. doi: 10.18821/0869-2084-2020-65-12-785-792. Klin Lab Diagn. 2020. PMID: 33373511 English.
-
Diagnostic performances of common nucleic acid tests for SARS-CoV-2 in hospitals and clinics: a systematic review and meta-analysis.Lancet Microbe. 2021 Dec;2(12):e704-e714. doi: 10.1016/S2666-5247(21)00214-7. Epub 2021 Oct 13. Lancet Microbe. 2021. PMID: 34661181 Free PMC article.
Cited by
-
Self-correction of cycle threshold values by a normal distribution-based process to improve accuracy of quantification in real-time digital PCR.Anal Bioanal Chem. 2024 Apr;416(10):2453-2464. doi: 10.1007/s00216-024-05208-w. Epub 2024 Feb 24. Anal Bioanal Chem. 2024. PMID: 38400940
-
Electrochemical biosensor based on topological insulator Bi2Se3 tape electrode for HIV-1 DNA detection.Mikrochim Acta. 2022 Jul 19;189(8):285. doi: 10.1007/s00604-022-05365-8. Mikrochim Acta. 2022. PMID: 35851426
-
Comparison of RT-qPCR and RT-ddPCR with Rift valley fever virus (RVFV) RNA.Sci Rep. 2023 Feb 22;13(1):3085. doi: 10.1038/s41598-023-29023-y. Sci Rep. 2023. PMID: 36813787 Free PMC article.
-
Comparison and Validation of Rapid Molecular Testing Methods for Theranostic Epidermal Growth Factor Receptor Alterations in Lung Cancer: Idylla versus Digital Droplet PCR.Int J Mol Sci. 2023 Oct 27;24(21):15684. doi: 10.3390/ijms242115684. Int J Mol Sci. 2023. PMID: 37958668 Free PMC article.
-
Comparison of microbial molecular diagnosis efficiency within unstable template metagenomic DNA samples between qRT-PCR and chip-based digital PCR platforms.Genomics Inform. 2023 Dec;21(4):e52. doi: 10.5808/gi.23068. Epub 2023 Dec 29. Genomics Inform. 2023. PMID: 38224719 Free PMC article.
References
MeSH terms
Substances
LinkOut - more resources
Full Text Sources
Medical
Research Materials
Miscellaneous
