. 2021 Jun 18;7(25):eabf8630.
doi: 10.1126/sciadv.abf8630. Print 2021 Jun.

Control of intestinal inflammation by glycosylation-dependent lectin-driven immunoregulatory circuits

Affiliations

Control of intestinal inflammation by glycosylation-dependent lectin-driven immunoregulatory circuits

Luciano G Morosi et al. Sci Adv. .

Abstract

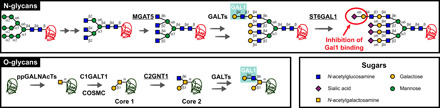
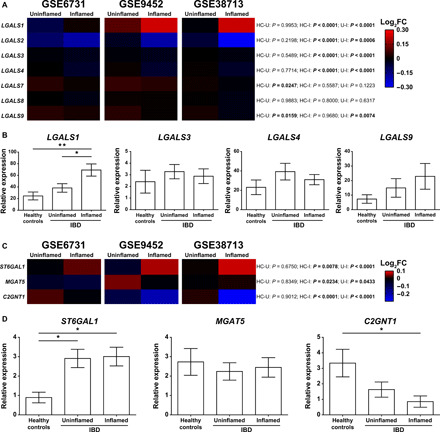
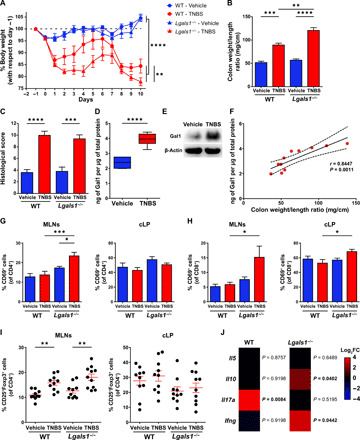
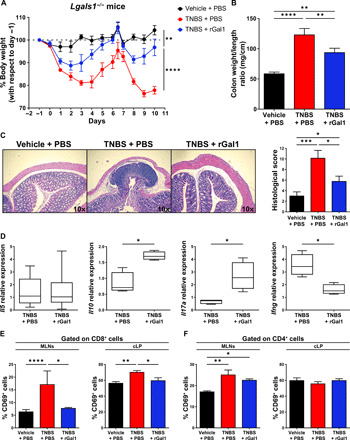
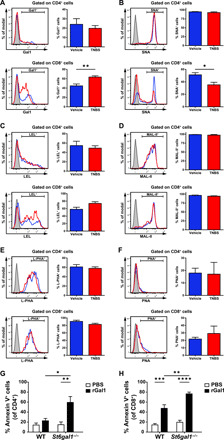
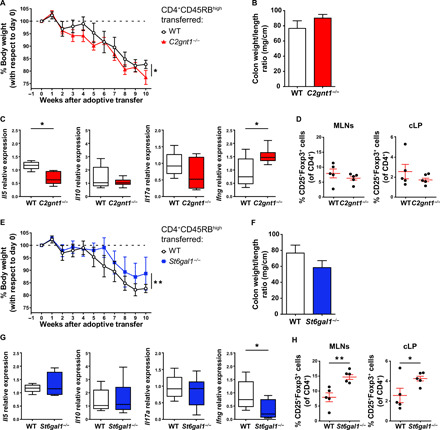
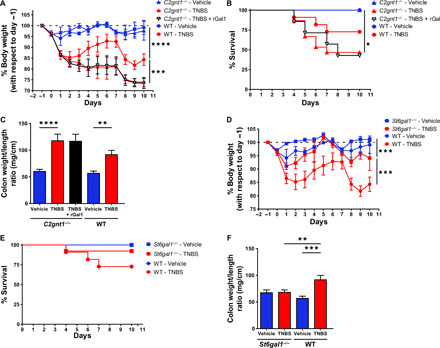
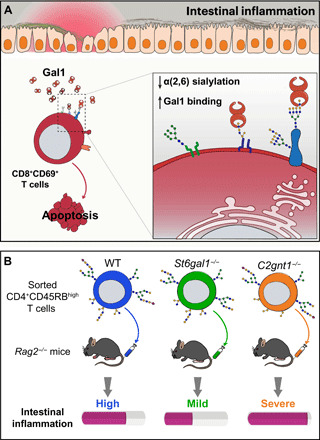
Diverse immunoregulatory circuits operate to preserve intestinal homeostasis and prevent inflammation. Galectin-1 (Gal1), a β-galactoside-binding protein, promotes homeostasis by reprogramming innate and adaptive immunity. Here, we identify a glycosylation-dependent "on-off" circuit driven by Gal1 and its glycosylated ligands that controls intestinal immunopathology by targeting activated CD8+ T cells and shaping the cytokine profile. In patients with inflammatory bowel disease (IBD), augmented Gal1 was associated with dysregulated expression of core 2 β6-N-acetylglucosaminyltransferase 1 (C2GNT1) and α(2,6)-sialyltransferase 1 (ST6GAL1), glycosyltransferases responsible for creating or masking Gal1 ligands. Mice lacking Gal1 exhibited exacerbated colitis and augmented mucosal CD8+ T cell activation in response to 2,4,6-trinitrobenzenesulfonic acid; this phenotype was partially ameliorated by treatment with recombinant Gal1. While C2gnt1-/- mice exhibited aggravated colitis, St6gal1-/- mice showed attenuated inflammation. These effects were associated with intrinsic T cell glycosylation. Thus, Gal1 and its glycosylated ligands act to preserve intestinal homeostasis by recalibrating T cell immunity.


Figures

Fig. 1
Fig. 1. Schematic representation of N- and O-glycan biosynthetic pathways.
Complex N-glycans are synthesized in several steps, including trimming by α-mannosidases and the sequential actions of N-acetylglucosaminyltransferases (MGATs). MGAT5 is the enzyme responsible for β(1,6) branching. The GlcNAc residues can be extended to LacNAc structures via the actions of galactosyltransferases (GALTs); the terminal galactose residues will ultimately undergo α(2,6) sialylation by ST6GAL1. While β(1,6) branching favors Gal1 binding, α(2,6) sialylation inhibits Gal1 recognition of terminal LacNAc structures. Biosynthesis of O-glycans is initiated by polypeptide N-acetylgalactosamine transferases (ppGALNAcTs). Biosynthesis of core 1 is achieved by the action of β(1,3) galactosyltransferase C1GALT1 with assistance from core 1 β(1,3) galactosyltransferase–specific molecular chaperone (COSMC). The resulting disaccharide can undergo branching via the actions of β(1,6) GlcNAc transferases, including C2GNT1 (also called GCNT1), resulting in the generation of core 2 O-glycans. Last, core 2 O-glycans can be further decorated by GALTs, resulting in the synthesis of LacNAc that is recognized by Gal1. Glycans are depicted following the guidelines from the Symbol Nomenclature for Glycans group (72).
Fig. 2
Fig. 2. Dysregulated expression of Gal1 and specific glycosyltransferases in IBD.
(A) Bioinformatic analysis of galectin expression (LGALS1, LGALS2, LGALS3, LGALS4, LGALS7, LGALS8, and LGALS9) in IBD datasets. (B) Expression of LGALS1, LGALS3, LGALS4, and LGALS9 analyzed by RT-qPCR in colon biopsies from healthy controls (n = 8), uninflamed (n = 13), and inflamed (n = 11) areas from colon biopsies of a local cohort of patients with IBD. (C) Bioinformatic analysis of glycosyltransferases relevant for Gal1 binding (ST6GAL1, MGAT5, and C2GNT1) in IBD datasets. (D) Expression of ST6GAL1, MGAT5, and C2GNT1 analyzed by RT-qPCR in colon biopsies from healthy controls (n = 6), uninflamed (n = 15), and inflamed (n = 14) areas from colon biopsies of a local cohort of patients with IBD. In (A) and (C), two-way analysis of variance (ANOVA) followed by Tukey’s posttest was used; colors in the heatmap depict the logarithm (base 2) of the fold change (log2FC), comparing uninflamed (U) and inflamed (I) areas of colon biopsies from patients with IBD with healthy controls (HC). In (B) and (D), one-way ANOVA followed by Tukey’s posttest was used. Unless otherwise stated, data are presented as means ± SEM. HC-U, healthy controls vs. uninflamed areas; HC-I, healthy controls vs. inflamed areas; U-I, uninflamed vs. inflamed areas. *P < 0.05 and **P < 0.01.
Fig. 3
Fig. 3. Lack of endogenous Gal1 exacerbates TNBS-induced colitis.
(A) Weight loss curves of WT and Lgals1−/− mice treated with ethanol (vehicle) or TNBS. Data are from five independent experiments; two-way repeated-measures ANOVA followed by Tukey’s posttest. (B) Colon weight/length ratio. (C) Histopathologic assessment (score) of experimental groups. (D) Determination of Gal1 at day 10 in colon tissue by enzyme-linked immunosorbent assay (ELISA), normalized to total protein in WT mice. Box plots represent median (line), first and third quartiles (box limits), and minimum and maximum values (bars) from a representative of two independent experiments (n = 6 mice per group); unpaired Student’s t test. (E) Detection of Gal1 at euthanize (day 10) in colon protein extracts from WT mice by Western blot. (F) Correlation between Gal1 protein levels and colon weight/length ratio (n = 11 mice); Pearson’s correlation coefficient (r) and P value (P) are indicated. (G and H) CD69 expression among CD4+ (G) or CD8+ (H) T cell populations within MLNs or cLP from vehicle- or TNBS-treated WT or Lgals1−/− mice. Data are from a representative of three independent experiments (n = 10 mice per group). (I) Regulatory T cells (Tregs) in MLNs and cLP of vehicle-treated or TNBS-treated WT or Lgals1−/− mice. Data are from a representative of three independent experiments (n = 10 mice per group). (J) Expression of cytokines mRNA in colon from TNBS-treated WT or Lgals1−/− mice measured by RT-qPCR. Colors shown in the heatmap depict the log2FC for each cytokine in TNBS- versus vehicle-treated mice of each genotype. Multiple t test. In (B), (C), and (G) to (I), two-way ANOVA followed by Tukey’s posttest. Unless otherwise stated, data are presented as means ± SEM. *P < 0.05, **P < 0.01, ***P < 0.001, and ****P < 0.0001.
Fig. 4
Fig. 4. Treatment with rGal1 partially ameliorates exacerbated colitis in Lgals1−/− mice.
(A) Weight loss curves of Lgals1−/− mice treated either with ethanol (vehicle) or TNBS that received daily injections with PBS or 100 μg of rGal1. Data are from three independent experiments; two-way repeated-measures ANOVA followed by Tukey’s posttest. (B) Colon weight/length ratio. Data are from a representative of three independent experiments (n = 5 mice per group). (C) Representative microscopy images [hematoxylin and eosin (H&E) staining; 10× magnification] and histopathologic assessment (score) for each experimental group as described in (A). Data are from a representative of three independent experiments (n = 5 mice per group). (D) Determination of Il5, Il10, Il17a, and Ifng mRNA in colon tissue by RT-qPCR, normalized to Gapdh expression. Box plots represent median (line), first and third quartiles (box limits), and minimum and maximum values (bars) from a representative of three independent experiments (n = 8 mice per group); two-tailed unpaired Student’s t test. (E) Percentage of CD69+ cells within the total CD8+ T cell population in MLNs and cLP. Data are from a representative of three independent experiments (n = 8 mice per group). In MLNs, Kruskal-Wallis followed by Dunn’s posttest; in cLP, one-way ANOVA followed by Tukey’s posttest. (F) Percentage of CD69+ cells within the total CD4+ T cell population in MLNs and cLP. Data are from a representative of three independent experiments (n = 8 mice per group). In (B), (C), and (F), one-way ANOVA followed by Tukey’s posttest. Unless otherwise stated, data are presented as means ± SEM. *P < 0.05, **P < 0.01, ***P < 0.001, and ****P < 0.0001.
Fig. 5
Fig. 5. TNBS-induced colitis induces a Gal1-permissive glycophenotype in cLP CD8+ T cells.
Representative histograms of biotinylated Gal1 (A), Sambucus nigra agglutinin (SNA) (B), Lycopersicon esculentum lectin (LEL) (C), Maackia amurensis lectin II (MAL-II) (D), phytohemagglutinin-L (L-PHA) (E), and peanut agglutinin (PNA) (F) binding to CD4+ and CD8+ T cells isolated from cLP of WT mice treated with ethanol (vehicle, blue lines) or TNBS (red lines). Gray-shaded lines represent negative controls (cells not incubated with biotinylated lectins). Determination of lectin binding within each T cell population is shown. Data are from a representative of two independent experiments (vehicle, n = 4 mice; TNBS, n = 5 mice); two-tailed unpaired Student’s t test. (G and H) Annexin V binding to CD4+ (G) or CD8+ (H) T cells from MLNs isolated from WT or St6gal1−/− mice that were activated for 3 days with anti-CD3/anti-CD28 antibodies and incubated for 16 hours with 10 μM rGal1 or PBS. Data are from five independent experiments; two-way ANOVA followed by Tukey’s posttest. Unless otherwise stated, data are presented as means ± SEM. *P < 0.05, **P < 0.01, ***P < 0.001, and ****P < 0.0001.
Fig. 6
Fig. 6. Intrinsic T cell glycosylation influences development of colitis in an adoptive-transfer T cell model.
(A) Weight loss curves of Rag2−/− mice following adoptive transfer of either WT or C2gnt1−/− CD4+CD45RBhigh T cells. (B) Colon weight/length ratio. (C) Determination of Il5, Il10, Il17a, and Ifng mRNA in colon tissue by RT-qPCR, normalized to Gapdh mRNA expression. (D) Percentage of Tregs within total CD4+ T cells in MLNs and cLP. (E) Weight loss curves of Rag2−/− mice after adoptive transfer of either WT or St6gal1−/− CD4+CD45RBhigh T cells. (F) Colon weight/length ratio. (G) Determination of Il5, Il0, Il17a, and Ifng mRNA in colon tissue by RT-qPCR, normalized to Gapdh mRNA expression. (H) Percentage of Tregs within CD4+ T cells in MLNs and cLP. Experiments described in this figure were performed simultaneously, so values for WT mice are identical and only included in separate panels for the sake of clarity. In (A) and (E), two-way repeated-measures ANOVA followed by Dunnett’s posttest. In (C) and (G), box plots represent median (line), first and third quartiles (box limits), and minimum and maximum values (bars). In (C), (D), (G), and (H), one-way ANOVA followed by Dunnett’s posttest. In all cases, data are from a representative of two independent experiments (n = 5 mice per group). Unless otherwise stated, data are presented as means ± SEM. *P < 0.05 and **P < 0.01.
Fig. 7
Fig. 7. C2GnT1 and ST6Gal1 glycosyltransferases reciprocally control the development of TNBS-induced colitis.
(A) Weight loss curves of WT and C2gnt1−/− mice treated with ethanol (vehicle), TNBS, or TNBS and rGal1. (B) Kaplan-Meier (survival) curves of WT and C2gnt1−/− mice with TNBS-induced colitis treated or not with rGal1. (C) Colon weight/length ratio. (D) Weight loss curves of WT and St6gal1−/− mice treated with ethanol (vehicle) or TNBS. (E) Kaplan-Meier (survival) curves of WT and St6gal1−/− mice with TNBS-induced colitis. (F) Colon weight/length ratio. Experiments described in this figure were performed simultaneously, so values for WT mice are identical and only included in separate panels for the sake of clarity. In (A) and (D), data are from a representative of two independent experiments (n = 5 mice per group); two-way repeated-measures ANOVA followed by Tukey’s post-test. In (B) and (E), data are presented as mean survival proportions from a representative of two independent experiments (n = 7 mice per group); Mantel-Cox (log-rank) test. In (C) and (F), data are from a representative of two independent experiments (n = 5 mice per group); two-way ANOVA followed by Tukey’s posttest. Unless otherwise stated, data are presented as means ± SEM. *P < 0.05, **P < 0.01, ***P < 0.001, and ****P < 0.0001.
Fig. 8
Fig. 8. Modulation of intestinal inflammation via glycosylation-dependent pathways.
(A) Intestinal inflammation in TNBS-induced colitis alters the extent of α(2,6) sialylation in CD8+CD69+ T cells. This altered glycophenotype makes these cells more sensitive to the immune inhibitory action of Gal1 and recalibrates T cell responses. (B) Role of T cell glycosylation in potentiating or attenuating intestinal inflammation in an adoptive transfer model of colitis. Compared to WT T cells, C2gnt1−/− T cells increase disease severity, generating an earlier onset and more pronounced weight loss. Thus, the absence of core 2 O-glycans on CD4+ T cells influences the development and severity of intestinal inflammation. On the other hand, St6gal1−/− T cells transferred to Rag2−/− mice induce a milder intestinal inflammation with a delayed onset, higher proportions of Tregs and lower IFN-γ production.

Similar articles

Cited by

References

    1. Knowles S. R., Graff L. A., Wilding H., Hewitt C., Keefer L., Mikocka-Walus A., Quality of life in inflammatory bowel disease: A systematic review and meta-analyses—Part I. Inflamm. Bowel Dis. 24, 742–751 (2018). - PubMed
    1. Ng S. C., Shi H. Y., Hamidi N., Underwood F. E., Tang W., Benchimol E. I., Panaccione R., Ghosh S., Wu J. C. Y., Chan F. K. L., Sung J. J. Y., Kaplan G. G., Worldwide incidence and prevalence of inflammatory bowel disease in the 21st century: A systematic review of population-based studies. Lancet (London, England). 390, 2769–2778 (2017). - PubMed
    1. Chudy-Onwugaje K. O., Christian K. E., Farraye F. A., Cross R. K., A state-of-the-art review of new and emerging therapies for the treatment of IBD. Inflamm. Bowel Dis. 25, 820–830 (2019). - PMC - PubMed
    1. Olivera P., Danese S., Peyrin-Biroulet L., Next generation of small molecules in inflammatory bowel disease. Gut 66, 199–209 (2017). - PubMed
    1. Moschen A. R., Tilg H., Raine T., IL-12, IL-23 and IL-17 in IBD: Immunobiology and therapeutic targeting. Nat. Rev. Gastroenterol. Hepatol. 16, 185–196 (2019). - PubMed