. 2021 Jun 18;7(25):eabg6680.
doi: 10.1126/sciadv.abg6680. Print 2021 Jun.

Systematic profiling of protein complex dynamics reveals DNA-PK phosphorylation of IFI16 en route to herpesvirus immunity

Affiliations

Systematic profiling of protein complex dynamics reveals DNA-PK phosphorylation of IFI16 en route to herpesvirus immunity

Joshua L Justice et al. Sci Adv. .

Abstract

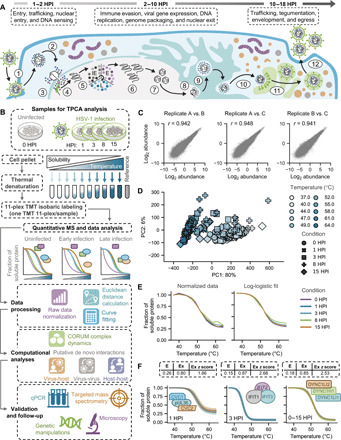
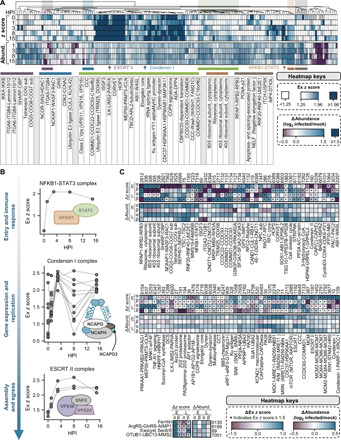
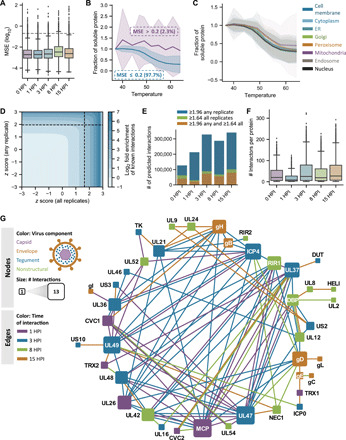
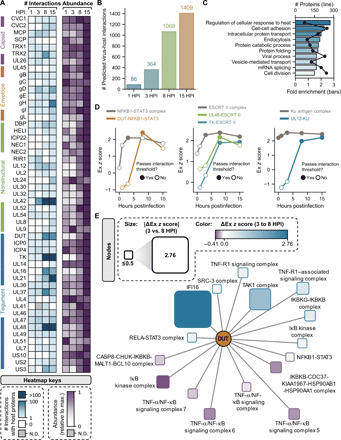
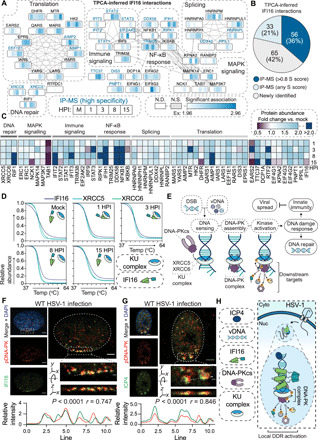
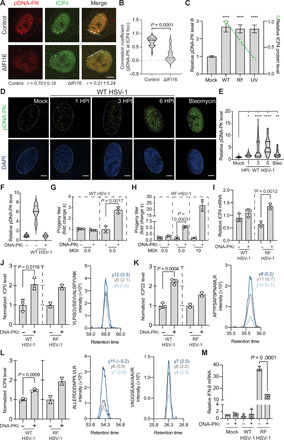
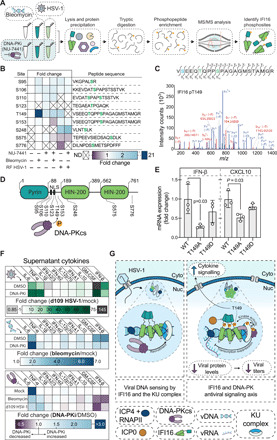
Dynamically shifting protein-protein interactions (PPIs) regulate cellular responses to viruses and the resulting immune signaling. Here, we use thermal proximity coaggregation (TPCA) mass spectrometry to characterize the on-off behavior of PPIs during infection with herpes simplex virus 1 (HSV-1), a virus with an ancient history of coevolution with hosts. Advancing the TPCA analysis to infer associations de novo, we build a time-resolved portrait of thousands of host-host, virus-host, and virus-virus PPIs. We demonstrate that, early in infection, the DNA sensor IFI16 recruits the active DNA damage response kinase, DNA-dependent protein kinase (DNA-PK), to incoming viral DNA at the nuclear periphery. We establish IFI16 T149 as a substrate of DNA-PK upon viral infection or DNA damage. This phosphorylation promotes IFI16-driven cytokine responses. Together, we characterize the global dynamics of PPIs during HSV-1 infection, uncovering the co-regulation of IFI16 and DNA-PK functions as a missing link in immunity to herpesvirus infection.


Figures

Fig. 1
Fig. 1. Leveraging thermal proteome profiling to characterize protein interactions at a global scale during HSV-1 infection.
(A) Schematic representation of the herpes simplex virus 1 (HSV-1) life cycle from cellular entry; expression of the immediate early (IE), early (E), and late (L) genes; genome replication; and to virus assembly and egress over a time period of ~18 hours. (B) Workflow for thermal proteome profiling (TPP) sample preparation and subsequent data processing and computational analysis of uninfected and HSV-1–infected cells. (C) Overall consistency of protein signal detected across three biological replicates (A, B, and C), where the r value represents the pairwise Pearson correlation between replicates across all conditions (see also fig. S1C). (D) Principal components analysis (PCA) plot of all normalized protein abundances demonstrating the separation of different tandem mass tagging (TMT) channels (e.g., temperatures) and HSV-1 conditions (e.g., infection time points). x and y axes denote the percent of the data variance explained by principal components (PC) 1 and 2, respectively (see also fig. S1D). (E) Mean normalized (left) and log-logistic fitted (right) protein solubility curves for each condition across the temperature gradient. (F) Overlapping smoothed protein coaggregation curves for several expected interactions (i.e., known interactions) represented in the dataset. Solid lines and shaded regions represent the mean and SD, respectively, for a given protein across conditions and biological replicates. Average Euclidean distance (E), Ex, and Ex z score values for each set of proteins are also reported.
Fig. 2
Fig. 2. CORUM complex dynamics during HSV-1 infection and a comparative analysis with HCMV infection.
(A) Hierarchical clustering of CORUM complex dynamics during HSV-1 infection. Any complex passing filtering criteria with an average Ex z score ≥ 1.5 across subunits is represented, and both Ex z scores and changes in complex abundance (relative to mock) are plotted. The table below the heatmaps shows the names of selected complexes denoted in the above heatmaps. (B) Dynamic interaction properties of NFKB1-STAT3 (top), Condensin I (middle), and ESCRT II (bottom) complexes during infection with HSV-1. For each complex, all subunits are represented, and each data point represents the Ex z score for a given pair of subunits. Gray lines connect data points for a given pair of subunits across infection time. (C) Comparison of CORUM complex dynamics during HSV-1 (this study) versus HCMV (23) infection. Heatmaps reflect the average change in complex Ex z scores (relative to the previous time point) and abundances (relative to mock) for each complex across both infections for early (HSV-1, 3 HPI; HCMV, 24 HPI) and late (HSV-1, 15 HPI; HCMV, 96 HPI) infection time points. Only complexes meeting our filtering and significance criteria for both viruses are shown.
Fig. 3
Fig. 3. Investigating the functional landscape of thermal profiling data and developing an approach to enrich for putative de novo interactions.
(A) Box-and-whisker plots representing the MSE (i.e., prediction error) for fitted log-logistic protein curves versus normalized solubility values. Boxes span the interquartile range (IQR), while whiskers extend to 1.5*IQR, and outliers outside of this range are plotted in black. The gray dashed line represents an MSE cutoff of 0.2 used for subsequent analyses. (B) Coaggregation curves for proteins with MSE values above and below 0.2. Solid lines and shaded regions represent the mean and SD, respectively, for each category across proteins, conditions, and replicates. (C) Coaggregation curves for proteins localized to different subcellular compartments. Solid lines and shaded regions represent the mean and SD, respectively, for proteins annotated to reside within a given organelle across conditions and replicates. (D) Contour plot showing known interaction enrichment (as represented in CORUM and STRING databases) at increasing Ex z score values when the Ex z scores for a given combination of proteins reach a specific cutoff for all (x axis) or any (y axis) replicate(s). The black dashed lines represent the significance cutoff used to define putative predicted interactions in the rest of this study. (E) Number of putative de novo interactions obtained by applying different Ex z score cutoffs. (F) Box-and-whisker plots showing the distribution of predicted number of interactions per protein at a given time point upon thresholding z scores at the specified cutoff described in the manuscript. (G) Temporal interactions between viral proteins across infection time. Edges represent pairwise Ex z scores between proteins that pass de novo interaction significance thresholding.
Fig. 4
Fig. 4. Virus–host protein interaction dynamics throughout HSV-1 infection.
(A) Heatmap depicting the number of predicted virus-host interactions for each detected viral protein and relative viral protein abundances throughout infection (scaled to their maximum value across all conditions). (B) Number of predicted virus–host protein interactions at each time point following infection. (C) Bar plot showing terms that are overrepresented in the subset of host proteins that are predicted to interact with viral components. (D) Ex z scores for NFKB1-STAT3 complex interactions across infection time with itself and with the viral protein DUT. Solid data points represent Ex z scores surpassing the de novo interaction threshold. Ex z scores for ESCRT II complex interactions across infection time with itself and with viral proteins UL48 and TK. Ex z scores for Ku antigen complex interactions across infection time with itself and with the viral protein UL12. (E) Interaction network of DUT interactions with immune-related complexes and the antiviral DNA sensor IFI16 at 8 HPI relative to 3 HPI. N.D., not detected.
Fig. 5
Fig. 5. IFI16 interacts with the DNA-PK complex at vDNA in the nuclear periphery.
(A) Protein interaction network of TPCA-derived IFI16 PPIs. Gray lines indicate STRING interactions, and proteins are clustered by annotation (STRING and Reactome). Heatmaps above the nodes represent significant Ex z scores for IFI16 interactions with that node at 0, 1, 3, 8, and 15 HPI time points. Proteins previously identified to associate with IFI16 by IP-MS are labeled in blue. N.S., not significant. (B) Pie chart showing the proportion of overlap with IFI16 IP-MS studies for TPCA-inferred interactions. (C) Heatmap of protein abundances over the HSV-1 infection time course relative to the uninfected control. (D) Smoothed protein aggregation curves for IFI16 (dark blue), XRCC5 (teal), and XRCC6 (green) at each time point of infection. (E) Model for the DNA-PK DDR to DSBs and vDNA. (F and G) DNA-PKcs pS2056 (red) staining for immunofluorescent microscopy (IFA) at 100× after wild-type (WT) HSV-1 infection (3 HPI) with staining (green) for either (F) IFI16 or (G) ICP4. Scale bars, 5 or 1 μm in the inset (dashed box). The dashed line in the inset represents line scans for spatial quantification of pDNA-PK versus IFI16 or pDNA-PK versus ICP4 intensities for 30 nuclei across biological replicates (n = 3). Representative images are shown. Pearson’s correlation coefficient (PCC) between pDNA-PK versus IFI16 or ICP4 is represented for the displayed line scan. (H) Model representing IFI16 association with kinase activated DNA-PK holoenzyme with ICP4-labeled vDNA in the nuclear periphery.
Fig. 6
Fig. 6. DNA-PK initiates an antiviral DDR that inhibits HSV-1 replication.
(A and B) WT HSV-1–infected (3 HPI) control and ΔIFI16 HFF cells were stained for DNA-PK activation (pDNA-PK) and ICP4 expression. Colocalization (PCC) was measured at the line (20 nuclei per n; n = 2). (C) ICP4 (green line) and pDNA-PK (gray bars) levels during WT, RF, or ultraviolet (UV)–inactivated WT HSV-1 infection (1 HPI) by IFA. Shown is mean ± 95% confidence interval for 50 nuclei per n (n = 3). (D and E) Time course of DNA-PK activation (green) during WT HSV-1 infection by IFA. Scale bars, 10 μm at 60× magnification. Fifty nuclei per n (n = 4). (F) DNA-PK inhibition (DNA-PKi; NU7441 at 2 μM) efficiency was assessed by pDNA-PK staining in the dimethyl sulfoxide (DMSO) control (−) compared to DNA-PKi (+) (n = 2). (G) WT [multiplicity of infection (MOI) 0.5: n = 5; MOI 5: n = 3] or (H) RF (MOI 0.5: n = 3; MOI 5: n = 3; MOI 10: n = 2) HSV-1 titers (24 HPI) after DNA-PKi or DMSO treatment. Replicates were normalized by the replicate average. (I) ICP4 mRNA levels were quantified by qPCR (ΔΔCt against GAPDH) at 6 HPI. (J to L) (Left) Targeted MS analysis (PRM) of the HSV-1 genes (J) ICP0, (K) ICP22, and (L) ICP4 during WT (n = 3) or RF HSV-1 (n = 2) infection. (Right) The most intense peptide transitions with mass error [parts per million (ppm)]. (M) IFN-β mRNA levels as in (I). Significance was determined by analysis of variance (ANOVA) for (C) and (E) and Student’s t test for all others. Bar plots are mean ± SD and all replicates are biological. See also fig. S4. *P < 0.05, **P < 0.01, ***P < 0.001, and ****P < 0.0001.
Fig. 7
Fig. 7. IFI16 and DNA-PK coordinate an intrinsic immune response to HSV-1 infection.
(A) Schematic for phosphopeptide enrichment following viral infection or DNA damage, using DNA-PKi to identify DNA-PK–dependent IFI16 modifications. (B) Heatmap for phosphopeptide abundances of IFI16 phosphosites. Abundances were normalized per peptide to the untreated control if it was detected in that condition, or otherwise to the bleomycin control (n = 3 to 5 biological replicates). (C) (Top) Amino acid sequence for the doubly phosphorylated peptide containing T149 detected in (B). Highlighted fragment ions detected in the tandem MS (MS/MS) assignment below are indicated in the fragment map. Green highlighted residues represent high-confidence assignment of the phosphosite by the ptmRS algorithm in Proteome Discoverer 2.4. Blue represents a potential phosphosite localization with low confidence. (Bottom) MS/MS of the above amino acid sequence with fragment ions mapped to the observed ions from Proteome Discoverer 2.4. Blue and red highlighted ions are y- and b-ions, respectively. (D) Schematic of IFI16 phosphosites relative to their location on IFI16. (E) WT, phospho-null (T149A), or phosphomimetic (T149D) IFI16 was expressed in ΔIFI16 HFF cells and then IFN-β and CXCL10 levels (mean ± SD) were measured by RT-qPCR at 6 HPI with RF HSV-1. (F) Secreted cytokine protein levels were measured after DNA damage (bleomycin; 24 HPT) and HSV-1 infection (d109; MOI 15; 24 HPT) in DMSO- or DNA-PKi–treated HFF cells (n = 3 biological replicates). (G) Model of IFI16 and DNA-PK interaction during the antiviral response to HSV-1. See also figs. S5 and S6.

References

    1. Whitley R. J., Roizman B., Herpes simplex virus infections. Lancet 357, 1513–1518 (2001). - PubMed
    1. Greco T. M., Diner B. A., Cristea I. M., The impact of mass spectrometry-based proteomics on fundamental discoveries in virology. Annu. Rev. Virol. 1, 581–604 (2014). - PMC - PubMed
    1. Unterholzner L., Keating S. E., Baran M., Horan K. A., Jensen S. B., Sharma S., Sirois C. M., Jin T., Latz E., Xiao T. S., Fitzgerald K. A., Paludan S. R., Bowie A. G., IFI16 is an innate immune sensor for intracellular DNA. Nat. Immunol. 11, 997–1004 (2010). - PMC - PubMed
    1. Li T., Diner B. A., Chen J., Cristea I. M., Acetylation modulates cellular distribution and DNA sensing ability of interferon-inducible protein IFI16. Proc. Natl. Acad. Sci. U.S.A. 109, 10558–10563 (2012). - PMC - PubMed
    1. Diner B. A., Lum K. K., Toettcher J. E., Cristea I. M., Viral DNA sensors IFI16 and cyclic GMP-AMP synthase possess distinct functions in regulating viral gene expression, immune defenses, and apoptotic responses during herpesvirus infection. MBio 7, (2016). - PMC - PubMed

Publication types