. 2021 Jun 18;6(60):eabg0791.
doi: 10.1126/sciimmunol.abg0791.

Activation of mTORC1 at late endosomes misdirects T cell fate decision in older individuals

Affiliations

Activation of mTORC1 at late endosomes misdirects T cell fate decision in older individuals

Jun Jin et al. Sci Immunol. .

Abstract

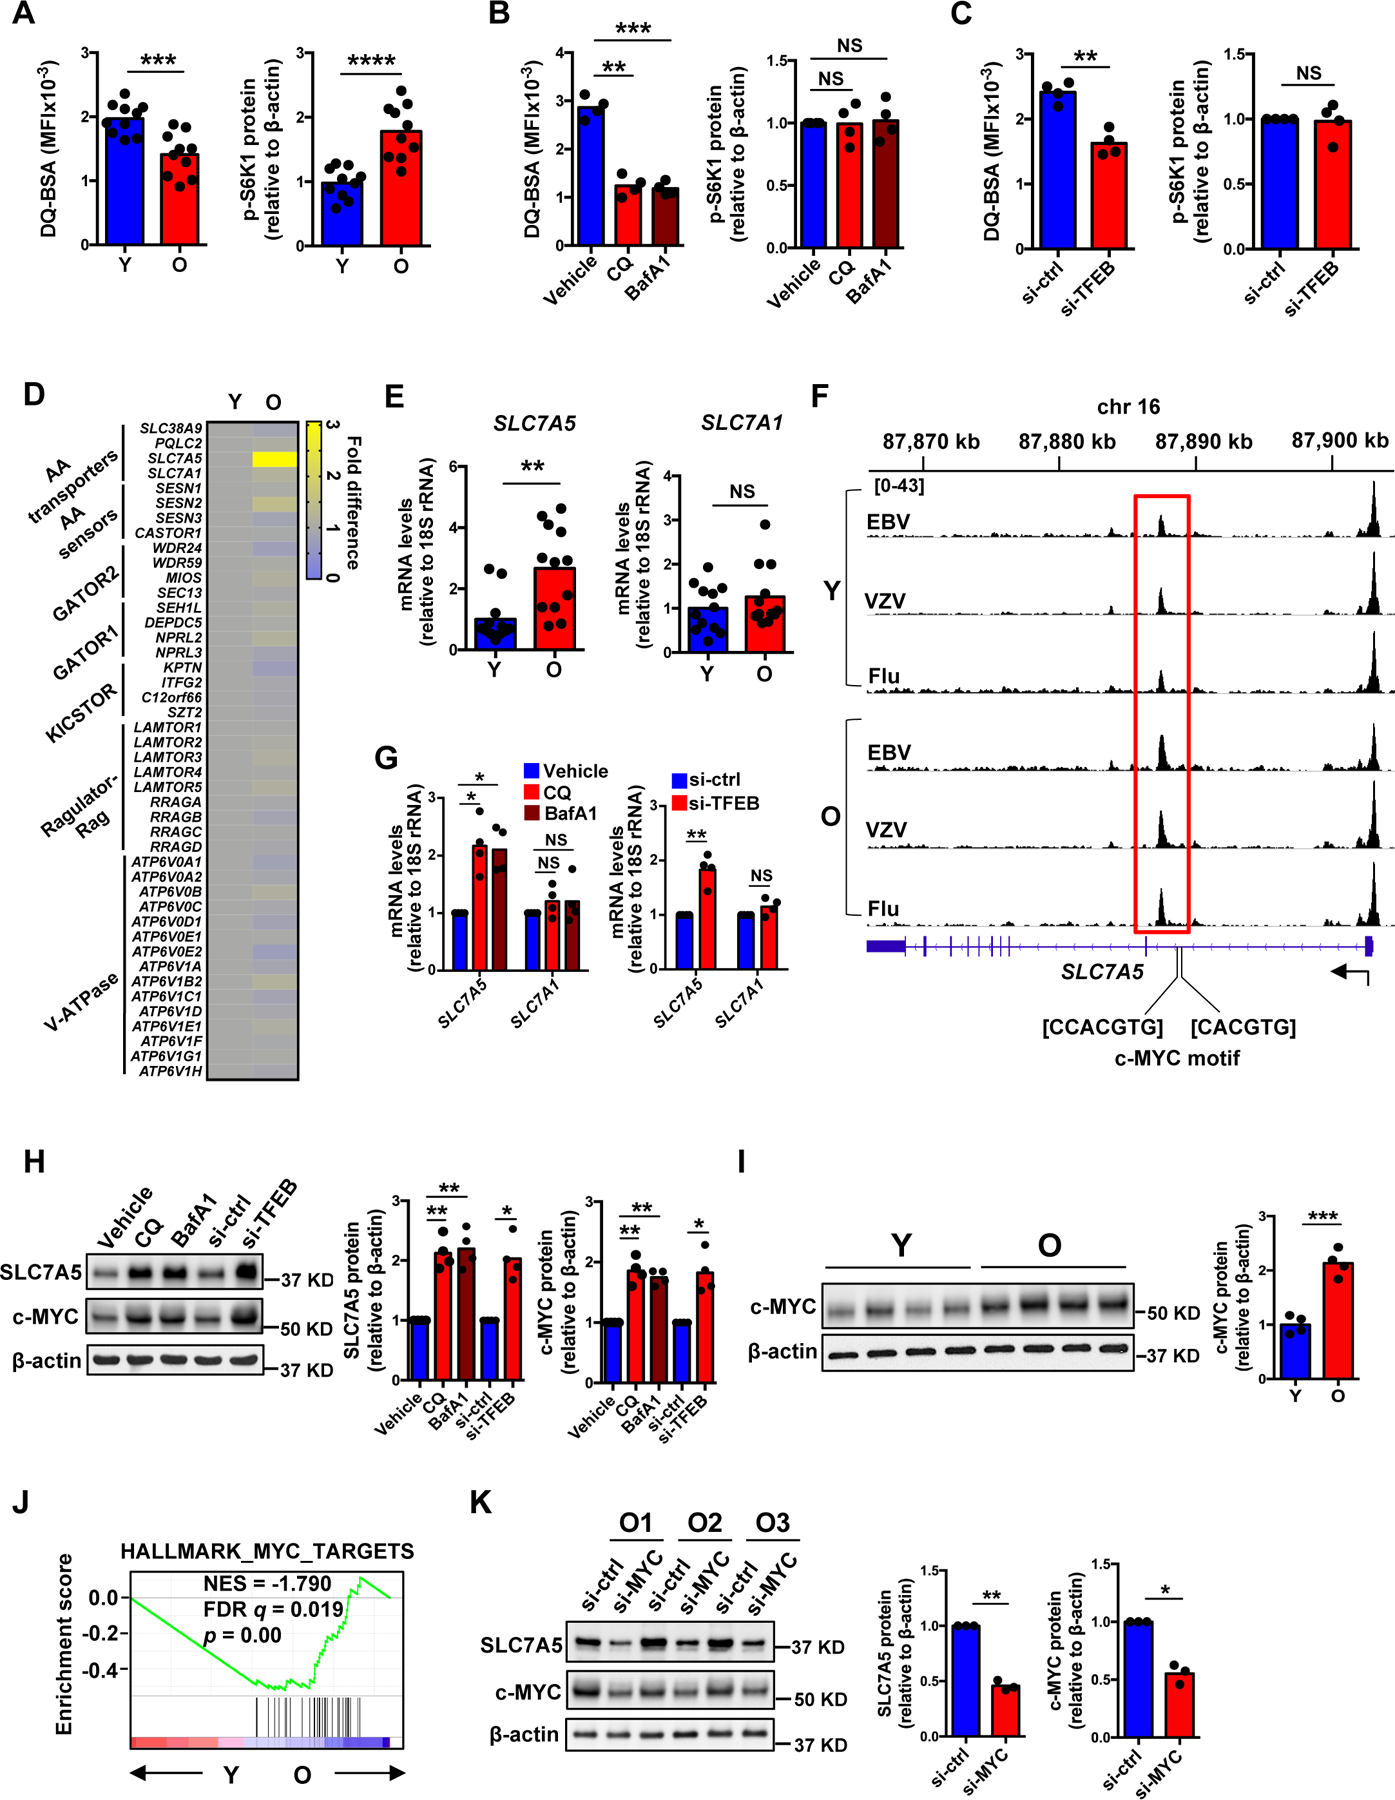
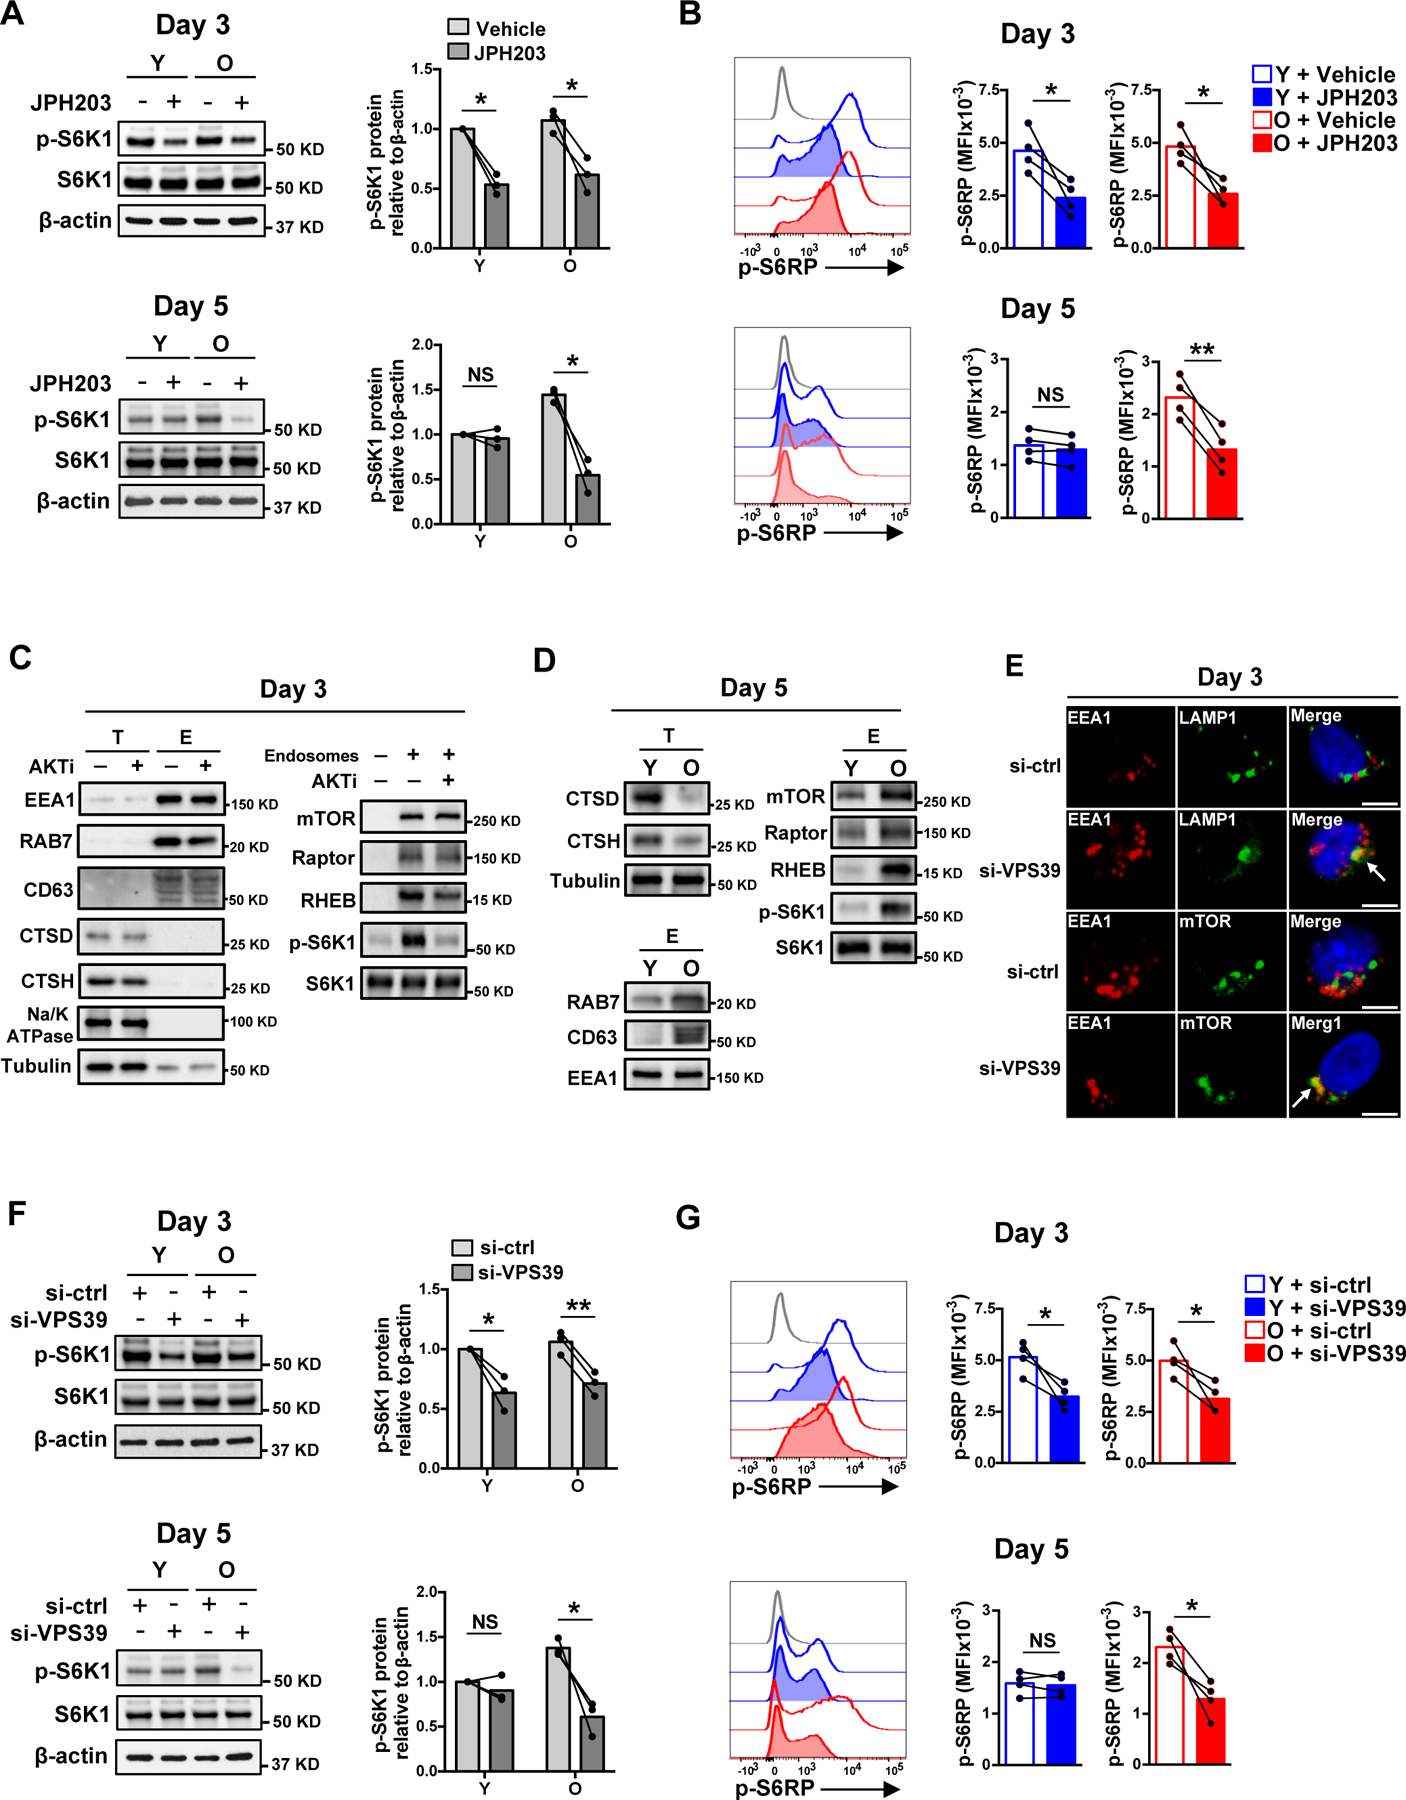
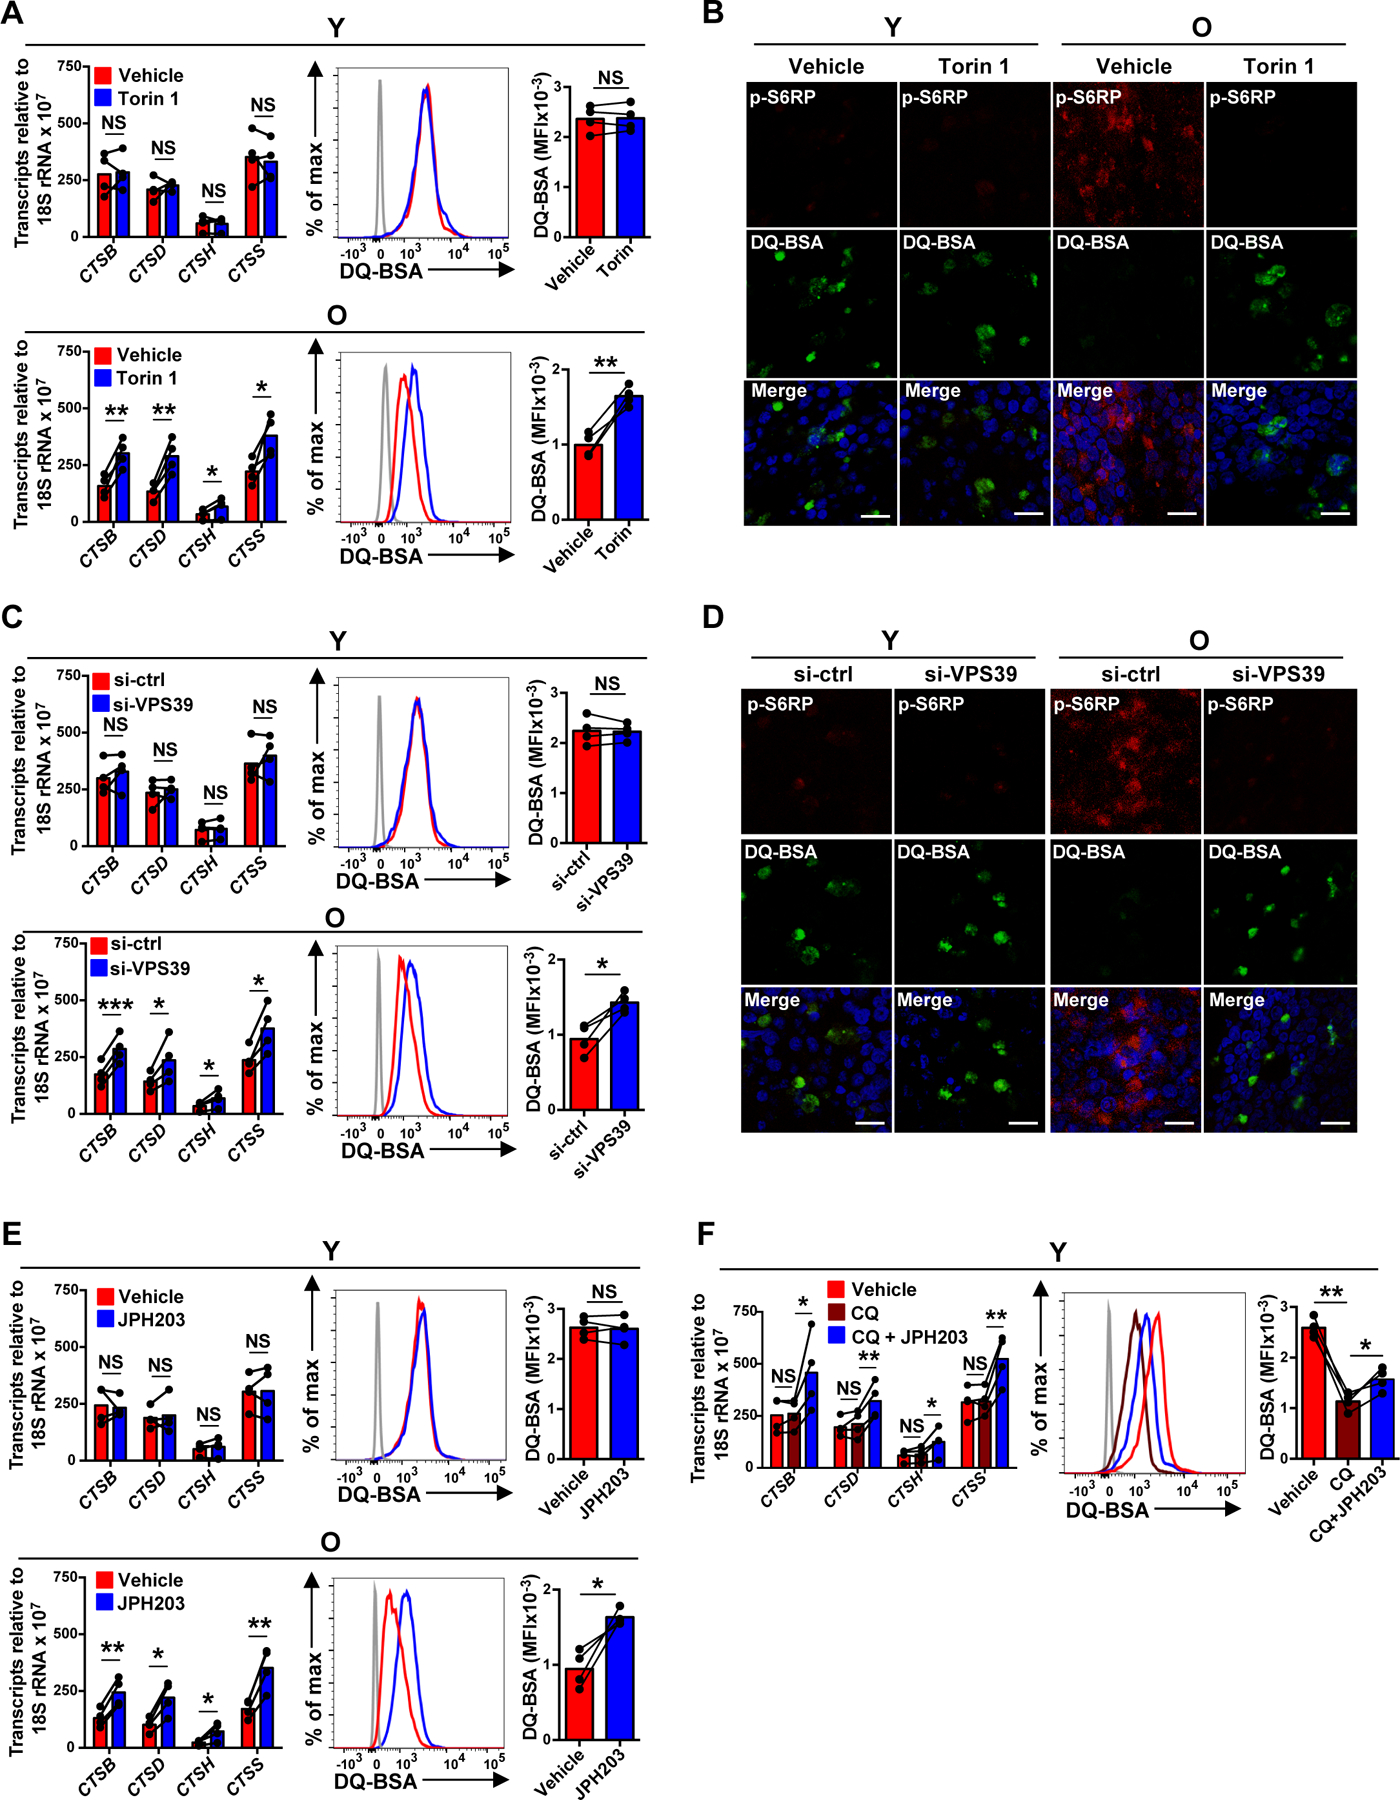
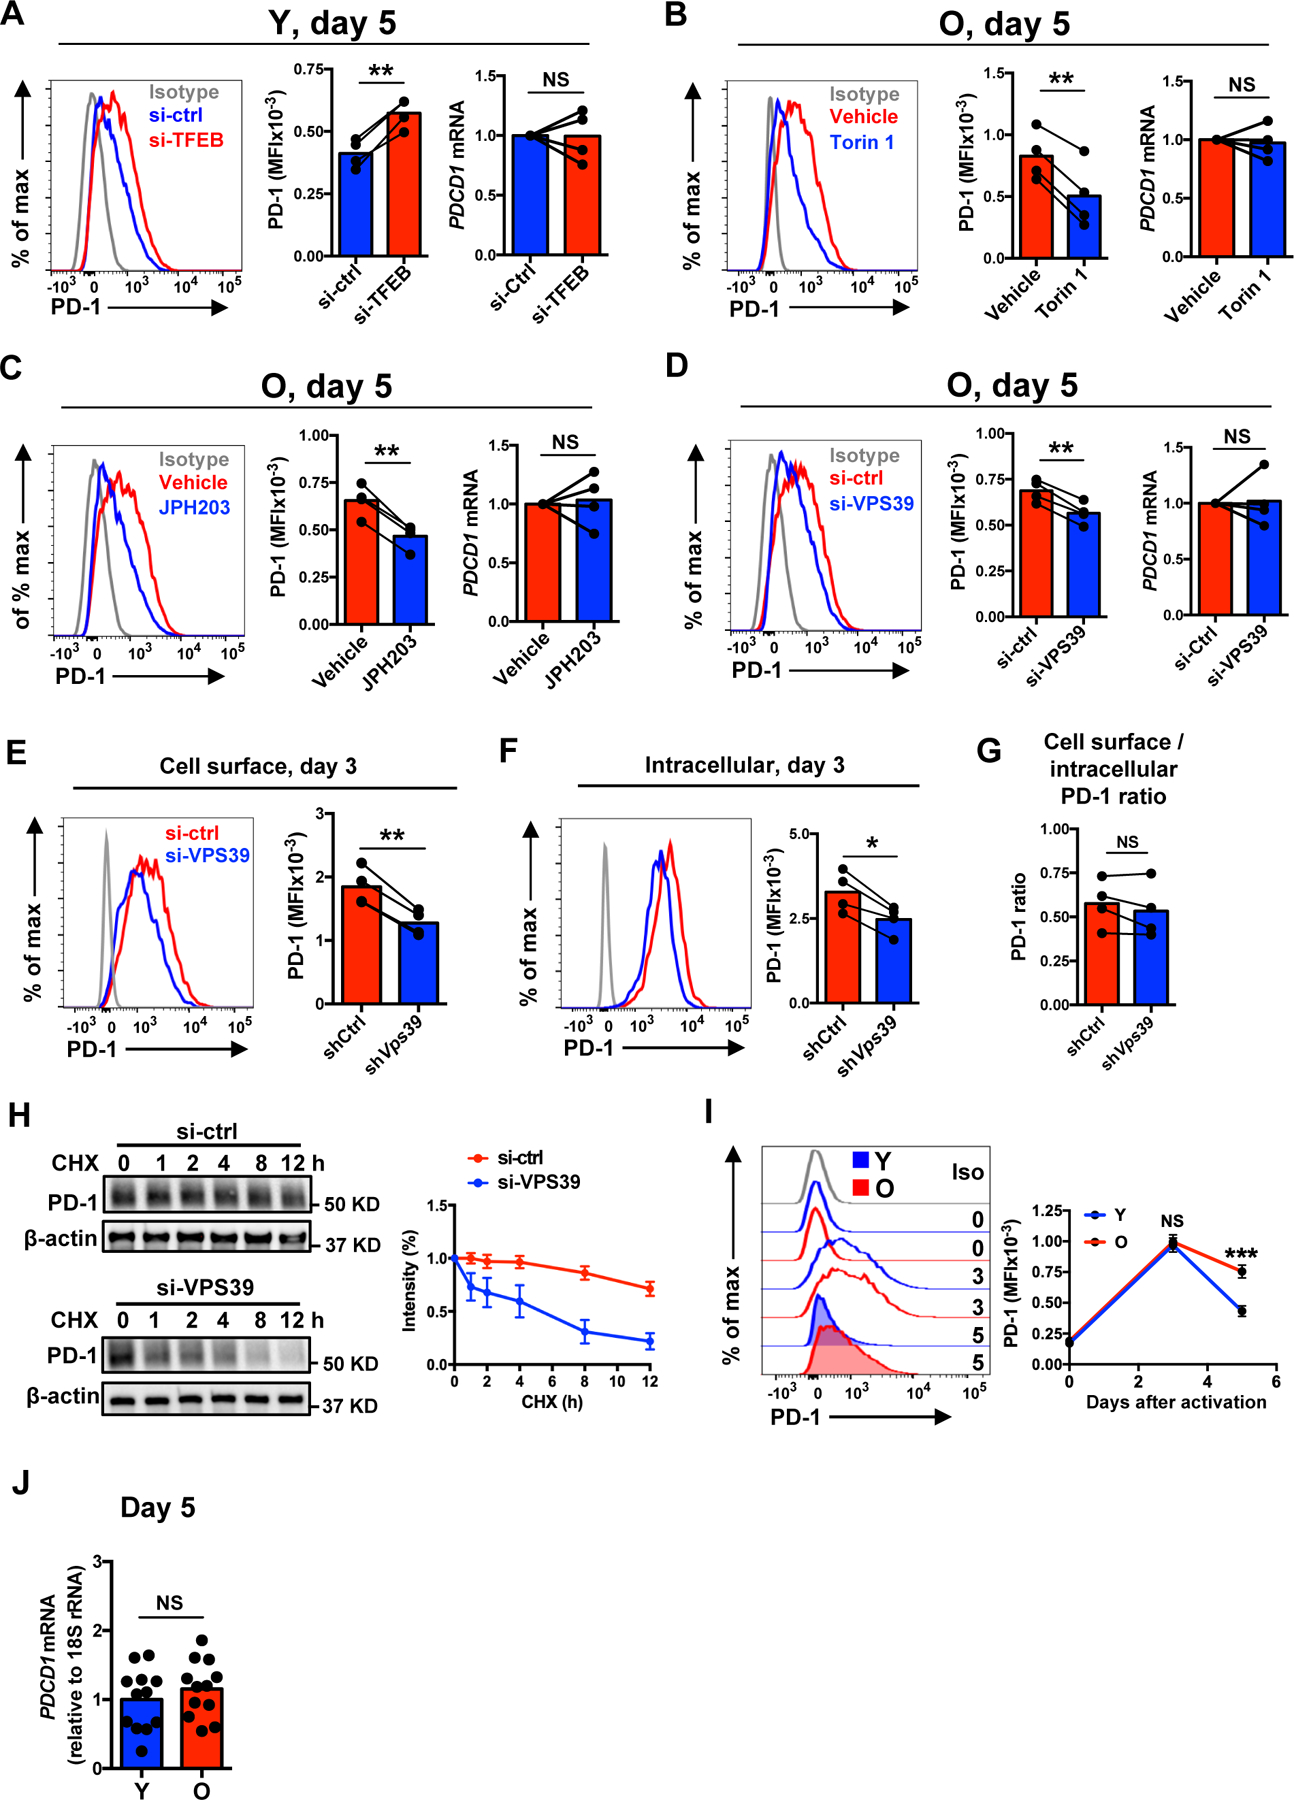
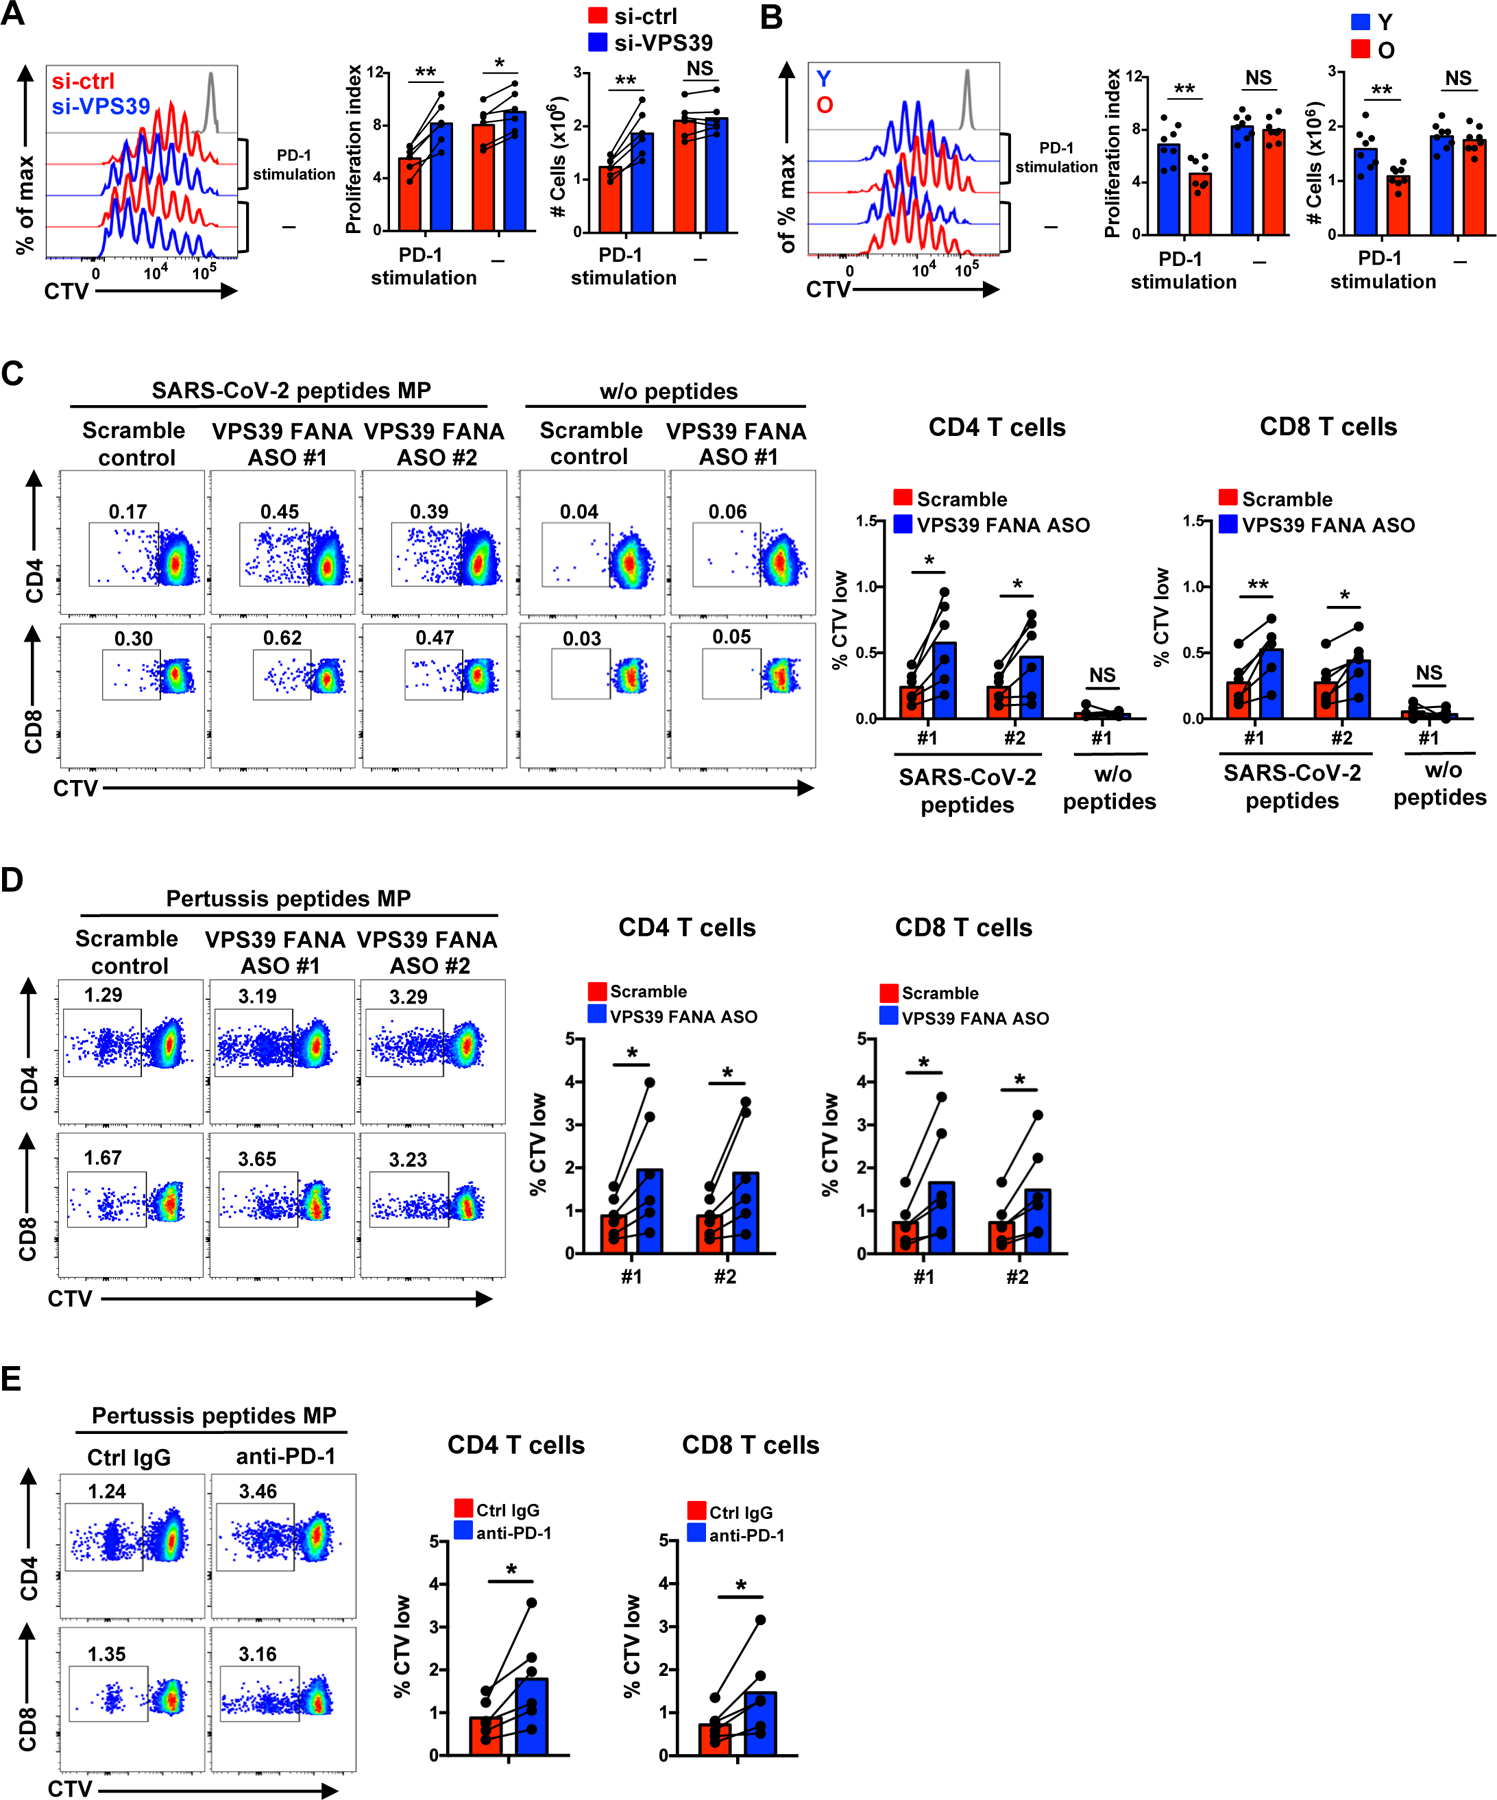
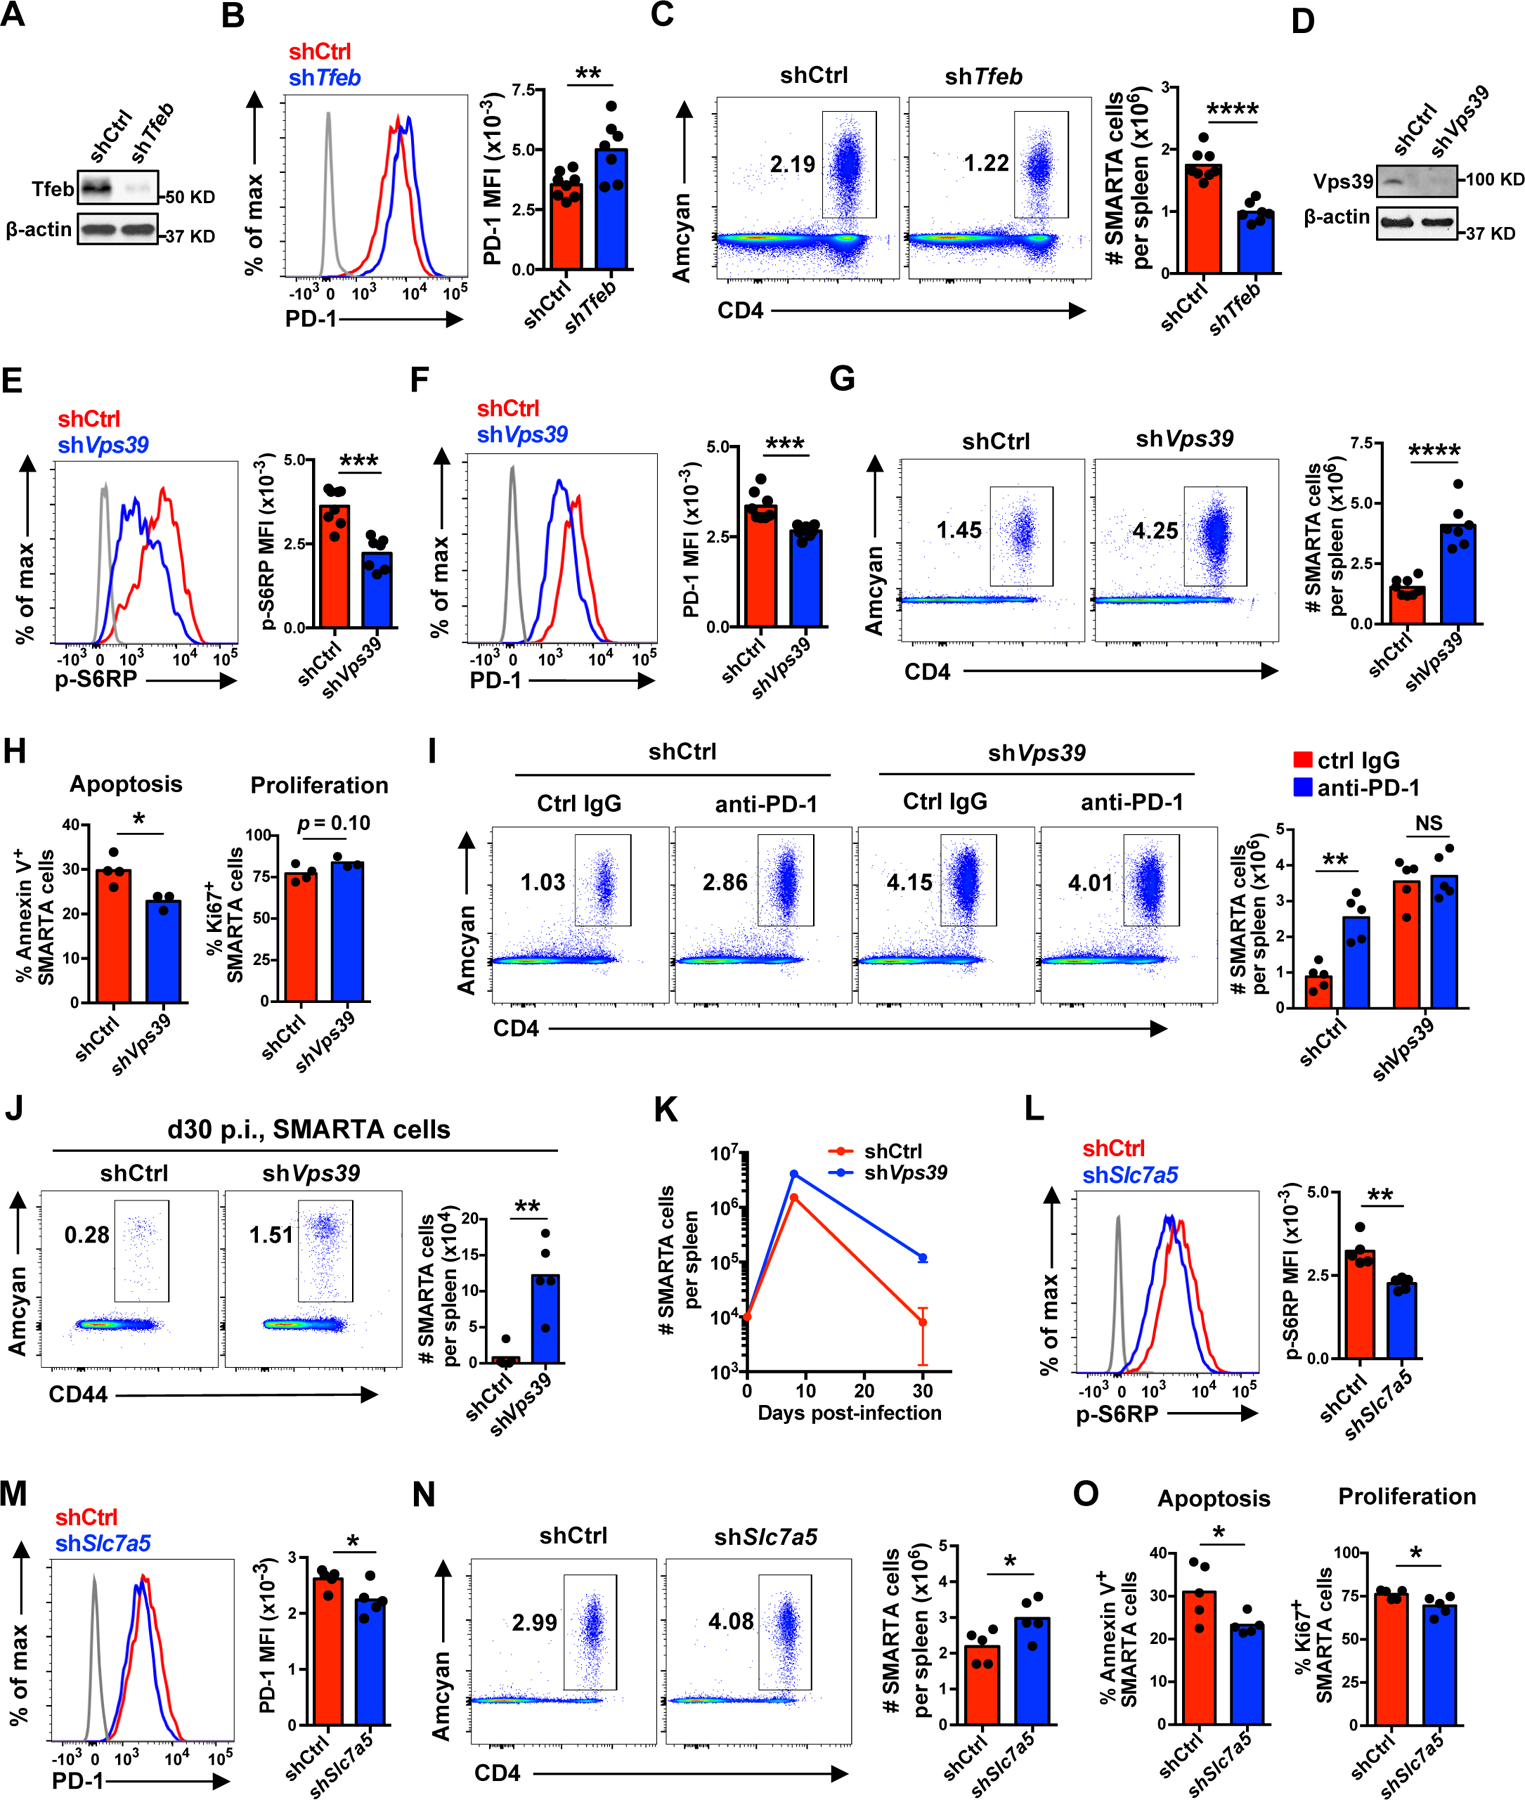
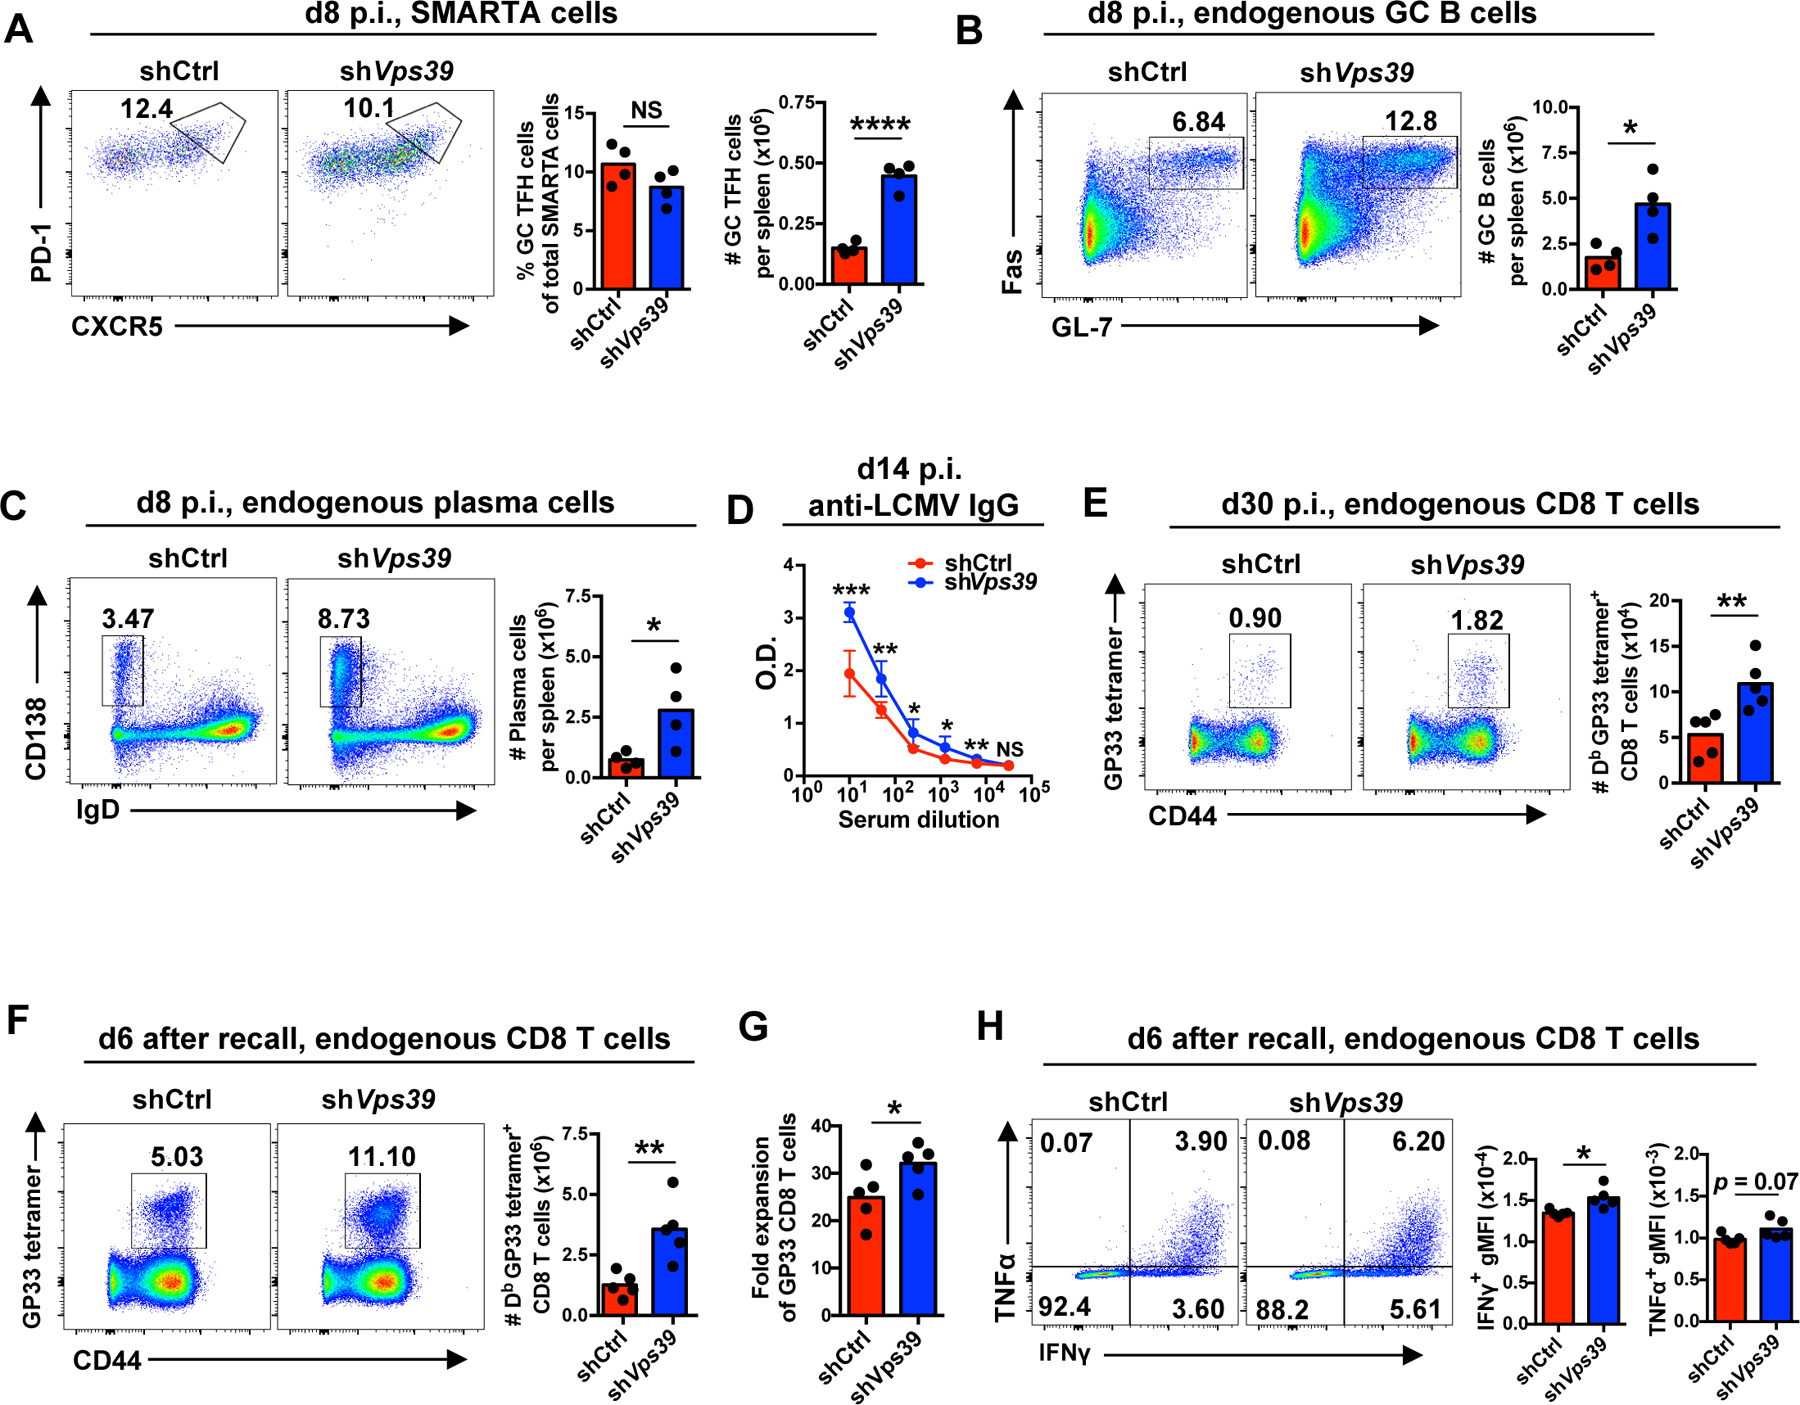
The nutrient-sensing mammalian target of rapamycin (mTOR) is integral to cell fate decisions after T cell activation. Sustained mTORC1 activity favors the generation of terminally differentiated effector T cells instead of follicular helper and memory T cells. This is particularly pertinent for T cell responses of older adults who have sustained mTORC1 activation despite dysfunctional lysosomes. Here, we show that lysosome-deficient T cells rely on late endosomes rather than lysosomes as an mTORC1 activation platform, where mTORC1 is activated by sensing cytosolic amino acids. T cells from older adults have an increased expression of the plasma membrane leucine transporter SLC7A5 to provide a cytosolic amino acid source. Hence, SLC7A5 and VPS39 deficiency (a member of the HOPS complex promoting early to late endosome conversion) substantially reduced mTORC1 activities in T cells from older but not young individuals. Late endosomal mTORC1 is independent of the negative-feedback loop involving mTORC1-induced inactivation of the transcription factor TFEB that controls expression of lysosomal genes. The resulting sustained mTORC1 activation impaired lysosome function and prevented lysosomal degradation of PD-1 in CD4+ T cells from older adults, thereby inhibiting their proliferative responses. VPS39 silencing of human T cells improved their expansion to pertussis and to SARS-CoV-2 peptides in vitro. Furthermore, adoptive transfer of CD4+ Vps39-deficient LCMV-specific SMARTA cells improved germinal center responses, CD8+ memory T cell generation, and recall responses to infection. Thus, curtailing late endosomal mTORC1 activity is a promising strategy to enhance T cell immunity.


Conflict of interest statement

Competing interests: The authors declare that they have no competing interests.

Figures

Fig. 1.
Fig. 1.. Lysosome-independent activation of mTORC1 in naïve CD4+ T cell responses.
(A) Naïve CD4+ T cells were activated with anti-CD3/anti-CD28 beads for 5 days followed by DQ-BSA treatment for 6 hours. Fluorescence of cleaved DQ-BSA was analyzed by flow cytometry to determine lysosomal activities (left). Phospho-S6K1 (Thr389) protein expression was determined by Western blotting (right). Results are from ten young (Y, 20–35 years) and ten older (O, 65–85 years) healthy individuals. Intensities of p-S6K1 protein expression were normalized to β-actin and are shown relative to the mean from young individuals. (B) Naïve CD4+ T cells from young individuals were activated for 5 days with the last 2 days in the presence of vehicle, chloroquine (CQ) or bafilomycin A1 (BafA1). Lysosomal activities (left) and mTORC1 activities (right) were determined as in (A). (C) Naïve CD4+ T cells from young individuals were transfected with control or TFEB siRNA and activated for 5 days. Lysosomal activities (left) and mTORC1 activities (right) were determined. (D) Heat map showing expression differences of genes involved in the amino acid signaling arm of the mTORC1 pathway, comparing the transcriptome of day 5-activated naïve CD4+ T cells from older and young adults (re-analyzed from (36)). (E) SLC7A5 and SLC7A1 transcripts from day 5-activated naïve CD4+ T cells from twelve 20–35 year-old and twelve 65–85 year-old healthy adults. Results are expressed relative to the mean from young individuals. (F) Chromatin accessibility at SLC7A5 gene in human Epstein-Barr (EBV), varicella-zoster (VZV) and influenza (Flu) virus-specific CD4+ T cells from young and older adults. Averaged tracks (young n=3, older n=4) at SLC7A5 show increased peak in highlighted (red) region. (G) SLC7A5 and SLC7A1 transcripts in samples from (B) and (C). (H) SLC7A5 and c-MYC protein expression in samples from (B) and (C). (I) c-MYC protein expression in samples from (A). (J) GSEA comparing fold transcript differences in young compared with older naïve CD4+ T cells on day 5 after stimulation (re-analyzed from (36)) with that of “HALLMARK_MYC_TARGETS”. (K) SLC7A5 and c-MYC protein expression in day 5-stimulated naïve CD4+ T cells from three older individuals transfected with control or MYC siRNA. Statistical significance by two-tailed unpaired t test (A, E and I) or two-tailed paired t-test (B, C, G, H and K). *p < 0.05, **p < 0.01, ***p < 0.001, ****p < 0.0001; NS, not significant.
Fig. 2.
Fig. 2.. SLC7A5-dependent late endosomal mTORC1 activation in naïve CD4+ T cell responses.
(A and B) Naïve CD4+ T cells from young and older healthy individual were activated with anti-CD3/anti-CD28 beads for 3 days in the presence of vehicle or SLC7A5 inhibitor JPH203 (upper panel). Alternatively, cells were activated with anti-CD3/anti-CD28 beads for 5 days with the last 2 days in the presence of vehicle or JPH203 (lower panel). mTORC1 activities were determined either by Western blotting of p-S6K1 (A) or by flow cytometry of intracellular p-S6RP (S235/S236) (B). Data are shown as one representative experiment (left) and cumulative data of three or four experiments (right). (C) Naïve CD4+ T cells were activated for 3 days followed by treatment or not with an AKT inhibitor for 2 hours prior to harvesting. Endosomes were isolated and analyzed for in vitro mTORC1 kinase activity toward S6K1. Total cell lysates (T) and endosome isolates (E) were analyzed by immunoblotting for indicated proteins. Data are shown as one representative of three experiments. (D) In vitro mTORC1 kinase activity of endosome isolates in day 5-stimulated naïve CD4+ T cells from one young and one older individual. Data are shown as one representative of three experiments. (E) Cells were stained with anti-EEA1, anti-LAMP1 and anti-mTOR. Confocal images representative of two independent experiments are shown. Scale bar, 5 μm. (F and G) mTORC1 activities in day 3- and day 5-stimulated naïve CD4+ T cells from young and older individuals after control or VPS39 silencing. The gray histogram represents isotype control. Comparison by two-tailed paired t test (A, B, F and G). *p < 0.05, **p < 0.01; NS, not significant.
Fig. 3.
Fig. 3.. Sustained activation of late endosomal mTORC1 suppresses lysosomal activities in naïve CD4+ T cell responses.
(A–F) Naïve CD4+ T cells from young (Y) and older (O) individuals were activated for 5 days. Indicated inhibitor or vehicle control was added for the last 2 days of culture (A–B and E–F). Alternatively, cells were transfected with control or VPS39 siRNA and then activated with anti-CD3/anti-CD28 beads for 5 days (C–D). (A, C, E and F) Lysosomal cathepsins expressions were determined by qRT-PCR (left); results are normalized to control samples using 18S rRNA as internal control; mean ± SD of four experiments. Lysosomal activities were determined by flow cytometry-based analysis of cells treated with 5 μg/mL of DQ-BSA for 6 hours. Results are shown as representative histograms (middle) and cumulative data from four experiments (right). The gray histogram represents DQ-BSA free samples. (B and D) Cells were treated with DQ-BSA (green) and stained with anti-pS6RP (red). Confocal images representative of two independent experiments show an inverse relationship between mTORC1 and lysosomal activity. Scale bar, 20 μm. Comparison by two-tailed paired t test (A, C, E and F). *p < 0.05, **p < 0.01; NS, not significant.
Fig. 4.
Fig. 4.. Sustained activation of late endosomal mTORC1 prevents PD-1 from lysosomal degradation.
(A–D) Naïve CD4+ T cells from young and older individuals were activated with anti-CD3/anti-CD28 beads for 5 days with the last 2 days in the presence of vehicle or indicated inhibitor (B and C). Alternatively, cells were transfected with control or silencing RNA and activated for 5 days (A and D). Representative histograms showing cell surface protein expression of PD-1 (left) and cumulative data of cell surface protein expression (middle) and gene expression (right) of PD-1. (E–G) Cell surface expression (E), intracellular expression (F) and cell surface/intracellular PD-1 expression ratio (G) after control or VPS39 silencing in day 3-stimulated naïve CD4+ T cells from older individuals. (H) Control or VPS39-silenced, day 5-stimulated naïve CD4+ T cells from older individuals were treated with 5 μg/ml cycloheximide (CHX) to inhibit de novo PD-1 synthesis. Total PD-1 protein normalized to β-actin expression are shown as relative to non-treatment. Mean ± SEM of three experiments. (I) Longitudinal analysis of cell surface protein expression of PD-1 in naïve CD4+ T cells from ten young and ten older individuals. Mean ± SEM. (J) PD-1 gene expression comparison between day 5-stimulated young and older naïve CD4+ T cells. The gray histogram represents isotype control. Comparison by two-tailed paired (A–G) or two-tailed unpaired t test (I and J). *p < 0.05, **p < 0.01, ***p < 0.001; NS, not significant.
Fig. 5.
Fig. 5.. Sustained activation of late endosomal mTORC1 impairs expansion of naïve CD4+ T cells from older adults.
(A) Naïve CD4+ T cells from older individuals labeled with CellTrace Violet (CTV) were transfected with control or VPS39 siRNA and stimulated with anti-CD3/anti-CD28 beads for 5 days in the presence or absence of PD-L1-Fc and anti-human IgG Fc antibody to crosslink PD-1. Representative histograms (left), summary data of proliferation indices (middle) and cell numbers per culture (right). (B) CTV-labeled naïve CD4+ T cells from eight young and eight older individuals were activated by anti-CD3/anti-CD28 beads for 6 days with the last 3 day in the presence or absence of PD-1 crosslinking. Representative histograms (left), summary data of proliferation indices (middle) and cell numbers per culture (right). The gray histogram represents unstimulated cells. (C) CTV-labeled PBMCs from SARS-CoV-2 unexposed healthy individuals were cultured with SARS-CoV-2 peptide megapools for CD4+ and CD8+ T cells for 8 days. VPS39 silencing FANA ASO or scramble control were added to the culture on day 0. Representative flow plots of the frequencies of CTV low CD4+ and CD8+ T cells for indicated conditions and summary data from six individuals. (D and E) Pertussis peptide megapool responses of PBMC from six healthy individuals under the conditions of VPS39 genetic silencing (D) and PD-1 blockade (E). Comparison by two-tailed paired (A and C–E) or two-tailed unpaired t test (B). *p < 0.05, **p < 0.01, ***p < 0.001; NS, not significant.
Fig. 6.
Fig. 6.. Inhibition of late endosomal mTORC1 promotes primary CD4+ T cell responses after LCMV infection in vivo.
(A–C) 1 × 10⁴ Tfeb shRNA or control shRNA retrovirally transduced Amcyan+ LCMV-specific naïve SMARTA TCR transgenic CD4+ T cells were adoptively transferred into CD45.2+ naïve recipients followed by infection with LCMV Armstrong. On day 8 post infection, spleens were harvested and analyzed. FACS plots are gated on CD4+ Amcyan+ SMARTA cells. (A) Tfeb protein expression in transduced cells before adoptive transfer. (B) PD-1 expression on day 8 p.i. (C) SMARTA CD4+ T cell numbers per spleen on day 8 p.i. (D–K) Analysis of T cells responses as described in (A–C) after adoptive transfer of Vps39 shRNA transduced SMARTA CD4+ T cells. (D) Vps39 protein expression in transduced cells before adoptive transfer. (E) Phosphorylation of S6RP on day 8 p.i. (F) PD-1 expression on day 8 p.i. (G) SMARTA CD4+ T cell numbers per spleen on day 8 p.i. (H) Cell apoptosis and proliferation of transferred SMARTA CD4+ T cells on day 8 p.i. (I) Mice infected with LCMV after adoptive transfer of transduced cells were additionally treated with anti-PD-1 antibody (29F.1A12) or control IgG on days 0, 3 and 6 post infection. SMARTA CD4+ T cell numbers were determined on day 8 after LCMV infection. (J) SMARTA CD4+ T cell numbers in the spleen at day 30 after infection. (K) Longitudinal analysis of SMARTA cells in the spleen of LCMV-infected B6 mice. (L–O) 1 × 10⁴ Slc7a5 shRNA or control shRNA retrovirally transduced Amcyan+ LCMV-specific naïve SMARTA CD4+ T cells were adoptively transferred into CD45.2+ naïve recipients as in (A–C). Phosphorylation of S6RP (L), PD-1 expression (M), SMARTA cell numbers per spleen (N), and cell apoptosis and proliferation (O) of transduced SMARTA CD4+ T cells on day 8 post LCMV infection. Data are pooled from two independent experiments with 3–4 mice per group (B–C and E–G), representative of two independent experiments with 3–5 mice per group (A, D and H–K) or one experiment with 5 mice per group (L–O). Statistical significance by two-tailed unpaired t test (B–C, E–H and J–O) or one-way analysis of variance (ANOVA) followed by Tukey’s multiple comparisons test (I). The gray histograms represent naïve cells. *p < 0.05, **p < 0.01, ***p < 0.001, ****p < 0.0001; NS, not significant.
Fig. 7.
Fig. 7.. Inhibition of late endosomal mTORC1 augments CD4+ T cell helper responses in vivo.
1 × 10⁴ Vps39 shRNA or control shRNA retrovirally transduced Amcyan+ naïve SMARTA CD4+ T cells were adoptively transferred into CD45.2+ naïve recipient followed by LCMV infection. On days 8 (A–C) and 30 (E) post infection, spleens were harvested and analyzed. Alternatively, on day 30, immune mice were rechallenged with Lm-gp33 for 6 days (F–H). (A) Number of germinal center (GC) SMARTA TFH cells on day 8 after infection. (B and C) Number of endogenous Fas+ GL-7+ GC B cells (B) and CD138+ IgD plasma cells (C) in host mice on day 8 after infection. Representative contour plots gated on B220+ CD4 B cells (left) and summary data (right). (D) Anti-LCMV nucleoprotein IgG titers in serum on day 14 after infection. n = 5 mice per group. (E) Numbers of Db LCMV GP33–41 (GP33) tetramer+ cells gated on endogenous CD8+ T cells in the spleen of host mice on day 30 after infection. (F) Numbers of endogenous Db LCMV GP33 tetramer+ CD8+ T cells in the spleen on day 6 after Lm-GP33 challenge. (G) Fold expansion of Db GP33 tetramer+ memory CD8+ T cells upon Lm-GP33 on day 6. (H) Cytokine production by CD8+ T cells harvested on day 6 after infection and restimulated with GP33 peptide in vitro. Data are representative of two independent experiments with 4–5 mice per group (A–E) or one experiment with 5 mice per group (F–H). Statistical significance by two-tailed unpaired t test. *p < 0.05, **p < 0.01, ***p < 0.001, ****p < 0.0001; NS, not significant.

References

    1. Nikolich-Zugich J, The twilight of immunity: emerging concepts in aging of the immune system. Nat Immunol 19, 10–19 (2018). - PubMed
    1. Haynes L, Swain SL, Why aging T cells fail: implications for vaccination. Immunity 24, 663–666 (2006). - PMC - PubMed
    1. Thompson WW, Shay DK, Weintraub E, Brammer L, Cox N, Anderson LJ, Fukuda K, Mortality associated with influenza and respiratory syncytial virus in the United States. JAMA 289, 179–186 (2003). - PubMed
    1. Grasselli G, Zangrillo A, Zanella A, Antonelli M, Cabrini L, Castelli A, Cereda D, Coluccello A, Foti G, Fumagalli R, Iotti G, Latronico N, Lorini L, Merler S, Natalini G, Piatti A, Ranieri MV, Scandroglio AM, Storti E, Cecconi M, Pesenti A, Network C-LI, Baseline Characteristics and Outcomes of 1591 Patients Infected With SARS-CoV-2 Admitted to ICUs of the Lombardy Region, Italy. JAMA, (2020). - PMC - PubMed
    1. Zhou F, Yu T, Du R, Fan G, Liu Y, Liu Z, Xiang J, Wang Y, Song B, Gu X, Guan L, Wei Y, Li H, Wu X, Xu J, Tu S, Zhang Y, Chen H, Cao B, Clinical course and risk factors for mortality of adult inpatients with COVID-19 in Wuhan, China: a retrospective cohort study. Lancet 395, 1054–1062 (2020). - PMC - PubMed

Publication types

MeSH terms

Substances