. 2021 Jun 18;12(1):3757.
doi: 10.1038/s41467-021-23954-8.

High-throughput screening and rational design of biofunctionalized surfaces with optimized biocompatibility and antimicrobial activity

Affiliations

High-throughput screening and rational design of biofunctionalized surfaces with optimized biocompatibility and antimicrobial activity

Zhou Fang et al. Nat Commun. .

Abstract

Peptides are widely used for surface modification to develop improved implants, such as cell adhesion RGD peptide and antimicrobial peptide (AMP). However, it is a daunting challenge to identify an optimized condition with the two peptides showing their intended activities and the parameters for reaching such a condition. Herein, we develop a high-throughput strategy, preparing titanium (Ti) surfaces with a gradient in peptide density by click reaction as a platform, to screen the positions with desired functions. Such positions are corresponding to optimized molecular parameters (peptide densities/ratios) and associated preparation parameters (reaction times/reactant concentrations). These parameters are then extracted to prepare nongradient mono- and dual-peptide functionalized Ti surfaces with desired biocompatibility or/and antimicrobial activity in vitro and in vivo. We also demonstrate this strategy could be extended to other materials. Here, we show that the high-throughput versatile strategy holds great promise for rational design and preparation of functional biomaterial surfaces.


Conflict of interest statement

L.W., Z.F., J.C., G.H., and H.X. have applied for patents related to this study. The remaining authors declare no competing interests.

Figures

Fig. 1
Fig. 1. Schematic illustration of a platform for high-throughput screening and rational design of the biofunctionalized surfaces with optimized biocompatibility and antimicrobial activity.
a Ti substrates were treated with sodium hydroxide to realize hydroxylation. b Hydroxylated Ti substrates were reacted with silane-PEG2000-MAL solution to introduce alkene bonds. c By the thiol–ene click chemistry, utilizing a combination of “evaporation” and “immersion” techniques to construct AMP and RGD dual-functionalized gradient surfaces. d Studying the biological properties of mBMSCs and S. aureus on the AMP and RGD dual-functionalized gradient surfaces, to identify the best region which can promote both cell adhesion and bacteria killing and thus to obtain the best parameters for producing the optimized AMP and RGD dual-functionalized surfaces. e The optimized AMP and RGD dual-functionalized surfaces were designed by the extracted parameters to achieve excellent in vitro and in vivo biocompatibility and antimicrobial activity for successful BAI inhibition and bone defect repair.
Fig. 2
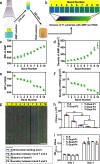
Fig. 2. The preparation and gradient properties of Ti surfaces with gradient RGD density along the vertical direction.
a Schematic diagram depicting the preparation of the RGD-functionalized gradient Ti surface. A Ti substrate, chemically modified with silane-PEG2000-MAL, was first vertically oriented in an empty well of a plate. Then, an FITC-labeled thiolated RGD solution with a concentration of m (m = 0.1, 0.5, or 1 μM) was added to the well at a rate of 0.5 mL/h, leading to the increase of liquid level in the well. RGD was conjugated to the freshly immersed section of the Ti substrate by a click reaction between double bonds in MAL and thiol groups in RGD. After 240 min, the Ti substrate was pulled out of the well and washed with ethanol. Consequently, a lower section of the Ti substrate would have been exposed to the RGD solution for a longer time and thus be modified with more RGD, making RGD density increasing vertically downward and generating a vertical gradient in the RGD density. The resultant gradient surface was denoted as Ti-Grad-mRGD, in which m represents the concentration of the RGD solution. For convenience, the surface was artificially divided into ten bands, numbered 1–10 from top to bottom, with a band width of 1 mm. Thus, it is expected that the RGD density is increasing from band 1 to 10. b The FITC fluorescence images of Ti-Grad-0.5RGD. The images of the ten bands were collected individually and lined up as they were originally on the Ti substrate (n = 3, scale bar, 200 μm). c The mean fluorescence intensity (MFI) and d the RGD density (calculated by the fluorescence method) of each band of Ti-Grad-0.5RGD. In each band, we randomly selected three points to calculate the MFI (n = 3). e Peak area of N1s high-resolution spectra of each band on Ti-Grad-0.5RGD, confirming the increase in the RGD density from band 1 to 10 (n = 4). Data are displayed as mean ± SD and analyzed by GraphPad Prism software.
Fig. 3
Fig. 3. Correlation between the mBMSCs density and the band-dependent RGD density on the gradient Ti surfaces and the use of information from such correlation to prepare nongradient surfaces for optimized mBMSCs adhesion.
a Distribution (n = 3) and b average number (n = 3 within a band) of fluorescently stained mBMSCs on different bands of Ti-Grad-0.5RGD after 24 h of culturing, showing an increase in the band number (and thus an increase in RGD density) resulted in an increase in the cell density. After being stained with F-actin and DAPI, the cells were observed by fluorescence microscope under the FITC and DAPI channels (scale bar, 400 μm). It should be noted that 9 images were obtained along the gradient direction of one sample and combined to form the image in a, and the dotted lines in a highlight the band boundaries (but not the dividing lines of the 9 images). The actual dividing boundaries of the 9 images are marked as solid black lines at the bottom of the image in a. c FITC fluorescence images of nongradient Ti surface prepared from the incubation time (in FITC-labeled RGD solution) used to generate bands 9 and 10, producing Ti-RGD-P1 and Ti-RGD-P2, respectively. A third surface, Ti-RGD-P3, was produced by increasing the RGD concentration to 1 μM for Ti-RGD-P2. For each sample, five images were chosen randomly to calculate the MFI (n = 5, scale bar, 500 μm). d CCK-8 results for the indicated uniform Ti surface with mBMSCs after 1 and 3 days of culturing (n = 3). (Sidak’s multiple comparisons test, two-way ANOVA. Ti–S vs Ti-RGD-P1, *p = 0.0119; Ti–S vs Ti-RGD-P2, *p = 0.0118.) Ti–S was the Ti surface modified with silane-PEG2000-MAL. Data are displayed as mean ± SD and analyzed by GraphPad Prism software.
Fig. 4
Fig. 4. The preparation and gradient properties of the Ti surface with a gradient in AMP density along the vertical direction.
a Schematic diagram depicting the preparation of the AMP-functionalized gradient Ti surface. A Ti substrate, chemically modified with silane-PEG2000-MAL, was first vertically oriented in an FITC-labeled thiolated AMP solution with a concentration of m (m = 1, 20, or 50 μM). Then, the solution phase was allowed to evaporate in a fume hood for 210 min. AMP was conjugated to the immersed section of the Ti substrate by a click reaction between double bonds in MAL and thiol groups in thiolated AMP. During the evaporation, the solution level was reduced to increase the concentration of the solution phase. As a result, a lower section of the Ti substrate would have been exposed to the AMP solution with a higher concentration and for a longer time and thus be modified with more AMP, making AMP density increasing vertically downward and generating a vertical gradient in the AMP density. The resultant gradient surface was denoted as Ti-Grad-mAMP, in which m represents the concentration of the AMP solution. For convenience, the surface was artificially divided into ten bands, numbered 1–10 from top to bottom, with a band width of 1 mm. Thus, it is expected that the AMP density is increasing from band 1 to 10. b The FITC fluorescence images of Ti-Grad-20AMP. The images of the ten bands were collected individually and lined up as they were originally on the Ti substrate (n = 3, scale bar, 200 μm). c The MFI and d the AMP density (calculated by the fluorescence method) of each band of Ti-Grad-20AMP. In each band, we randomly selected three points to calculate the MFI (n = 3). e Peak area of N1s high-resolution spectra of each band on Ti-Grad-20AMP, confirming the increase in the AMP density from band 1 to 10 (n = 4). Data are displayed as mean ± SD and analyzed by GraphPad Prism software.
Fig. 5
Fig. 5. Correlation between the number of live bacteria (S. aureus) and the band-dependent AMP density on the gradient Ti surfaces and the use of information from such correlation to prepare nongradient surfaces for optimized bacteria killing.
a Distribution of live bacteria (red dots, detected by Petrifilm method) on different bands of Ti-Grad-20AMP after 24 h of culturing, showing that higher band number area (bands 7–10, with higher AMP densities) did not have any live bacteria, whereas lower band number area (bands 1–6, with lower AMP densities) presented live bacteria. Three lines were denoted, including P1, P2, and P3, corresponding to the boundary between the area without and with dead bacteria, starting boundary of band 7, and midpoint position within band 7, respectively (n = 3, scale bar, 1.5 mm). b FITC fluorescence images of the nongradient Ti surface prepared using the conditions (immersion time and AMP concentration during immersion) corresponding to P1, P2, and P3 in a, producing Ti-AMP-P1, Ti-AMP-P2, and Ti-AMP-P3, respectively. For each sample, five images were chosen randomly to calculate the MFI (n = 5, scale bar, 500 μm). c Bacterial viability of Ti–S, AMP-P1, Ti-AMP-P2, and Ti-AMP-P3 (n = 3) (Sidak’s multiple comparisons test, two-way ANOVA. Ti–S vs Ti-AMP-P1, **p < 0.0001; Ti–S vs Ti-AMP-P2, **p < 0.0001; Ti–S vs Ti-AMP-P3, **p < 0.0001). d CCK-8 results for the indicated uniform Ti surface with mBMSCs after 1 and 3 days of culturing (n = 3). Ti–S was the Ti surface modified with silane-PEG2000-MAL. Data are displayed as mean ± SD and analyzed by GraphPad Prism software.
Fig. 6
Fig. 6. The characterization of the dual-functionalized gradient/uniform Ti surfaces.
a Schematic diagram depicting the preparation of the dual-functionalized gradient Ti surface (Ti-Grad-Dual), in which Ti-Grad-50AMP was first prepared and then incubated into RGD solution (0.5 μM) for 240 min. The gradient in the AMP density on Ti-Grad-50AMP would cause a gradient in the density of unconjugated MAL on this substrate. Thus, incubation of Ti-Grad-50AMP in Mca-labeled RGD would give rise to a gradient in the RGD density. A higher AMP density band with a lower density of unconjugated MAL would be corresponding to a lower RGD density. The surface was divided into ten bands with a band width of 1 mm. Band 1 had the lowest density of AMP but highest density of RGD, and band 10 exhibited the opposite trend. b Fluorescence images of AMP–FITC and RGD–Mca on Ti-Grad-Dual, which were obtained by fluorescence microscope under the FITC and DAPI channel (n = 3, scale bar, 200 μm). c The MFI of Ti-Grad-50AMP with AMP–FITC and d the densities of AMP calculated by the fluorescence method. e MFI of Ti-Grad-Dual with RGD–FITC and f the densities of RGD calculated by the fluorescence method. In each band, we randomly selected three points to calculate the MFI in c and e (n = 3). g Distribution of S. aureus on Ti-Grad-Dual detected by the Petrifilm method (n = 3, scale bar, 1.5 mm). Four lines are denoted, including P1, P2, P3, and P4, corresponding to the boundary between the area without and with dead bacteria, boundary between bands 7 and 8, and midpoint position within band 8, and boundary between bands 8 and 9, respectively. h Antimicrobial assay of the indicated uniform Ti surfaces against S. aureus by an agar plate method (n = 3) (Sidak’s multiple comparisons test, two-way ANOVA. Ti–S vs Ti-Dual-P1, **p = 0.0001, Ti–S vs Ti-Dual-P2, **p < 0.0001; Ti–S vs Ti-Dual-P3, **p < 0.0001; Ti–S vs Ti-Dual-P4, **p < 0.0001; Ti-Dual-P1 vs Ti-Dual-P2, **p = 0.0003; Ti-Dual-P1 vs Ti-Dual-P3, **p < 0.0001; Ti-Dual-P1 vs Ti-Dual-P4, **p < 0.0001; Ti-Dual-P2 vs Ti-Dual-P4, **p = 0.0018; Ti-Dual-P3 vs Ti-Dual-P4, **p = 0.0036). i CCK-8 results for the indicated uniform Ti surfaces with mBMSCs after 1 and 3 days of culturing (n = 3). Nongradient Ti surfaces generated from the conditions (immersion time and concentration) corresponding to P1, P2, P3, and P4 in g, were termed Ti-Dual-P1, Ti-Dual-P2, Ti-Dual-P3, and Ti-Dual-P4, respectively, in h and i. Data are displayed as mean ± SD and analyzed by GraphPad Prism software.
Fig. 7
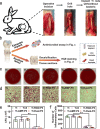
Fig. 7. In vivo assay of antimicrobial activity of the implants modified by peptides.
a Schematic diagram and processes of the surgery. b Schematic of antimicrobial assay and H&E staining to evaluate the antimicrobial ability of the implants. For the antimicrobial assay, the implants were extracted from femur, cultured and characterized on blood agar plates. For H&E staining, the residual tissues of femur without implants were made into tissue section for pathological examination. c The images of the blood agar plates in the indicated groups (n = 3). d The H&E staining images of the bone tissues after implant were taken out. The inflammatory cells and cytoplasm were pointed out by the black and red arrows, respectively (n = 4, scale bar, 200 μm). e Antimicrobial activities of the implants against S. aureus by the agar plate method. Three implants were collected for each group (n = 3). (Sidak’s multiple comparisons test, two-way ANOVA. Ti vs Ti-AMP-P3, **p = 0.0014; Ti vs Ti-Dual-P4, **p = 0.0014; Ti–S vs Ti-AMP-P3, **p = 0.0010; Ti–S vs Ti-Dual-P4, **p = 0.0010; Ti-RGD-P3 vs Ti-AMP-P3, **p = 0.0001; Ti-RGD-P3 vs Ti-Dual-P4, **p = 0.0001.) f The number of inflammatory cells determined from the H&E staining images. Four images were collected for each group (n = 4). (Sidak’s multiple comparisons test, two-way ANOVA. Ti vs Ti-AMP-P3, **p < 0.0001; Ti vs Ti-Dual-P4, **p < 0.0001; Ti–S vs Ti-AMP-P3, **p < 0.0001; Ti–S vs Ti-Dual-P4, **p < 0.0001; Ti-RGD-P3 vs Ti-AMP-P3, **p < 0.0001; Ti-RGD-P3 vs Ti-Dual-P4, **p < 0.0001.) Data are displayed as mean ± SD and analyzed by GraphPad Prism software.
Fig. 8
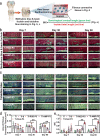
Fig. 8. In vivo osteogenesis assay in the infection model.
a Schematic for preparing hard tissue sections and assessing the osseointegration of implants in vivo. After the hard tissue sections were prepared from the femur with implants, they were stained with methylene blue and basic fuchsin and toluidine blue. The area of fibrous connective tissue at the interface between bone tissue and implant was quantitatively analyzed using Image J software. The bone–implant contact length and implant total length were measured by software in the microscope to calculate the bone–implant contact (BIC). b The methylene blue and basic fuchsin (n = 5) and c toluidine blue staining (n = 3) images of the hard tissue section of implantation. The interface between the implant and tissue in the green rectangle was enlarged (the scale bars before and after enlargement (×10 and ×20 magnification) were 200 and 100 μm, respectively). Quantitative analysis of methylene blue and basic fuchsin staining: d area of fibrous connective tissue and e BIC at the interface between bone tissue and implant. Five sections in each group were chosen for the analysis (n = 5). (Sidak’s multiple comparisons test, two-way ANOVA. In d-day 30: Ti vs Ti-Dual-P4, **p < 0.0001; Ti–S vs Ti-Dual-P4, **p < 0.0001; Ti-RGD-P3 vs Ti-Dual-P4, **p = 0.0006; Ti-AMP-P3 vs Ti-Dual-P4, **p = 0.0008. In d-day 60: Ti vs Ti-Dual-P4, **p = 0.0002; Ti–S vs Ti-Dual-P4, **p < 0.0001; Ti-RGD-P3 vs Ti-Dual-P4, **p < 0.0001; Ti-AMP-P3 vs Ti-Dual-P4, **p = 0.0003. In e-day 30: Ti vs Ti-Dual-P4, **p < 0.0001; Ti–S vs Ti-Dual-P4, **p < 0.0001; Ti-RGD-P3 vs Ti-Dual-P4, **p < 0.0001; Ti-AMP-P3 vs Ti-Dual-P4, **p < 0.0001. In e-day 60: Ti vs Ti-Dual-P4, **p < 0.0001; Ti–S vs Ti-Dual-P4, **p < 0.0001; Ti-RGD-P3 vs Ti-Dual-P4, **p < 0.0001; Ti-AMP-P3 vs Ti-Dual-P4, **p < 0.0001.) Data are displayed as mean ± SD and analyzed by GraphPad Prism software.

Similar articles

Cited by

References

    1. Hasan J, Crawford RJ, Ivanova EP. Antibacterial surfaces: the quest for a new generation of biomaterials. Trends Biotechnol. 2013;31:295–304. doi: 10.1016/j.tibtech.2013.01.017. - DOI - PubMed
    1. Shin H, Jo S, Mikos AG. Biomimetic materials for tissue engineering. Biomaterials. 2003;24:4353–4364. doi: 10.1016/S0142-9612(03)00339-9. - DOI - PubMed
    1. Goddard JM, Hotchkiss JH. Polymer surface modification for the attachment of bioactive compounds. Prog. Polym. Sci. 2007;32:698–725. doi: 10.1016/j.progpolymsci.2007.04.002. - DOI
    1. Hung H-C, et al. A coating-free nonfouling polymeric elastomer. Adv. Mater. 2017;29:1700617. doi: 10.1002/adma.201700617. - DOI - PubMed
    1. Bauer S, Schmuki P, von der Mark K, Park J. Engineering biocompatible implant surfaces: part I: materials and surfaces. Prog. Mater. Sci. 2013;58:261–326. doi: 10.1016/j.pmatsci.2012.09.001. - DOI

Publication types

LinkOut - more resources