. 2021 Jun 18;12(1):3785.
doi: 10.1038/s41467-021-24043-6.

Multi-omics profiling of primary small cell carcinoma of the esophagus reveals RB1 disruption and additional molecular subtypes

Affiliations

Multi-omics profiling of primary small cell carcinoma of the esophagus reveals RB1 disruption and additional molecular subtypes

Renda Li et al. Nat Commun. .

Abstract

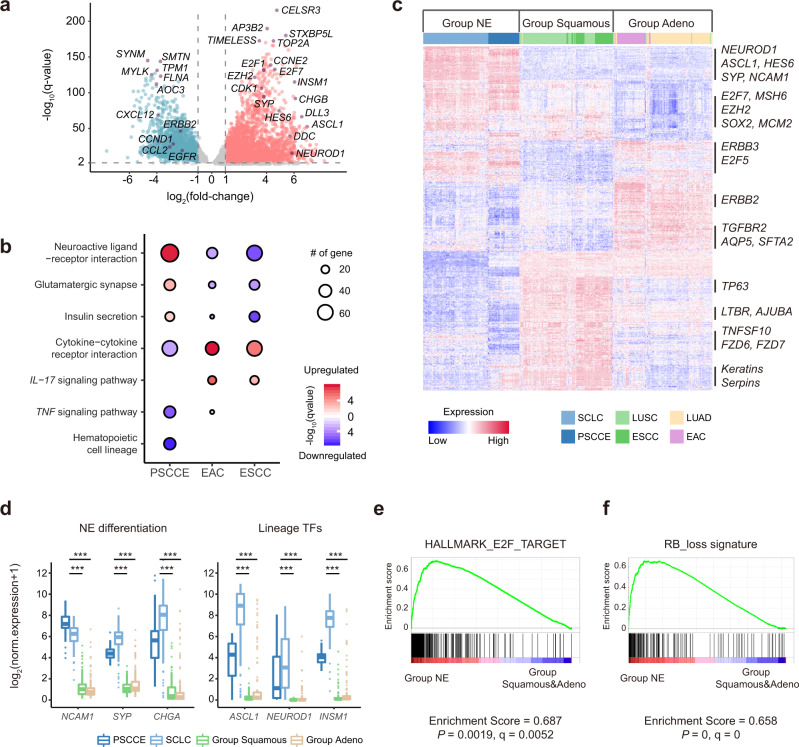
Primary small cell carcinoma of the esophagus (PSCCE) is a lethal neuroendocrine carcinoma. Previous studies proposed a genetic similarity between PSCCE and esophageal squamous cell carcinoma (ESCC) but provided little evidence for differences in clinical course and neuroendocrine differentiation. We perform whole-exome sequencing, RNA sequencing and immunohistochemistry profiling on 46 PSCCE cases. Integrated analyses enable the discovery of multiple mechanisms of RB1 disruption in 98% (45/46) of cases. The transcriptomic landscape of PSCCE closely resembles small cell lung cancer (SCLC) but differs from ESCC or esophageal adenocarcinoma (EAC). Distinct gene expression patterns regulated by ASCL1 and NEUROD1 define two molecular subtypes, PSCCE-A and PSCCE-N, which are highly similar to SCLC subtypes. A T cell excluded phenotype is widely observed in PSCCE. In conclusion, PSCCE has genomic alterations, transcriptome features and molecular subtyping highly similar to SCLC but distinct from ESCC or EAC. These observations are relevant to oncogenesis mechanisms and therapeutic vulnerability.


Conflict of interest statement

The authors declare no competing interests.

Figures

Fig. 1
Fig. 1. Genomic alterations detected by WES in PSCCE.
a Mutational spectrum of PSCCE. Substitutions are plotted in different colors with their context arranged in the denoted order. b Five mutational signatures, denoted as E1–E5, were identified in the integrated analysis of PSCCE, ESCC, EAC, and SCLC. COSMIC signatures showing high similarity, its etiology and cosine similarity score are shown. c The proportions of signature E1–E5 in each sample of PSCCE, ESCC, EAC, and SCLC tumors. The predominant signature in each cancer is shown. d Recurrent somatic copy-number variations in PSCCE. Amplifications and deletions are plotted in red and blue, respectively. e Landscape of somatic alterations in PSCCE. Somatic alterations of each gene (row) in each tumor (column) are plotted as a heatmap according to the color legend below. Samples are arranged by the number of mutations (top panel). Clinical parameters of each patient are shown below. Alteration frequencies are shown in the right panel. The proportion of single-nucleotide substitutions in each sample is shown in the bottom panel.
Fig. 2
Fig. 2. RB1 disruption by multiple mechanisms.
a Schematic summary of RB1 disruption events observed in each sample (column) by different methods (row). The rightmost sample is PSCCE_33T, the only tumor positive for Rb, yet not evaluated by RNA-seq. b (From top to bottom) Schematic plot of exon deletions, Sanger sequencing validation of exon deletion breakpoints, sashimi plot of subsequent splicing abnormalities in RB1 mRNA and Rb IHC of three representative tumors. Schematic summary of disrupting mechanism is shown on the right. Black rectangles represent RB1 exons and gray dashed line represent deleted genomic regions. Green, red, blue, and black peaks in Sanger sequencing chromatograms represent bases A, T, C, and G, respectively. Genomic coordinates are in hg19 assembly. Curves in sashimi plot represent reads spanning exon junction with numbers of reads denoted. Abnormal exon junctions are plotted in red. Rb IHC of matched normal sample is provided as control. Scale bar: 50 μm. c Schematic plot and Sanger sequencing validation of exon deletions (left), sashimi plot and validation of abnormal mRNA exon junctions (middle) and Rb IHC staining (right) of PSCCE_10T. Two alleles of RB1 are plotted separately to show different ranges of exon deletions. Exons of ITM2B are plotted in green. Sanger sequencing chromatograms and sashimi plots are plotted in the same way described above. Scale bar: 50 μm.
Fig. 3
Fig. 3. The transcriptome landscape of PSCCE.
a Volcano plot of differentially regulated genes (DEGs). Up- and downregulated DEGs are plotted in red and cyan, respectively. Key genes are plotted in purple with symbols annotated. Source data are provided as a Source Data file. b Pathways that were largely discordant between PSCCE, EAC, and ESCC. c Heatmap of gene expressions of three principle clustering groups. Key signature genes associated with clustering are marked on the right side. d Expression of neuroendocrine differentiation marker genes and lineage transcription factors across three groups. PSCCE and SCLC samples are plotted separately to show that there was no hijacking of either cancer by the other. The upper bound, centerline, and lower bound of boxplot represent the 75 percentile, the median and the 25 percentile of data; the upper and lower whiskers extend to the largest and smallest value within 1.5 times of interquartile range (IQR) from corresponding bound. Data beyond the whiskers are plotted as outlier dots. ***P < 0.001, by the Wilcoxon rank-sum test. e GSEA revealed that E2F target genes were specifically expressed in Group NE. f GSEA revealed that RB1-loss associated genes were specifically expressed in Group NE.
Fig. 4
Fig. 4. PSCCE had two molecular subtypes.
a Gene expression heatmap of PSCCE-A and PSCCE-N subtypes identified by unsupervised consensus clustering. Amplifications of MYC family are shown on the top of the heatmap. Selected key genes related to subtyping are shown on the right side. NA: no significant SCNV observed. Source data are provided as a Source Data file. b Expressions of lineage transcription factor and neuroendocrine marker genes that were significantly differentially expressed across two subtypes. The upper bound, centerline, and lower bound of boxplot represent the 75 percentile, the median and the 25 percentile of data; the upper and lower whiskers extend to the largest and smallest value within 1.5 times of IQR from corresponding bound. Data beyond the whiskers are plotted as outlier dots. ***P < 0.001, by the Wilcoxon rank-sum test. c GSEA revealed that target genes of NEUROD1 and ASCL1 were preferentially expressed in PSCCE-N and PSCCE-A subtype. d IHC of Neurod1 and Ascl1 showed inverse expression pattern in PSCCE-N and PSCCE-A subtypes. Scale bar: 50 μm. e Kaplan–Meier plot of the overall survival of patients from two subtypes.
Fig. 5
Fig. 5. Notch pathway was inactivated in PSCCE.
a A schematic plot of Notch pathway dysregulation in PSCCEs. Up: upregulated, defined by having expression higher than three times of 95% quantile of 23 normal esophageal samples; Dn: downregulated, defined by having expression lower than one-third of 5% quantile of 23 normal esophageal samples; Mut: mutated. The proportions of tumors showing dysregulation are denoted as percentages, which are also indicated by color intensities according to the color legend. b Mutations of NOTCH1 were enriched in extracellular EGF-like repeats. Truncating mutations are plotted in red. c Kaplan–Meier plots of overall survival of PSCCE patients. Patients with mutated NOTCH1-4 had significantly poorer prognoses. d The dysregulation of Notch pathway components was observed regardless of Notch receptor status. The red dots represent tumors harboring mutations in Notch receptors (NOTCH1-4) and blue dots represent tumors with wild-type Notch receptors. Log2(foldchange), P and q values determined by DESeq2 are shown below. T tumors. N normal samples. The upper bound, centerline, and lower bound of boxplot represent the 75 percentile, the median, and the 25 percentile of data; the upper and lower whiskers extend to the largest and smallest value within 1.5 times of IQR from corresponding bound. Data beyond the whiskers are plotted as outlier dots. Source data are provided as a Source Data file.
Fig. 6
Fig. 6. PSCCE presented a T-cell excluded phenotype.
a ssGSEA scores of T cells and CD8 T cells related signatures in each cancer type. The impacts of “organ-of-origin” and “histology” on scores were determined using two-way ANOVA tests. Degree of freedom: organ-of-origin: 1; histology: 1. F values of each variate are shown in brackets behind P values. Source data are provided as a Source Data file. b T cell and CD8 T-cell abundance estimated by CIBERSORT are plotted against marker genes (CD3E and CD8A) expression level. PSCCEs are plotted in blue and other cancers in gray. The medians of each cancer type are plotted separately and annotated on the plot. c Overall Expression (OE) scores of T cells and CD8 cytotoxic T cells in each cancer. The impacts of “organ-of-origin” and “histology” on OE score were determined using the same method mentioned above. d Representative CD8A IHC staining of PSCCE. Left: overview of the fields distribution in whole section. Right top: fields of tumor parenchyma; right lower: fields of invasive margin (dashed line) between the parenchyma (P) and surrounding stroma (S). Scale bar: 100 μm. e OE scores of exclusion program for CD8 cytotoxic T cells and T cells in each cancer. In all panels, the upper bound, centerline, and lower bound of boxplot represent the 75 percentile, the median and the 25 percentile of data; the upper and lower whiskers extend to the largest and smallest value within 1.5 times of IQR from corresponding bound. Data beyond the whiskers are plotted as outlier dots. *P < 0.05, **P < 0.01, ***P < 0.001, ns not significant, by the Wilcoxon rank-sum test.

References

    1. Chen SB, et al. Treatment and prognosis of limited disease primary small cell carcinoma of esophagus. Dis. Esophagus. 2011;24:114–119. doi: 10.1111/j.1442-2050.2010.01112.x. - DOI - PubMed
    1. Zhu Y, et al. Primary small cell carcinoma of the esophagus: review of 64 cases from a single institution. Dis. Esophagus. 2014;27:152–158. doi: 10.1111/dote.12069. - DOI - PubMed
    1. Xu L, et al. Treatment strategies and prognostic factors of limited-stage primary small cell carcinoma of the esophagus. J. Thorac. Oncol. 2017;12:1834–1844. doi: 10.1016/j.jtho.2017.09.1966. - DOI - PubMed
    1. Patel S, TenNapel M, Clamon G, Bhatia S. Small cell carcinoma of the esophagus: the SEER experience from 2000–2009. Int. J. Radiat. Oncol.*Biol.*Phys. 2013;87:S292. doi: 10.1016/j.ijrobp.2013.06.766. - DOI
    1. Cai W, et al. A 10-year population-based study of the differences between NECs and carcinomas of the esophagus in terms of clinicopathology and survival. J. Cancer. 2019;10:1520–1527. doi: 10.7150/jca.29483. - DOI - PMC - PubMed

Publication types

MeSH terms

Substances

Supplementary concepts