. 2021 Jun 18;12(1):3755.
doi: 10.1038/s41467-021-23935-x.

Community factors and excess mortality in first wave of the COVID-19 pandemic in England

Affiliations

Community factors and excess mortality in first wave of the COVID-19 pandemic in England

Bethan Davies et al. Nat Commun. .

Abstract

Risk factors for increased risk of death from COVID-19 have been identified, but less is known on characteristics that make communities resilient or vulnerable to the mortality impacts of the pandemic. We applied a two-stage Bayesian spatial model to quantify inequalities in excess mortality in people aged 40 years and older at the community level during the first wave of the pandemic in England, March-May 2020 compared with 2015-2019. Here we show that communities with an increased risk of excess mortality had a high density of care homes, and/or high proportion of residents on income support, living in overcrowded homes and/or with a non-white ethnicity. We found no association between population density or air pollution and excess mortality. Effective and timely public health and healthcare measures that target the communities at greatest risk are urgently needed to avoid further widening of inequalities in mortality patterns as the pandemic progresses.


Conflict of interest statement

The authors declare no competing interests.

Figures

Fig. 1
Fig. 1. Distributions of deaths in England by sex, age and place of death.
Study period: first wave of Coronavirus Disease 19 (COVID-19) pandemic, 1 March to 31 May 2020. Comparison period: 1 March to 31 May 2015–2019.
Fig. 2
Fig. 2. Change in mortality (unadjusted, with 95% credible intervals) in England from 1 March to 31 May 2020 compared to the same period for the preceding five years, for middle super output areas (MSOAs).
A Excess deaths per 100,000 people aged 40 years and over in 2020 compared to the average for the same period for the preceding five years (n = 6,791 MSOAs). B Percent increase in death rates in 2020 compared to the average for the same period for the preceding 5 years (n = 6,791 MSOAs). MSOAs ranked from lowest to highest excess mortality. The colour of the credible interval (from purple to orange) for an MSOA represents the sum (n = 7–35) of the quintiles it falls in for each of the seven community characteristics associated with excess mortality (% population on income support; population density; % population non-white; % population living in overcrowded homes; air pollution (NO2 and PM2.5); care homes per 1000 population). Inserts are histograms of the distribution of (A) excess deaths per 100,000 people aged 40 years and over, and (B) percent increase in death rates across MSOAs.
Fig. 3
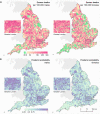
Fig. 3. Maps of middle super output areas (MSOAs) in England showing excess deaths per 100,000 people aged 40 years and over.
A Excess deaths per 100,000 males (left)/females (right) from 1 March to 31 May 2020 compared to the same period for the preceding 5 years. B Posterior probability that excess deaths >0. Community characteristics of the MSOAs were: % population on income support; population density; % population non-white; % population living in overcrowded homes; air pollution (NO2 and PM2.5); care homes per 1000 population. We map the posterior probability that measures the extent to which an estimate of excess/fewer deaths is likely to be a true increase/decrease. Where the entire posterior distribution of estimated excess deaths for an MSOA is greater than zero, there is a posterior probability of ~1 of a true increase, and conversely where the entire posterior distribution is less than zero there is a posterior probability of ~0 of a true increase. This posterior probability would be ~0.5 in an MSOA in which an increase is statistically indistinguishable from a decrease (Supplementary Table 3). Contains OS data © Crown copyright (2020). Data available under the UK Open Government Licence v3.
Fig. 4
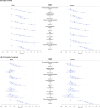
Fig. 4. The relationship between community characteristics of middle super output areas (MSOAs) in England and excess mortality from 1 March to 31 May 2020 compared to the same period for the preceding five years.
Proportional increase in death rates shown as rate ratios (data are presented as posterior mean with 95% credible intervals) for quintiles of the distributions relative to lowest quintile. Males, n = 88,092 deaths in study period (1 March–31 May 2020), 296,985 deaths in comparison period (1 March–31 May, 2015–2019); females, n = 86,235 deaths in study period (1 March–31 May 2020), 310,220 deaths in comparison period (1 March–31 May, 2015–2019). A Univariable relationship between each characteristic and excess mortality, numerical values reported in Supplementary Table 4; B Multivariable relationship between characteristic and excess mortality after adjustment for the other characteristics, numerical values reported in Supplementary Table 6.

References

    1. Kontis, V. et al. Magnitude, demographics and dynamics of the impact of the first phase of the Covid-19 pandemic on all-cause mortality in 17 industrialised countries. Nat. Med.10.1038/s41591-020-1112-0 (2020). - PMC - PubMed
    1. Office for National Statistics. Analysis of All-cause Mortality Patterns of Selected European Countries and Regions, Week Ending 3 January (Week 1) to Week Ending 12 June (Week 24) 2020. (Office for National Statistics, 2020).
    1. Williamson EJ, et al. Factors associated with COVID-19-related death using OpenSAFELY. Nature. 2020;584:430–436. doi: 10.1038/s41586-020-2521-4. - DOI - PMC - PubMed
    1. Zhou F, et al. Clinical course and risk factors for mortality of adult inpatients with COVID-19 in Wuhan, China: a retrospective cohort study. Lancet. 2020;395:1054–1062. doi: 10.1016/S0140-6736(20)30566-3. - DOI - PMC - PubMed
    1. Office for National Statistics. Deaths Involving COVID-19 by Local Area and Socioeconomic Deprivation: Deaths Occurring Between 1 March and 31 July 2020. (Office for National Statistics, 2020).

Publication types