. 2021 Jun 18;12(1):3788.
doi: 10.1038/s41467-021-24083-y.

Structural insights into an atypical secretory pathway kinase crucial for Toxoplasma gondii invasion

Affiliations

Structural insights into an atypical secretory pathway kinase crucial for Toxoplasma gondii invasion

Gaëlle Lentini et al. Nat Commun. .

Abstract

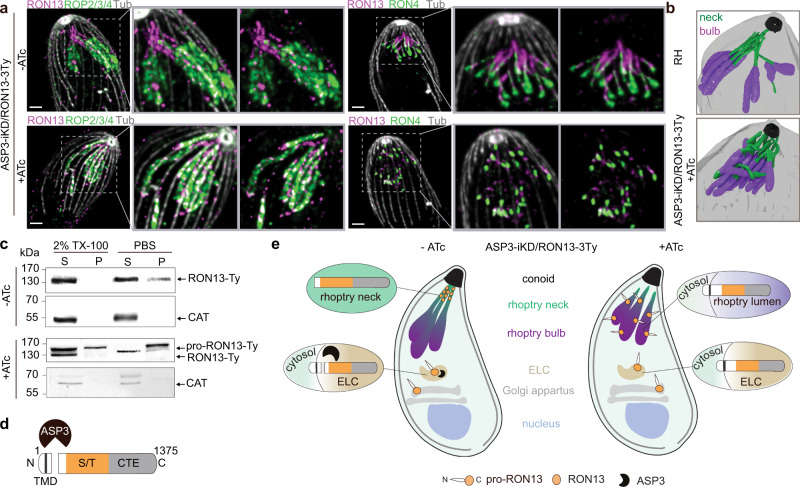
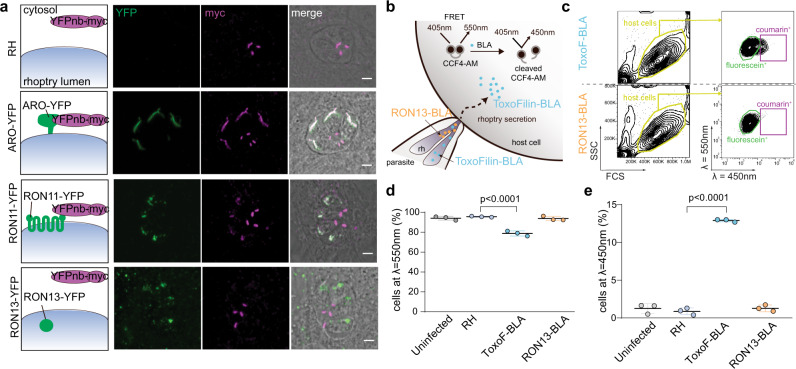
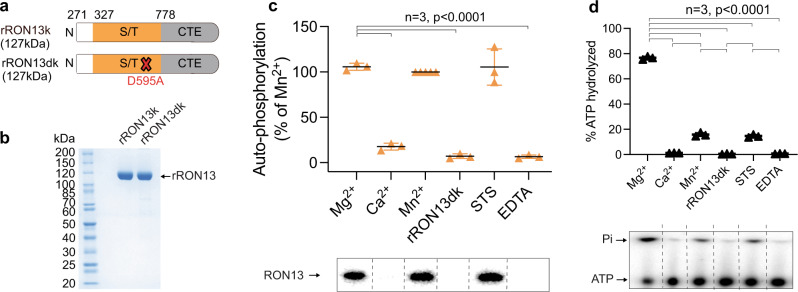
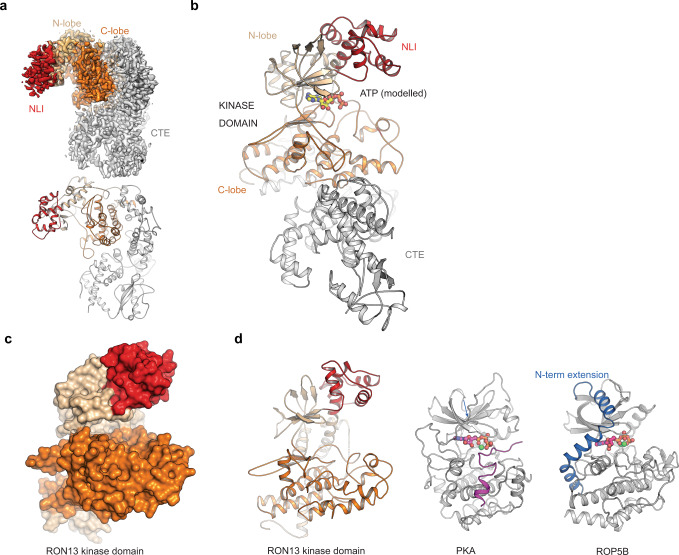
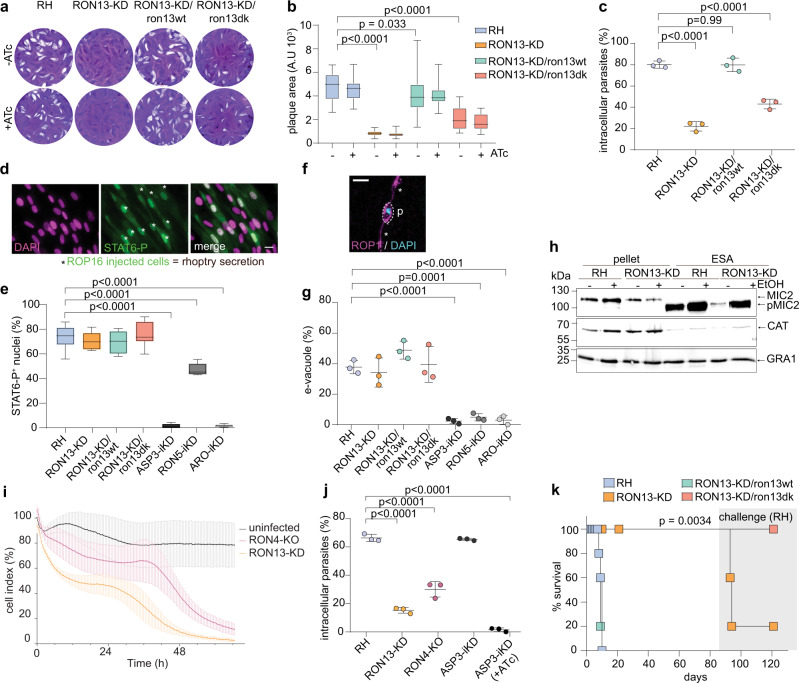
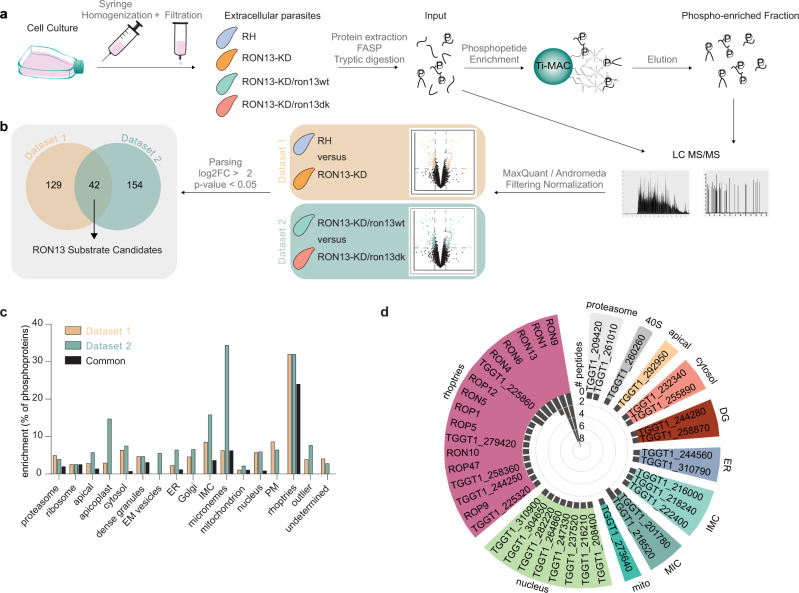
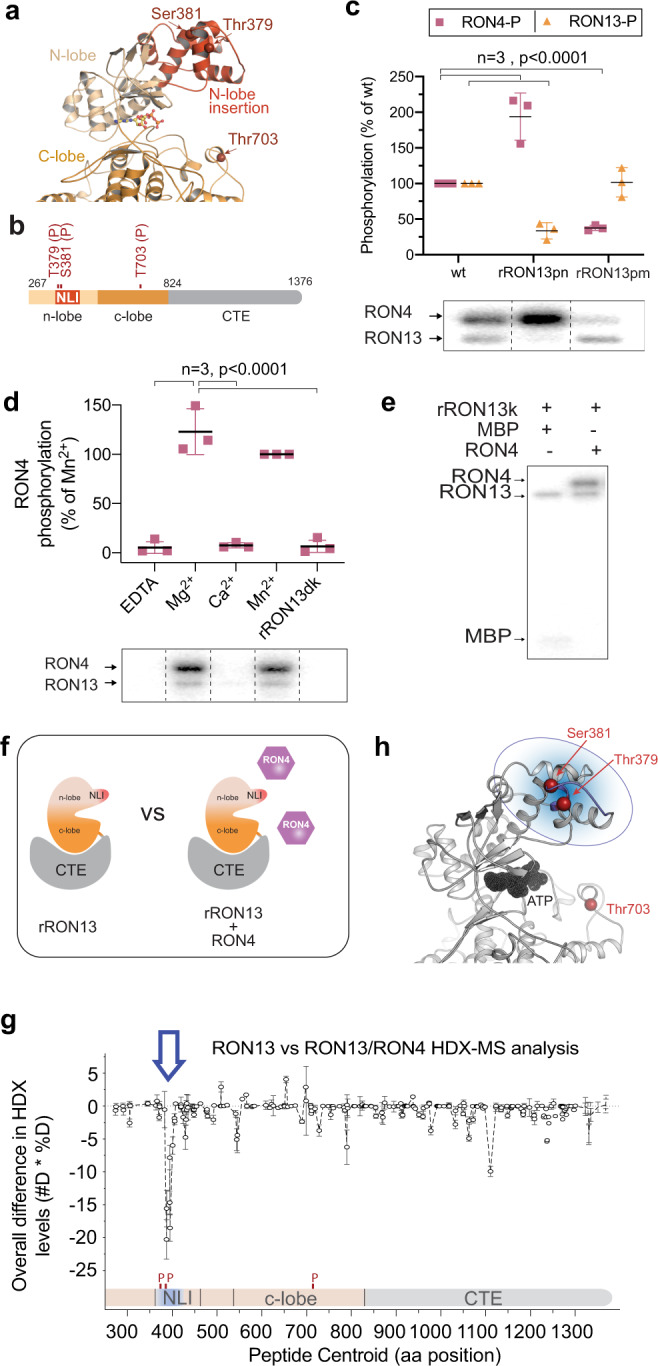
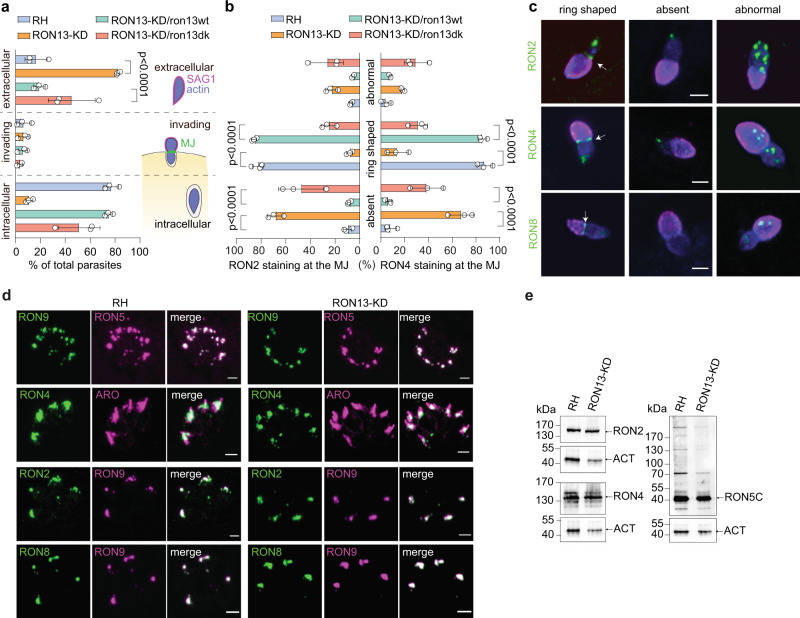
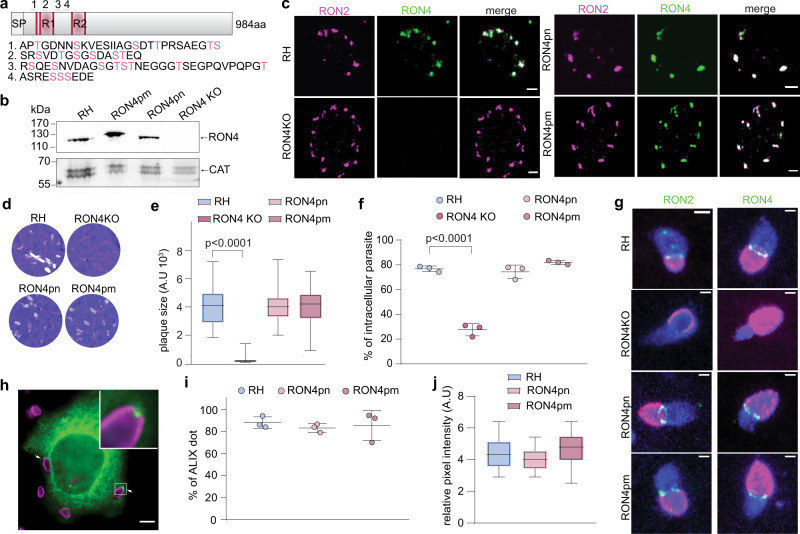
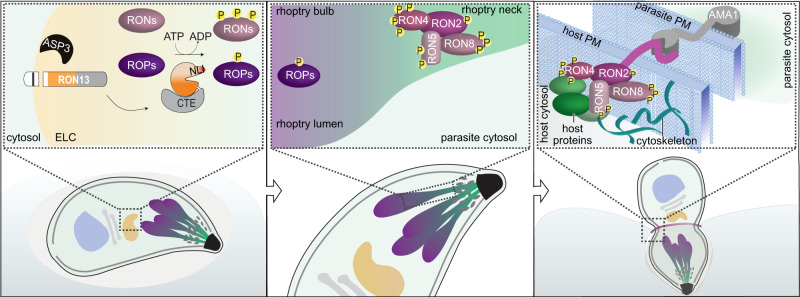
Active host cell invasion by the obligate intracellular apicomplexan parasites relies on the formation of a moving junction, which connects parasite and host cell plasma membranes during entry. Invading Toxoplasma gondii tachyzoites secrete their rhoptry content and insert a complex of RON proteins on the cytoplasmic side of the host cell membrane providing an anchor to which the parasite tethers. Here we show that a rhoptry-resident kinase RON13 is a key virulence factor that plays a crucial role in host cell entry. Cryo-EM, kinase assays, phosphoproteomics and cellular analyses reveal that RON13 is a secretory pathway kinase of atypical structure that phosphorylates rhoptry proteins including the components of the RON complex. Ultimately, RON13 kinase activity controls host cell invasion by anchoring the moving junction at the parasite-host cell interface.


Conflict of interest statement

The authors declare no competing interests.

Figures

Fig. 1
Fig. 1. RON13 is a RON kinase processed by ASP3.
a U-ExM images of rhoptries from ASP3-iKD/RON13-3Ty extracellular parasites ± anhydrotetracycline (ATc). RON4 (green) and ROP2/3/4 (green) antibodies are used to visualize the neck and the bulb of the rhoptries, respectively. RON13-3Ty (magenta) is detected by anti-Ty antibodies. The subpellicular microtubules (gray) are stained with α/β anti-tubulin antibodies. Scale bar = 2 µm. Image representative of three biologically independent experiments. b 3D reconstruction from FIB-SEM images of the apical part of RH (control) and ASP3-iKD parasites treated 48 h with ATc. The neck (green) and the bulb (violet) of the rhoptries are colored. The conoid (black) and the PM (gray) are depicted. n = 1 biologically independent experiment. c Solubility of RON13 in ASP3-iKD/RON13-3Ty parasites ±ATc. Catalase is a marker of the soluble fraction. Samples derived from the same experiment and gels were processed in parallel. Image representative of three biologically independent experiments. d Scheme of RON13 protein and its cleavage by ASP3 just downstream the transmembrane domain (TMD). S/T serine/threonine kinase domain (orange), CTE C-terminal extension (gray). e Scheme representing the fate of RON13 in presence or in absence of ASP3. Without processing by ASP3, RON13 remains insoluble and mistargeted to the body of morphologically aberrant rhoptries. ELC endosome-like compartment. Source data are provided as a Source data file.
Fig. 2
Fig. 2. RON13 is a luminal rhoptry protein that is not secreted during invasion.
a IFAs of RH-, ARO-YFP- (green), RON11-YFP- (green), or RON13-YFP- (green) expressing parasites transiently transfected with cytosolic nanobodies targeting YFP fused to a myc-tag (YFPnb-myc). ARO is a protein associated with the cytosolic face of the rhoptry membrane and RON11 is a type III transmembrane protein with its C-terminal domain exposed in the parasite cytoplasm. The myc signal (magenta) observed at the basal part of the parasite is unspecific. Left panels show the schematic topology of the proteins and their ability to bind the cytosolic YFPnb-myc. Scale bar = 2 μm. Image representative of three biologically independent experiments. b Principle of the experimental design for the FRET-based rhoptry secretion assay used to determine if RON13 (orange) is secreted into the host cell during the invasion. Toxofilin (blue) is a soluble rhoptry protein secreted into the host cell. c Gating strategy for quantification of fluorescein+ cell (green gate; λ = 550 nm) and coumarin+ cell (violet gate; λ = 450 nm) frequency for RON13-BLA- and Toxofilin-BLA-infected cell monolayer (yellow gate) analyzed by flow cytometry. d, e Frequency of fluorescein+ cells (λ = 550 nm, d) or coumarin+ cells (λ = 450 nm, e) in each condition (mean ± SD; n = 3 biologically independent experiments). Statistical significance was assessed by a one-way ANOVA significance with Tukey’s multiple comparison. Source data are provided as a Source data file.
Fig. 3
Fig. 3. Recombinant RON13 is active in vitro.
a Scheme of recombinant RON13 kinase (rRON13k) and RON13 dead kinase (rRON13dk), in which kinase activity is abrogated by introducing the mutation D595A. b Coomassie-stained gel of purified rRON13k and RON13dk produced in insect cells. c Radioactive RON13 kinase activity assays based on rRON13k autophosphorylation. Radiograph is shown below the graph. Densitometry data (mean ± SD; n = 3 biologically independent experiments) were normalized to rRON13k in presence of Mn2+. Statistical significance was determined using a two-tailed paired t test. STS staurosporine. d ATP hydrolysis during kinase reactions, as measured by TLC analysis (mean ± SD; n = 3 biologically independent experiments). Autoradiograph showing both non-hydrolyzed ATP (ATP) and inorganic phosphate (Pi) is shown below the graph. P values were determined by a two-tailed paired t test. Source data are provided as a Source data file.
Fig. 4
Fig. 4. Structure of RON13.
a Cryo-EM density map determined by single-particle analysis at a resolution of 3.1 Å (top), and the corresponding views of the atomic model of rRON13dk. The kinase domain and the C-terminal extension (CTE) are colored in orange and gray tones. b Domain organization of RON13. The position of the ATP-binding site is indicated by the ATP ligand modeled into the active site (absent in the experimentally determined density map). The N-lobe insertion (NLI, red) and the C-terminal extension (CTE, gray) are color-coded. c Surface representation of RON13 kinase domain at 3.1 Å resolution. d Comparison of RON13 kinase domain structure with other kinases. PKA from Mus musculus (PDB ID: 1atp) is complexed with MnATP and an inhibitory peptide (violet). ROP5B from T. gondii bound to ATP (PDB ID: 3q60) contains a ROP-specific N-terminal extension (blue).
Fig. 5
Fig. 5. RON13 is critical for invasion.
a Plaque assays of different parasite strains (±ATc) showing that depletion of RON13 impairs the parasite lytic cycle (no plaque), a phenotype that is fully rescued by complementation with an active RON13 kinase. Image representative of three biologically independent experiments. b Quantification of plaque assays for RH, RON13-KD, and complemented RON13-KD/ron13wt or RON13-KD/ron13dk parasites (±ATc). Data are presented as box and whiskers plot (median with min to max, n = 3 biologically independent experiments). Statistical significance was assessed by a two-way ANOVA significance with Tukey’s multiple comparison. c Invasion assay (+ATc) showing a strong invasion defect when RON13 kinase is absent or inactive P value were determined by a one-way ANOVA significance with Tukey’s multiple comparison. (Mean ± SD; n = 3 biologically independent experiments). d IFA showing a representative field of the rhoptry secretion test using phosphor-STAT6 as a readout with fibroblast nuclei stained in DAPI (magenta) and ROP16-injected cells stained with anti-phospho-STAT6 (STAT6-P) antibody (green, asterisks). Scale bar = 25 μm. Image representative of three biologically independent experiments. e Phospho-STAT6 assays assessing the ability of the parasite to secrete the rhoptry protein ROP16 into the host cell that phosphorylates host STAT6 in the nucleus. Data are presented as box and whiskers plot (median with min to max, n = 3 biologically independent experiments). Statistical significance was assessed by a two-way ANOVA significance with Tukey’s multiple comparison. f Representative IFA of the e-vacuole assay to assess rhoptry secretion when invasion is blocked by cytochalasin D. A parasite (p) secreting e-vacuoles ROP1+ (asterisks) is depicted. Parasite DNA is visualize using DAPI (blue). Scale bar = 5 µm. Image representative of three biologically independent experiments. g E-vacuole assays assessing the ability of the parasites to secrete the rhoptry protein ROP1 into the host cell (mean ± SD; n = 3 biologically independent experiments). Statistical significance was assessed by a one-way ANOVA significance with Tukey’s multiple comparison. h Microneme secretion of extracellular parasites stimulated with 2% ethanol to assess the release of MIC2 in culture supernatant. pMIC2 processed MIC2, ESA excreted–secreted antigens. GRA1 is used as a control for constitutive secretion from dense granules. Samples derived from the same experiment and gels were processed in parallel. Image representative of three biologically independent experiments. i Kinetic assay representing the cell index of HFF infected with different parasite strains. (Mean ± SD; n = 3 biologically independent experiments). j Invasion assay showing that RON13-KD and RON4-KO parasites are defective in invasion. P values were determined by a one-way ANOVA significance with Tukey’s multiple comparison (mean ± SD; n = 3 biologically independent experiments). Statistical significance was assessed by a one-way ANOVA significance with Tukey’s multiple comparison. k Virulence of different strains in mice. Surviving mice at 84 days post infection were challenged with RH parasites (gray shaded). (n = 5 biologically independent animals). P values were determined by a Mantel–Cox test. Source data are provided as a Source data file.
Fig. 6
Fig. 6. Rhoptry proteins are the major substrate of RON13.
a Workflow of the shotgun approach and phosphoproteome analysis used to identify RON13 substrates. Samples were prepared for each strain from four independent experiments (n = 4 biologically independent experiments). RH (blue) RON13-KD (orange) RON13-KD/ron13wt (green) RON13-KD/ron13dk (salmon). b Venn diagrams of the phosphoproteins found in datasets 1 and 2. c Bar graph showing the percentage of phosphoproteins from datasets 1 and 2 relative to the total number of phosphoproteins, according to their predicted localization. EM endomembrane, IMC inner membrane complex. d Polar plot of the number of phosphopeptides found in both datasets (common) binned by gene IDs and clustered, according to their predicted subcellular localizations. Source data are provided as a Source data file.
Fig. 7
Fig. 7. RON4 is a direct substrate of RON13.
a Partial view of the RON13 structure highlighting the autophosphorylation sites (arrows, red). Kinase domain (orange tones). NLI (N-lobe insertion). b Schematic representation of RON13 structure organization highlighting the autophosphorylated residues (red) mutated in this study. The kinase domain and the C-terminal extension (CTE) are colored in orange and gray tones. c Radioactive kinase activity assays comparing RON4 phosphorylation and RON13 autophosphorylation for different rRON13 phospho-mutants; phosphonull (RON13pn) and phosphomimetic (RON13pm). Autoradiograph of a representative radioactive kinase assay is shown below the graph. Data shown as mean ± SD normalized to wt (n = 3 biologically independent experiments). P values were determined using a two-tailed paired t test. d Radioactive kinase activity assays characterizing the influence of ions on rRON4 phosphorylation by RON13. Densitometry data (mean ± SD; n = 3 biologically independent experiments) were normalized to RON4 phosphorylation in presence of Mn2+. Statistical significance was determined using a two-tailed paired t test. e Autoradiograph from a radioactive kinase activity assays in presence of MBP (left) or RON4 (right) as a substrate. f Schematic representation of the two states analyzed by HDX-MS. The kinase domain and the C-terminal extension (CTE) are colored in orange and gray tones. NLI (red). RON4 (violet). g Differences in HDX rates between rRON13dk alone and in the presence of RON4. A single region encompassing amino acids 377–390 is protected by RON4, indicating the contact site between the two proteins. Data shown as mean ± SD; n = 3 biologically independent experiments. h RON13 kinase domain highlighting the RON4-binding site (residues 377–390; blue) identified by HDX-MS. This region corresponds to the NLI and encompasses the two phosphosites Thr379 and Ser381. Source data are provided as a Source data file.
Fig. 8
Fig. 8. RON13 kinase activity is important for moving junction formation during invasion.
a Graph representing the proportion of extracellular, invading, and intracellular parasites observed in the pulse-invasion assay. The scheme depicts the three stages of the invasion process considered in this assay (mean ± SD; n = 3 biologically independent experiments). Statistical significance was assessed by a one-way ANOVA significance with Tukey’s multiple comparison. b Quantification of the different types of RON2 and RON4 staining (absent, abnormal, and ring shaped) observed at the MJ of invading parasites. (Mean ± SD; n = 3 biologically independent experiments). Statistical significance was assessed by a one-way ANOVA significance with Tukey’s multiple comparison. c IFAs showing a representative example of RON2, RON4 and RON8 staining (green) of invading RON13-KD parasites obtained from three biologically independent experiments. An arrow indicates the bona fide ring-shaped MJ. Anti-SAG1 (magenta) and anti-actin (blue) antibodies stain the extracellular part of the parasite and the parasite cytoplasm, respectively. For the last row, anti-GAP45 antibodies (blue) were used. Scale bar = 2 µm. d IFAs on RH and RON13-KD intracellular parasites showing that proteins of the RON complex are well expressed and addressed to the rhoptry in RON13-KD-treated parasites. For the first row, RON5 is in magenta and RON9 in green. RON4, RON2, and RON8 are in green. Anti-ARO (magenta) and anti-RON9 (magenta) antibodies are used as rhoptry compartment markers. Scale bar = 2 µm. Image representative of three biologically independent experiments. e WB showing a comparable level of expression of RON complex proteins between RH and RON13-KD parasites using anti-RON2, anti-RON4, and anti-RON5C antibodies. Actin (anti-ACT) is used as a loading control. Image representative of three biologically independent experiments. Source data are provided as a Source data file.
Fig. 9
Fig. 9. Phosphorylation of RON4 is not required for MJ formation and ALIX recruitment.
a Schematic representation of RON4 protein. Two repeats (R1 and R2) and five motifs (pink lines) known to be important for binding host cytoskeleton are present in the N-term of RON4. The number (1, 2, 3, and 4) indicate the regions of RON4 known to be phosphorylated. The corresponding amino acid sequences and phosphorylated residues are indicated below in pink. These amino acids have been mutated in alanine or negatively charged amino acid to generate RON4 phosphonull (ron4pn) and RON4 phosphomimetic (ron4pm) mutant parasites, respectively. b Western blot showing that RON4pn and RON4pm are properly expressed. RON4-KO parasites have undetectable amount of RON4. Image representative of three biologically independent experiments. c IFA showing that mutation of phosphorylated residues either in Ala (ron4pn) or in Asp (ron4pm) does not impact RON4 (green) targeting to the rhoptry neck. Scale bar = 2 µm. Image representative of three biologically independent experiments. RON2 (magenta). d Plaque assay comparing the ability parasites to accomplish the lytic cycle. Image representative of three independent experiments. e Quantification of the plaque assay experiment. Data are presented as box and whiskers plot (median with min to max, n = 3 biologically independent experiments). Statistical significance was assessed by a one-way ANOVA significance with Tukey’s multiple comparison. f Invasion test showing the percentage of intracellular parasites reflecting their ability to invade. One-way ANOVA followed by Tukey’s multiple comparison was used to test differences between groups. (Mean ± SD; n = 3 biologically independent experiments). g IFA of invading parasites with RON2 (green) and RON4 (green) seen at the MJ except for RON4-KO invading parasites. SAG1 (magenta) and GAP45 (blue) were used to discriminate invading parasites. Scale bar = 1 µm. Image representative of three biologically independent experiments. h ALIX-GFP (green) expressing HeLa cells infected by RH parasites (magenta). ALIX recruitment at the MJ closure is indicated by white arrowhead. The inset displays the white boxed area at higher magnification. Scale bar = 5 µm. Image representative of three biologically independent experiments. i Quantification of the proportion of intracellular parasites associated with an ALIX dot in an in/out assay. Data are presented as box and whiskers plot (median with min to max, n = 3 biologically independent experiments). Statistical significance was assessed by a one-way ANOVA significance with Tukey’s multiple comparison. j Relative pixel intensity of ALIX dot recruited at the MJ in infected ALIX-GFP HeLa cells. When not stated two-way ANOVA followed by Tukey’s multiple comparison was used to test differences between groups. (Mean ± SD; n = 3 biologically independent experiments). Source data are provided as a Source data file.
Fig. 10
Fig. 10. Cartoon summarizing the main findings.
Left: in the endosome-like compartment (ELC) where protein trafficking to secretory organelles is determined, Asp3 protease cleaves the N-terminal transmembrane segment of RON13. Rhoptry proteins, including RONs and ROPs (violet tones), are phosphorylated by RON13 within this compartment. Center: RON13-phosphorylated proteins assemble to form the RON complex within the rhoptry neck, prior to being secreted into the host. Right: the RON complex, localized to the cytosolic face of the host, contributes to parasite invasion by forming a moving junction by associating with adhesins at the parasite plasma membrane (blue). Phosphorylated proteins of the RON complex additionally recruit host proteins (green) to assist in parasite invasion and subvert host cellular functions.

References

    1. Aquilini E, et al. An Alveolata secretory machinery adapted to parasite host cell invasion. Nat. Microbiol. 2021;6:425–434. doi: 10.1038/s41564-020-00854-z. - DOI - PMC - PubMed
    1. Kemp LE, Yamamoto M, Soldati-Favre D. Subversion of host cellular functions by the apicomplexan parasites. FEMS Microbiol. Rev. 2013;37:607–631. doi: 10.1111/1574-6976.12013. - DOI - PubMed
    1. Shen B, Sibley LD. The moving junction, a key portal to host cell invasion by apicomplexan parasites. Curr. Opin. Microbiol. 2012;15:449–455. doi: 10.1016/j.mib.2012.02.007. - DOI - PMC - PubMed
    1. Besteiro S, Dubremetz JF, Lebrun M. The moving junction of apicomplexan parasites: a key structure for invasion. Cell. Microbiol. 2011;13:797–805. doi: 10.1111/j.1462-5822.2011.01597.x. - DOI - PubMed
    1. Guérin A, et al. Efficient invasion by Toxoplasma depends on the subversion of host protein networks. Nat. Microbiol. 2017;2:1358–1366. doi: 10.1038/s41564-017-0018-1. - DOI - PubMed

Publication types

MeSH terms