. 2021 Jun 18;12(1):3796.
doi: 10.1038/s41467-021-24086-9.

Live-cell imaging of circadian clock protein dynamics in CRISPR-generated knock-in cells

Affiliations

Live-cell imaging of circadian clock protein dynamics in CRISPR-generated knock-in cells

Christian H Gabriel et al. Nat Commun. .

Abstract

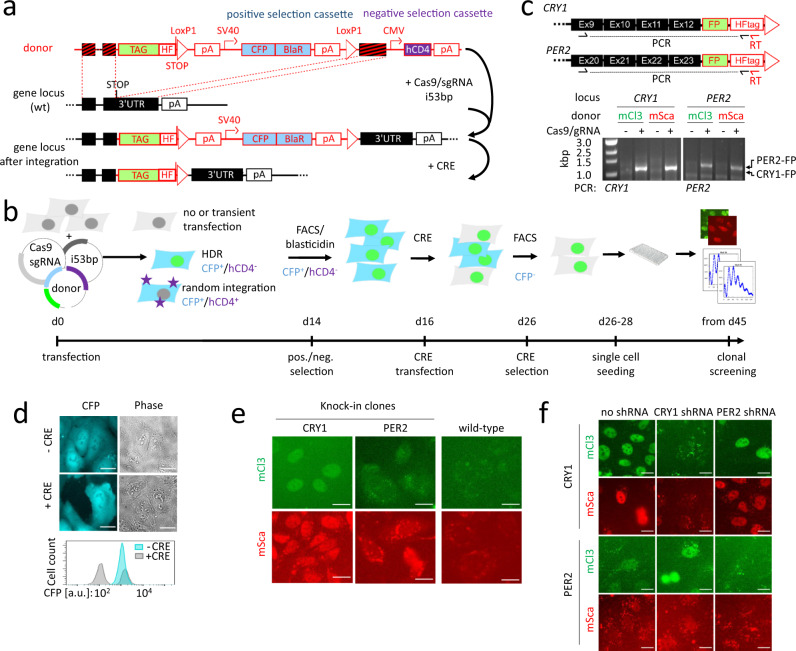
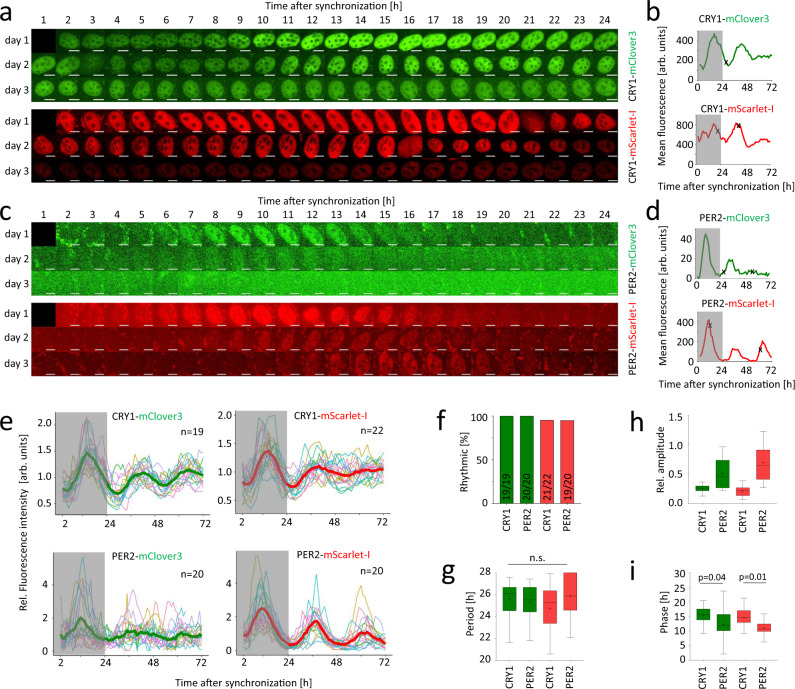
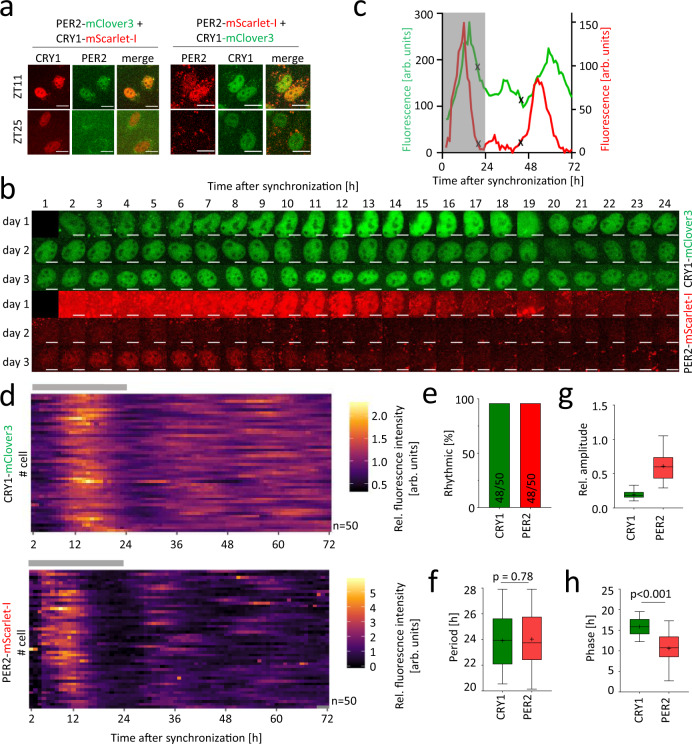
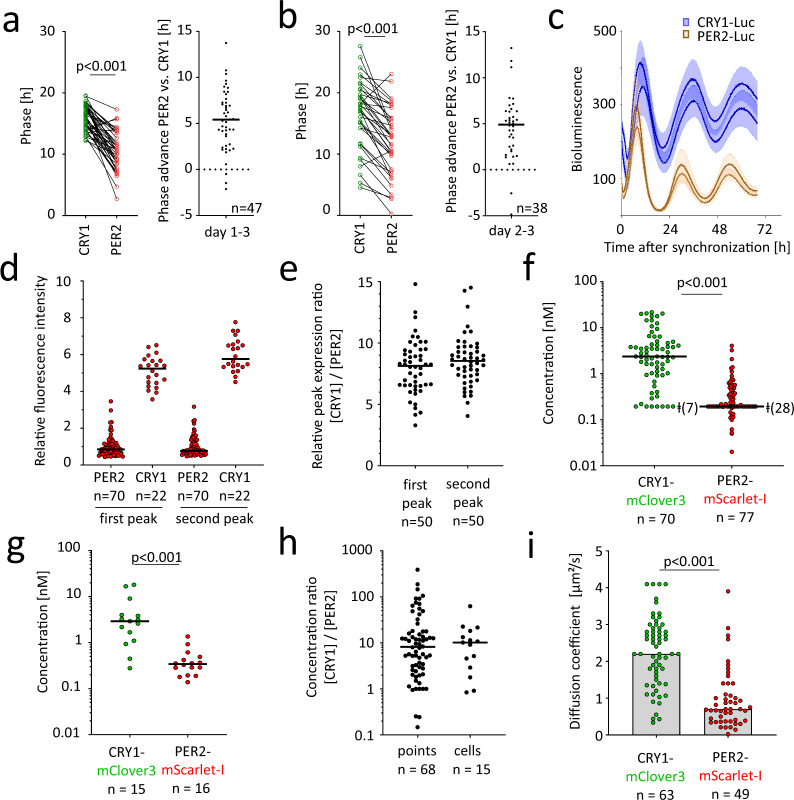
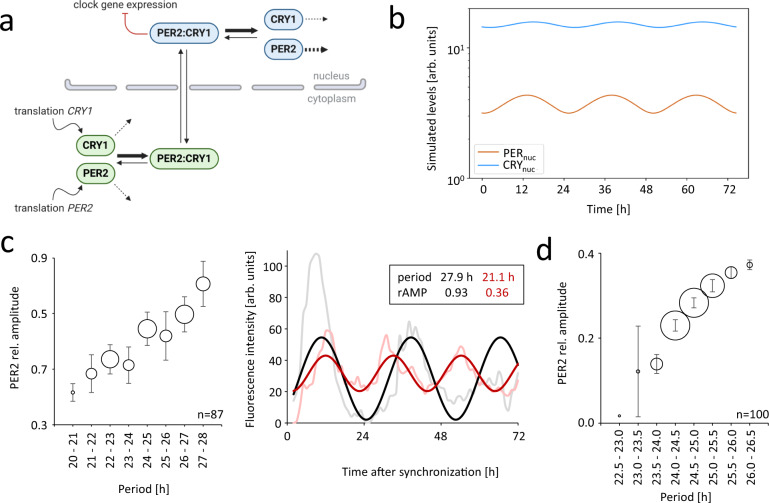
The cell biology of circadian clocks is still in its infancy. Here, we describe an efficient strategy for generating knock-in reporter cell lines using CRISPR technology that is particularly useful for genes expressed transiently or at low levels, such as those coding for circadian clock proteins. We generated single and double knock-in cells with endogenously expressed PER2 and CRY1 fused to fluorescent proteins allowing us to simultaneously monitor the dynamics of CRY1 and PER2 proteins in live single cells. Both proteins are highly rhythmic in the nucleus of human cells with PER2 showing a much higher amplitude than CRY1. Surprisingly, CRY1 protein is nuclear at all circadian times indicating the absence of circadian gating of nuclear import. Furthermore, in the nucleus of individual cells CRY1 abundance rhythms are phase-delayed (~5 hours), and CRY1 levels are much higher (>5 times) compared to PER2 questioning the current model of the circadian oscillator.


Conflict of interest statement

The authors declare no competing interests.

Figures

Fig. 1
Fig. 1. CRISPR/Cas9-mediated generation of clock protein knock-in reporter cells.
a Donor plasmid design and genome editing strategy: The tag (e.g. fluorescent protein) to be integrated and a floxed positive selection cassette (cyan fluorescent protein (CFP) + blasticidin-resistance (BlaR)) are flanked by arms, which are homologous to the genomic target region. When Cas9/single guide RNA(sgRNA)-mediated DNA double strand breaks are repaired by HDR, tag, and positive selection marker are integrated into the target region. The negative selection cassette (hCD4, a cell surface protein exclusively expressed on immune cells) is only integrated into the genome by unwanted random integration of the whole donor plasmid. b Selection strategy. Cells are transfected with Cas9, sgRNA, i53bp (see text), and donor plasmid. Stable transfectants are selected by blasticidin selection and fluorescence-activated cell sorting (FACS) of CFP positive cells (blue), while unwanted hCD4 positive cells (purple stars) are depleted. Subsequently, cells are transiently transfected with Cre recombinase (CRE) to remove the positive selection cassette from the genomic locus, and only CFP negative cells (gray) are clonally expanded and screened for successful knock-in. c Chimeric mRNA was detected in selected batch cultures by reverse transcription-polymerase chain reaction (RT-PCR) using a RT- and a reverse primer specific to the insertion and a gene-specific forward primer. d Loss of CFP expression after removal of the positive selection cassette monitored by microscopy and flow cytometry. The gating strategy used FSC and SSC signals to gate out doublets and debris. e Fluorescence microscopy images of successful knock-in clones. f Indicated knock-in cells were either left untreated or transduced with shRNA targeting either CRY1 or PER2. Images were acquired 10 h after synchronization. Corresponding differential interference contrast (DIC) images are shown in Supplementary Fig. 3a. Scale bars: 20 µm. mCl3 mClover3, mSca mScarlet-I, FP fluorescent protein, pA polyadenylation signal, SV40 simian virus-40 promoter, CMV cytomegalovirus promoter, HF His-tag/FLAG-tag, shRNA short hairpin RNA, UTR untranslated region, Ex exon, FSC forward scatter, SSC sideward scatter. Source data are provided as a Source Data file.
Fig. 2
Fig. 2. PER2- and CRY1-fusion protein oscillate in single knock-in cells.
a, c Montage of fluorescence microscopy images of selected individual U-2 OS single knock-in cells’ nuclei over the course of 3 days after synchronization. b, d Mean of nuclear fluorescence intensity (background-subtracted) quantified from (a) and (c). Cell division marked by (x). e Time series of normalized mean nuclear fluorescence in individual knock-in cells with average signal overlaid in bold. f Percentage of significantly rhythmic time series from (e). gi Extracted rhythm parameters of significantly rhythmic single-cell time series from e (n = individual cells as stated in f). p-values: one-way ANOVA, two-sided. Scale bar: 10 µm. Boxplots: box: interquartile range, center: median, whiskers: minimum to maximum, mean is marked with (+). In b, d and e, the first 24 hours after synchronization (possible acute response to dexamethasone) are highlighted by a gray box. Source data are provided as a Source Data file.
Fig. 3
Fig. 3. Simultaneous visualization of PER2- and CRY1-fusion protein oscillations in double knock-in cells.
a PER2- and CRY1-fusion protein oscillation in individual double knock-in cells. Fluorescence images of selected double-knock in clones at different times after synchronization. b Montage of bicolor fluorescence microscopy images of an individual U-2 OS double-knock-in cell’s nucleus over the course of 3 days after synchronization. c Mean nuclear fluorescence intensity (background-subtracted) quantified from (b). Cell division marked by (x). d Time series of normalized mean nuclear fluorescence in individual double knock-in cells. e Percentage of significantly rhythmic time series from d (n = individual cells as stated in f). fh Extracted rhythm parameters of significantly rhythmic single-cell time series from d. p-values: Mann-Whitney-U test, two-sided, for h, p-value = 2*10−15. Boxplots: box: interquartile range, center: median, whiskers: minimum to maximum, mean is marked by (+). Scale bar: 10 µm. The first 24 hours after synchronization (possible acute response to dexamethasone) are highlighted by a gray box (c) or bar (d). ZT = zeitgeber time. Source data are provided as a Source Data file.
Fig. 4
Fig. 4. Nuclear CRY1 peaks later and is much more abundant than PER2.
a, b Analysis of phase difference between CRY1 and PER2 nuclear accumulation in individual double knock in cells. Phases were calculated either including (a) or excluding (b) the first 24 hours of the three days’ time series. c Live-cell bioluminescence recordings of knock-in cells expressing either CRY1-luciferase or PER2-luciferase fusion proteins. Depicted are mean ± SD of 6 individual traces from 2 independent experiments with 2 clones of each knock-in. Parameter analysis in Supplementary Fig. 7a. d Relative nuclear peak intensity of fluorescence in cells expressing either PER2- or CRY1-mScarlet fusion protein. e Ratio of normalized expression of CRY1-mClover3 versus PER2-mScarlet-I in individual cells expressing both fusion proteins. fi Protein concentrations and diffusion coefficients of CRY1 and PER2 fusion proteins in double knock-in cells determined by fluorescence correlation spectroscopy (FCS) in up to five measurement areas of individual cells’ nuclei at the time of estimated PER2 peak expression. f Concentration in single measurement areas. (ǂ) marks values not exceeding background signal, which is set to estimated faithful limit of detection (numbers of points in brackets, see Materials and Methods section for more information). g Mean concentration per cell from data points shown in (f). h Ratio of CRY1-mClover3 versus PER2-mScarlet-I concentration per measurement area (left) and per individual cell (right). i Diffusion coefficients in single measurement areas. Lines in scatter plots depict median. SKI: single knock-in. DKI: double knock-in. p-values: Wilcoxon signed-pair rank test, two-sided (a and b, p-values are 6.1*10−13 and 1.3*10−8, respectively), Mann-Whitney test, two-sided (f, g, i, p-values are <10−15, 1.1*10-5, and 5.5*10−12, respectively). Numbers (n) refer to individual cells for a, b, d, e, g and h (right panel), and individual imaging areas for f, h (left panel) and i. Source data are provided as a Source Data file.
Fig. 5
Fig. 5. A mathematical model of nuclear PER2 and CRY1 dynamics in mammalian circadian clock cells reproduces experimental findings.
a Model of the PER2:CRY1 loop together with the predictions regarding half-lives and association/dissociation events that arise from our simulations (see main text). Dashed black lines represent degradation events; thicker arrows represent reactions that are predicted to occur at a higher rate. The red solid arrow depicts the inhibition of clock gene expression, exerted solely by the PER2:CRY1 nuclear complex. For a full reasoning of the model design and parameter choice, see Supplementary Note 2 and Supplementary Fig. 9. b The model exhibits sustained 24.7 h oscillations with nuclear PER2 preceding CRY1 rhythms, and with PER2 oscillating with a higher amplitude and lower magnitude than CRY1, thus reproducing experimental results. The parameter set is given in Supplementary Tab. 7. c The amplitude of PER2 rhythms increases with period in knock-in cells with significantly rhythmic oscillations (n = 87 cells, left). Exemplary raw time series and corresponding cosine fits (right) illustrate that long-period rhythms typically display larger amplitudes. The size of the circles depict the number of cells that fall in each bin. Error bars represent SEM. d Our mathematical model reproduces the positive correlation of PER2 amplitude and period. We simulated n = 100 “artificial” cells by randomly varying all transcription, translation, degradation, nuclear import and export rates. Parameter values were drawn from a uniform distribution on the interval given by the default parameter value ± 10% (see Supplementary Note 2 for simulation details). The size of the circles depict the number of cells that fall in each bin. Error bars represent SEM. rAMP relative amplitude.

References

    1. Gekakis N, et al. Role of the CLOCK protein in the mammalian circadian mechanism. Science. 1998;280:1564–1569. doi: 10.1126/science.280.5369.1564. - DOI - PubMed
    1. Kume K, et al. mCRY1 and mCRY2 are essential components of the negative limb of the circadian clock feedback loop. Cell. 1999;98:193–205. doi: 10.1016/S0092-8674(00)81014-4. - DOI - PubMed
    1. Vitaterna MH, et al. Differential regulation of mammalian period genes and circadian rhythmicity by cryptochromes 1 and 2. Proc. Natl Acad. Sci. USA. 1999;96:12114–12119. doi: 10.1073/pnas.96.21.12114. - DOI - PMC - PubMed
    1. Yoo SH, et al. Competing E3 ubiquitin ligases govern circadian periodicity by degradation of CRY in nucleus and cytoplasm. Cell. 2013;152:1091–1105. doi: 10.1016/j.cell.2013.01.055. - DOI - PMC - PubMed
    1. Isojima Y, et al. CKIepsilon/delta-dependent phosphorylation is a temperature-insensitive, period-determining process in the mammalian circadian clock. Proc. Natl Acad. Sci. USA. 2009;106:15744–15749. doi: 10.1073/pnas.0908733106. - DOI - PMC - PubMed

Publication types

MeSH terms