. 2021 Jun 18;11(1):12880.
doi: 10.1038/s41598-021-91974-x.

Comparison of microsatellite instability detection by immunohistochemistry and molecular techniques in colorectal and endometrial cancer

Affiliations

Comparison of microsatellite instability detection by immunohistochemistry and molecular techniques in colorectal and endometrial cancer

Franceska Dedeurwaerdere et al. Sci Rep. .

Abstract

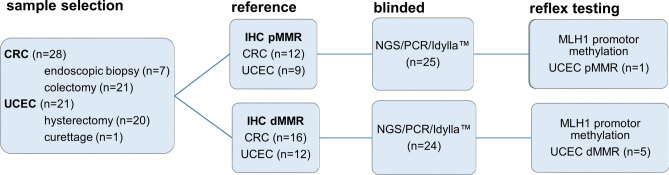
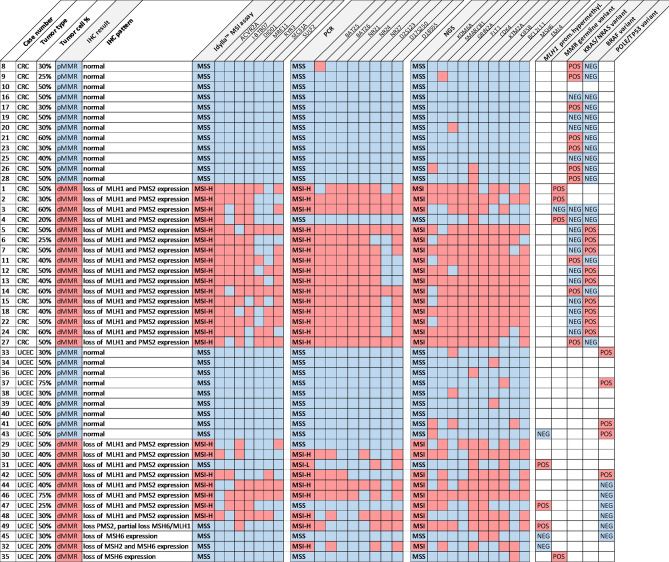
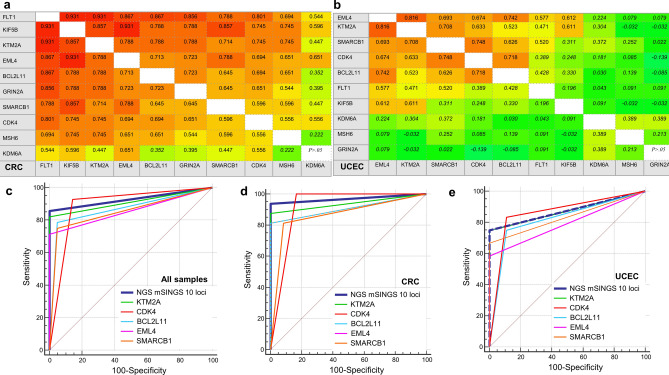
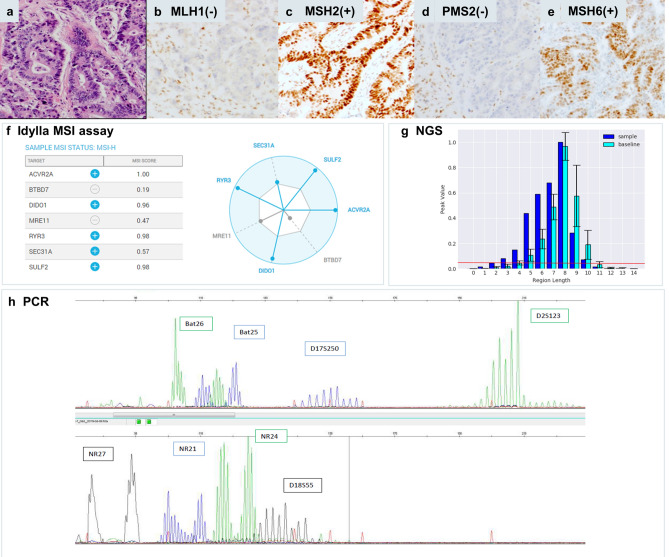
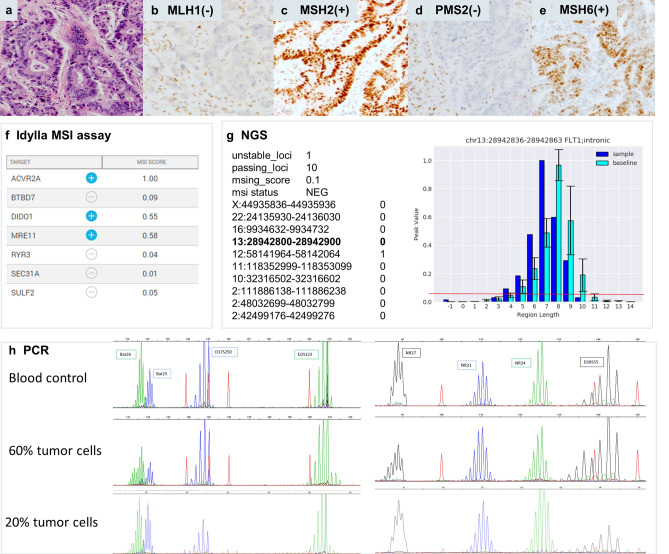
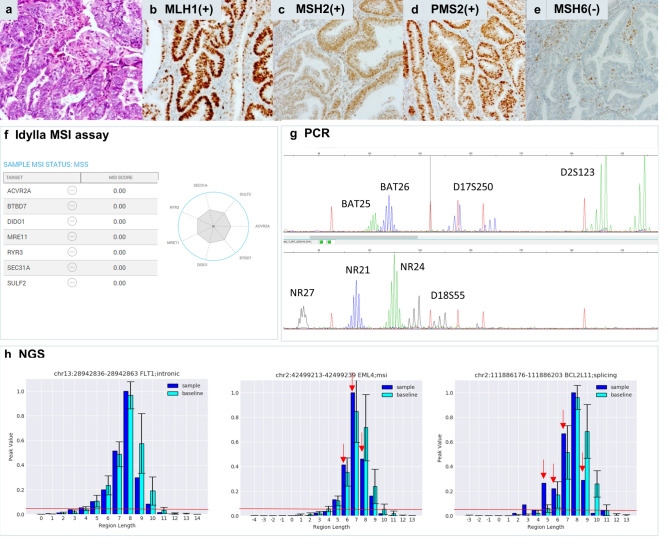
DNA mismatch repair deficiency (dMMR) testing is crucial for diagnosing Lynch syndrome and detection of microsatellite unstable (MSI) tumors eligible for immunotherapy. The aim of this study was to compare the relative diagnostic performance of three molecular MSI assays: polymerase chain reaction (PCR), MSI testing by Idylla and next-generation-sequencing (NGS) on 49 tumor samples (28 colorectal and 21 endometrial adenocarcinomas) versus immunohistochemistry (IHC). Discrepancies were investigated by MLH1 methylation analysis and integrated with germline results if available. Overall, the molecular assays achieved equivalent diagnostic performance for MSI detection with area under the ROC curves (AUC) of respectively 0.91 for Idylla and PCR, and 0.93 for NGS. In colorectal cancers with tumor cell percentages ≥ 30% all three molecular assays achieved 100% sensitivity and specificity (AUC = 1) versus IHC. Also, in endometrial cancers, all three molecular assays showed equivalent diagnostic performance, albeit at a clearly lower sensitivity ranging from 58% for Idylla to 75% for NGS, corresponding to negative predictive values from 78 to 86%. PCR, Idylla and NGS show similar diagnostic performance for dMMR detection in colorectal and endometrial cancers. Molecular MSI analysis has lower sensitivity for dMMR detection in endometrial cancer indicating that combined use of both IHC and molecular methods is recommended.Clinical Trial Number/IRB: B1172020000040, Ethical Committee, AZ Delta General Hospital.


Conflict of interest statement

The authors declare no competing interests.

Figures

Figure 1
Figure 1
Flowchart of study design. Colorectal (CRC, n = 28) and uterine corpus endometrial cancers (UCEC, n = 21) were classified as DNA mismatch repair (MMR) deficient (dMMR) or proficient (pMMR) based on immunohistochemistry as reference technique (loss of expression of MLH1, PMS2, MSH2, MSH6) and then subjected to blinded analysis of MSI status by three molecular MSI assays. In selected cases, reflex testing was done for MLH1 promoter methylation after unblinding of IHC and molecular test results.
Figure 2
Figure 2
MSS/MSI calling at locus level and integrative panel-based result for Idylla MSI assay, PCR and NGS versus immunohistochemistry. Samples are grouped according to colorectal (CRC) or uterine corpus endometrial carcinoma (UCEC) tumor type and MLH1/PMS2/MSH2/MSH6 immunohistochemical expression pattern with from top to bottom: pMMR CRC (n = 12), dMMR CRC (n = 16), pMMR UCEC (n = 9) and dMMR UCEC (n = 12) samples with the indicated tumor cell percentage, IHC pattern and case number. From left to right the results are shown of MSI calling in the 7, 8 and 10 loci of the Idylla MSI test, PCR and NGS-respectively. For each molecular technique the overall integrative binary scoring as microsatellite stable (MSS, blue) or microsatellite unstable (MSI, MSI-L: MSI-low; MSI-H: MSI-high, red) is listed first, followed by the scoring of the individual loci. Right columns indicate the presence (red, POS: positive) or absence (blue, NEG: negative) of pathogenic variants in NRAS/KRAS and BRAF in CRC and MLH1 promoter hypermethylation and (likely) pathogenic germline variants in MMR genes (MLH1, MSH2, MSH6, PMS2) in UCEC. Blank fields indicates parameter not assessed. Details on identified variants in supplementary Table S1.
Figure 3
Figure 3
functional redundancy in diagnostic performance of individual loci and overall inferior performance of all loci in endometrial versus colorectal cancers. Figure 3 shows the results of the 10 loci in the NGS assay but similar data were obtained for PCR and Idylla MSI assay. Panel (a) and (b) show correlation tables with non-parametric Spearman rank correlation coefficients of AUC of individual microsatellite loci for detection of dMMR status versus IHC in CRC (a) and UCEC (b). Coefficients in italic font indicate non statistically significant correlation (P > 0.05). Coefficients colored according to the magnitude of the correlation. Loci with the highest inter-correlation also ranked among the highest AUC (Table 2). Panel c shows graphic plot of AUC of the integrated NGS result over 10 loci (thick blue line) versus the 5 loci with the highest individual AUC over all 49 samples (c). Panel d and e plot AUC in CRC (n = 28) and UCEC (n = 21) separately. Plots created by MedCalc (version 12.2.1, www.medcalc.org).
Figure 4
Figure 4
Colorectal dMMR/MSI tumor (case 27) with concordant results between IHC and all three molecular methods. Hematoxylin eosin stain (a) of the tumor with classic morphology of colorectal adenocarcinoma with combined nuclear loss of expression of MLH1 (b) and PMS2 (d) and preserved nuclear staining for MSH2 (c) and MSH6 (e). Idylla MSI assay (f) indicates 5/7 loci MSI resulting in a global MSI-high score (Idylla Explore software v.2.5.1294). Illustrative indel distribution plot of the FLT1 locus with clearly higher numbers of integrated peaks. An indel length peak is integrated by mSINGS and counted when the fraction of aligned reads per indel length is higher than 5% of total reads for the entire locus (peak value, > 0.05, threshold for peak integration indicated by red line (plot using Python v.3.7 and Matplotlib v.3.3.4). Here the number of integrated peaks on the FLT1 locus in the test sample (dark blue, 8 peaks above threshold) is higher than number of peaks in the trained baseline (light blue, 6 peaks) thus binary calling this locus as MSI. Representative fragment length distributions as measured by PCR (GeneMapper v. 4.0 analysis software, Applied Biosystems). (g) and manually interpreted as MSI by a trained observer. (h) PCR results for 8 microsatellite markers clearly show a wide range of alleles for all loci.
Figure 5
Figure 5
Colorectal dMMR/MSI tumor (case 4) with concordant results between IHC and Idylla MSI assay but falsely negative by PCR and NGS due to low tumor cell percentage. Hematoxylin eosin stain (a) of the tumor with classic morphology of colorectal adenocarcinoma with combined nuclear loss of expression of MLH1 (b) and PMS2 (d) and preserved nuclear staining for MSH2 (c) and MSH6 (e). A sample with 20% tumor cells was extracted and analyzed by the three molecular methods. Idylla MSI assay (f) indicated 3/7 loci MSI resulting in an integrative MSI-high score (Idylla Explore software v.2.5.1294). By NGS (g) only 1 of 10 loci was called unstable (Python v.3.7 and Matplotlib 3.3.4 software), resulting in an integrative falsely negative MSS result. Illustrative indel distribution plot of the FLT1 locus: both in the tumor (dark bue bar) and in baseline (light blue bars) 6 indel peaks were integrated above the threshold (red line, > 0.05 peak value or 5% of total reads for this locus). A clear shift towards shorter indel lenghts was visible in the indel distribution of the tumor sample but this did not result in a higher number of integrated peaks versus baseline, leading to calling as MSS/0. The PCR (h) on the 20% tumor cell sample was also falsely negative (GeneMapper v. 4.0 analysis software, Applied Biosystems). Repeat analysis of case 4 in a biopsy with 60% tumor cells did result in true positive MSI calling, with widening of indel distribution as compared to normal tissue (blood sample) of this same patient, panel h right part).
Figure 6
Figure 6
Endometrial dMMR/MSI tumor (case 45) with isolated loss of MSH6 expression, falsely negative by Idylla MSI assay, PCR and NGS. Hematoxylin eosin stain (a) of the tumor with classic morphology of endometrial adenocarcinoma (UCEC) with isolated loss of nuclear MSH6 (e) and preserved nuclear expression of MLH1 (b), MSH2 (c) and PMS2 (d). Idylla MSI assay (Idylla Explore software v.2.5.1294) (f) and PCR (GeneMapper v. 4.0 analysis software, Applied Biosystems). (g) called respectively 0/7 loci and 0/8 loci as MSS, resulting in MSS integrative result (Fig. 2). NGS (Python v.3.7 and Matplotlib 3.3.4 software) called 2/10 loci as unstable (Fig. 2) resulting in an overall MSS/0 score. Illustrative indel distribution plot of the FLT1, EML4 and BCL2L11 loci (h, from left to right) indicated identical number of integrated peaks (6/5/6 for respectively FLT1/ EML4/BCL2L11 loci) in tumor sample (dark blue bars) versus baseline (light blue bars) resulting in calling these loci as negative by the default mSINGS script. However, for the EML4 and BCL2L11 loci, the overall indel distribution did shift towards shorter indel lenghts as indicated by the red arrows, suggesting the presence of molecular alterations not recognized by the current parametrization of the script.

References

    1. Lynch HT, Snyder CL, Shaw TG, Heinen CD, Hitchins MP. Milestones of Lynch syndrome: 1895–2015. Nat. Rev. Cancer. 2015;15:181–194. doi: 10.1038/nrc3878. - DOI - PubMed
    1. Cunningham JM, et al. Hypermethylation of the hMLH1 promoter in colon cancer with microsatellite instability. Cancer Res. 1998;58:3455–3460. - PubMed
    1. Lynch HT, et al. Review of the Lynch syndrome: history, molecular genetics, screening, differential diagnosis, and medicolegal ramifications. Clin. Genet. 2009;76:1–18. doi: 10.1111/j.1399-0004.2009.01230.x. - DOI - PMC - PubMed
    1. Mensenkamp AR, et al. Somatic mutations in MLH1 and MSH2 are a frequent cause of mismatch-repair deficiency in Lynch syndrome-like tumors. Gastroenterology. 2014;146:643–646. doi: 10.1053/j.gastro.2013.12.002. - DOI - PubMed
    1. Porkka N, et al. Epidemiological, clinical and molecular characterization of Lynch-like syndrome: a population-based study. Int. J. Cancer. 2019;145:87–98. doi: 10.1002/ijc.32085. - DOI - PubMed

Publication types

MeSH terms

Substances