. 2021 Jun 18;11(1):12844.
doi: 10.1038/s41598-021-91933-6.

Healthy decisions in the cued-attribute food choice paradigm have high test-retest reliability

Affiliations

Healthy decisions in the cued-attribute food choice paradigm have high test-retest reliability

Zahra Barakchian et al. Sci Rep. .

Abstract

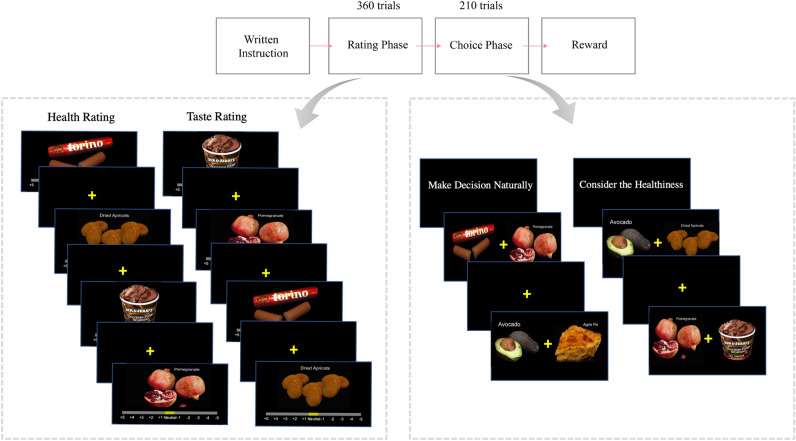
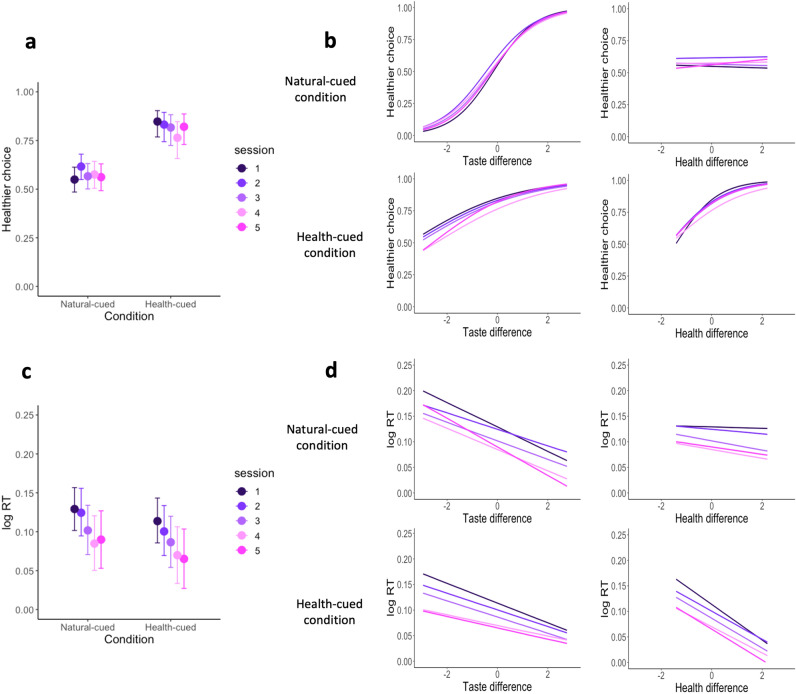
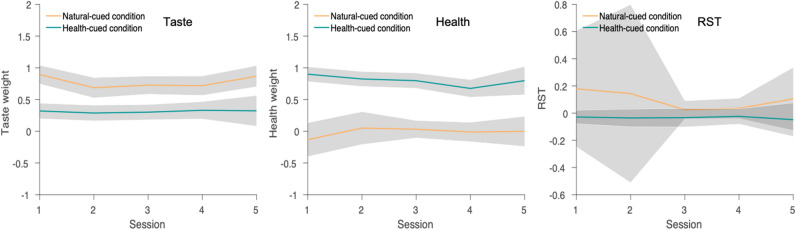
Food choice paradigms are commonly used to study decision mechanisms, individual differences, and intervention efficacy. Here, we measured behavior from twenty-three healthy young adults who completed five repetitions of a cued-attribute food choice paradigm over two weeks. This task includes cues prompting participants to explicitly consider the healthiness of the food items before making a selection, or to choose naturally based on whatever freely comes to mind. We found that the average patterns of food choices following both cue types and ratings about the palatability (i.e. taste) and healthiness of the food items were similar across all five repetitions. At the individual level, the test-retest reliability for choices in both conditions and healthiness ratings was excellent. However, test-retest reliability for taste ratings was only fair, suggesting that estimates about palatability may vary more from day to day for the same individual.


Conflict of interest statement

The authors declare no competing interests.

Figures

Figure 1
Figure 1
Experiment structure. The experiment had two phases, ratings and choices. In the ratings phase, participants rated the taste and health aspects of the foods using a visual analog scale ranging from − 5 to + 5. The order of the two ratings was counterbalanced. In the choice task, participants had to choose one of the two food items to eat at the end of the experiment. Within the choice phase, there were two conditions that differed in the attention cues given to the participants. In the health-cued condition, subjects were cued to consider the healthiness of the foods while making decisions. In the natural-cued condition, subjects were cued to make decisions naturally using whatever features freely came to mind. At the end of the session on each day, one of the participant’s choices was randomly selected and the participant was given the chosen food to eat in the behavioral laboratory.
Figure 2
Figure 2
Effects of health-cues and attribute differences on choice outcomes and RTs over the five sessions. (a,b) Shows the proportion of healthier choices on the y-axis as a function of condition (health-cued, natural-cued choice) or attribute differences (computed as healthier item minus less-healthy item) on the x-axis. The results in each session are indicated by the separate colors shown in the legend. (a) The panel shows that healthier choices were higher in the health-cued condition compared to the natural-cued condition in all five sessions. (b) The panel shows how the two attributes (taste and healthiness) relate to choice outcomes in each of the two conditions (natural-cued and health-cued). (c,d) are analogous to (a) and (b) except that they show the logarithm of response times on the y-axis as a function of condition or attribute differences on the x-axis. The error bars in both (a) and (c) represent the 95% HDIs.
Figure 3
Figure 3
Group-level rstDDM parameters by condition across sessions. These three plots show the overall trends for the taste weight, health weight, and RST parameters in the natural-cued and health-cued conditions across sessions. The values for the health and taste weights are given in arbitrary units, while the RST parameter is specified in seconds. The taste weight was higher in the natural-cued condition compared to the health-cued condition in all sessions (left panel). The health weight was higher in the health-cued condition compared to the natural-cued condition in all sessions (middle panel). The RST parameter was qualitatively lower (i.e. healthiness was considered earlier) in the health-cued condition compared to the natural-cued condition in all sessions (right panel), although there was substantial individual variability in the RST parameter during the natural-cued trials. All group-level parameters other than the RST parameter for natural-cued trials were quite stable and did not differ with repeated experience across sessions. The shaded bars indicate the 95% HDIs for each parameter. The natural-cued condition is indicated by orange color and health-cued condition is indicated by green color.
Figure 4
Figure 4
rstDDM parameters stability. The boxplots show that the values of most subject-level parameters didn’t change much across the 5 sessions. The values for the health and taste weights are given in arbitrary units, while the RST parameter is specified in seconds. However, the changes in attribute weights on the drift rate over time/experience were significantly greater in the natural-cued condition compared to the health-cued condition. We address the high variability of the RST parameters in the natural-cued condition further in the discussion section.

References

    1. Symmank C, et al. Predictors of food decision making: A systematic interdisciplinary mapping (SIM) review. Appetite. 2017;110:25–35. doi: 10.1016/j.appet.2016.11.023. - DOI - PubMed
    1. Leng G, et al. The determinants of food choice. Proceedings of the Nutrition Society. 2017;76:316–327. doi: 10.1017/S002966511600286X. - DOI - PubMed
    1. Apolzan JW, et al. Long-term weight loss with metformin or lifestyle intervention in the diabetes prevention program outcomes study. Ann. Intern. Med. 2019;170:682–690. doi: 10.7326/M18-1605. - DOI - PMC - PubMed
    1. Walker LA, Chambers CD, Veling H, Lawrence NS. Cognitive and environmental interventions to encourage healthy eating: Evidence-based recommendations for public health policy. Royal Society Open Science. 2019;6:190624. doi: 10.1098/rsos.190624. - DOI - PMC - PubMed
    1. Val-Laillet D, et al. Neuroimaging and neuromodulation approaches to study eating behavior and prevent and treat eating disorders and obesity. NeuroImage. 2015;8:1–31. doi: 10.1016/j.nicl.2015.03.016. - DOI - PMC - PubMed

Publication types