. 2021 Jun 18;4(1):761.
doi: 10.1038/s42003-021-02239-2.

Timed daily exercise remodels circadian rhythms in mice

Affiliations

Timed daily exercise remodels circadian rhythms in mice

Alun Thomas Lloyd Hughes et al. Commun Biol. .

Abstract

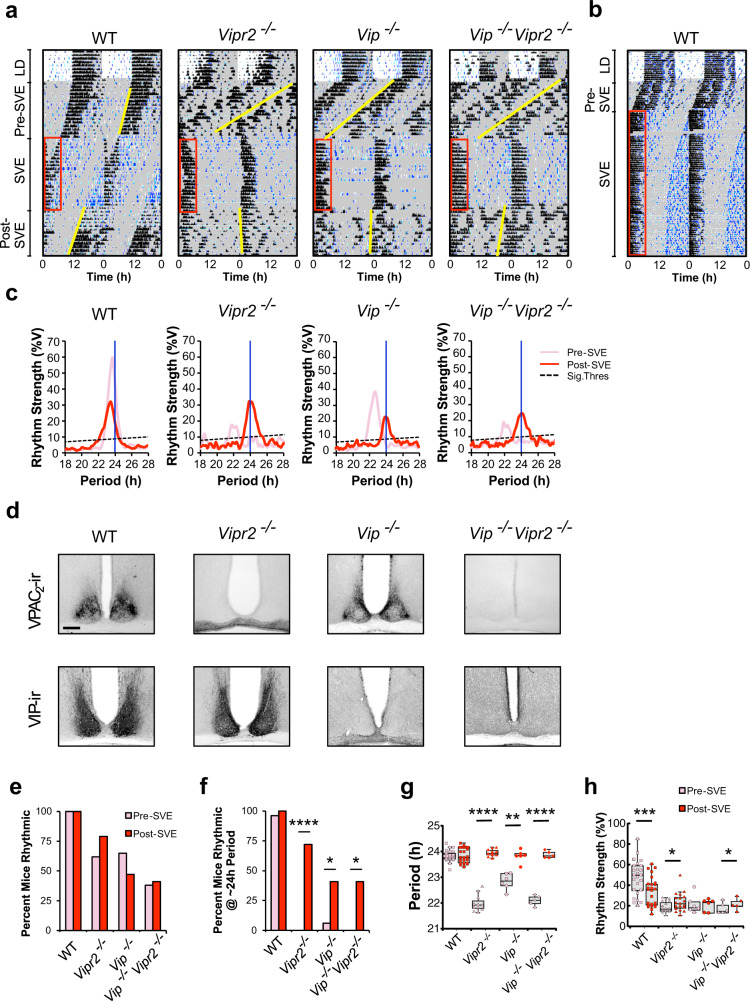
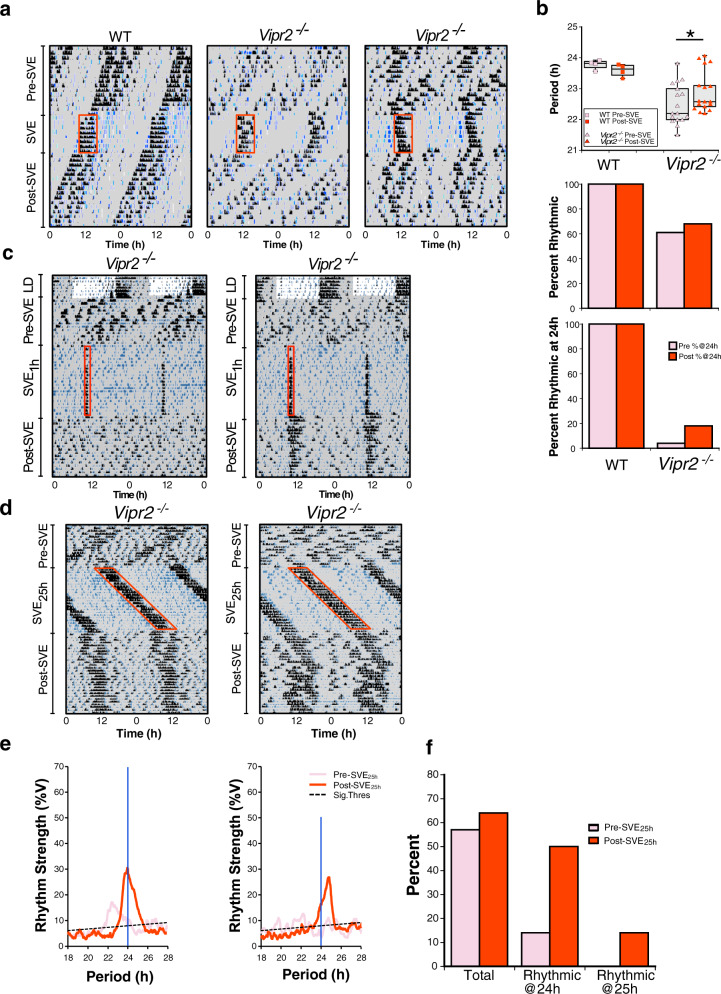
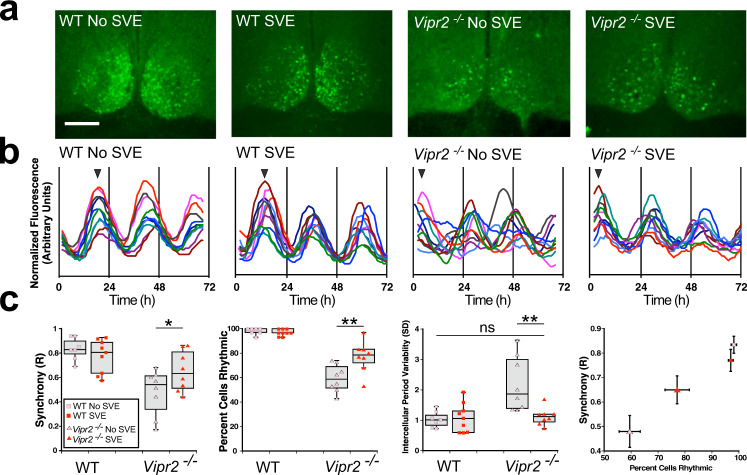
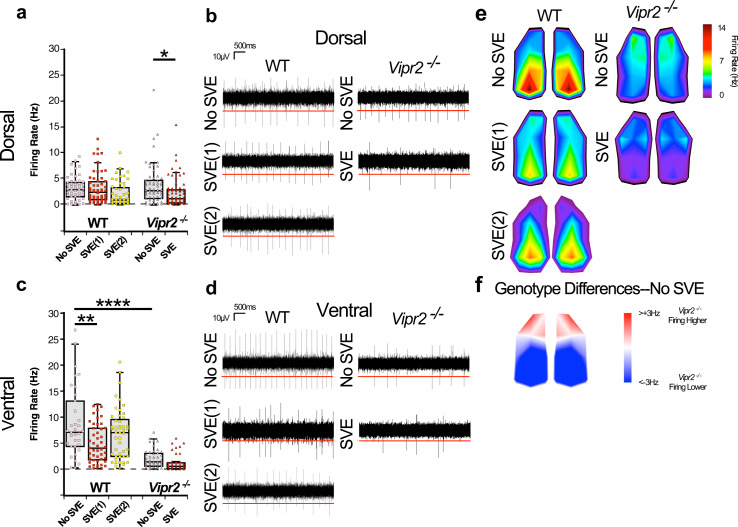
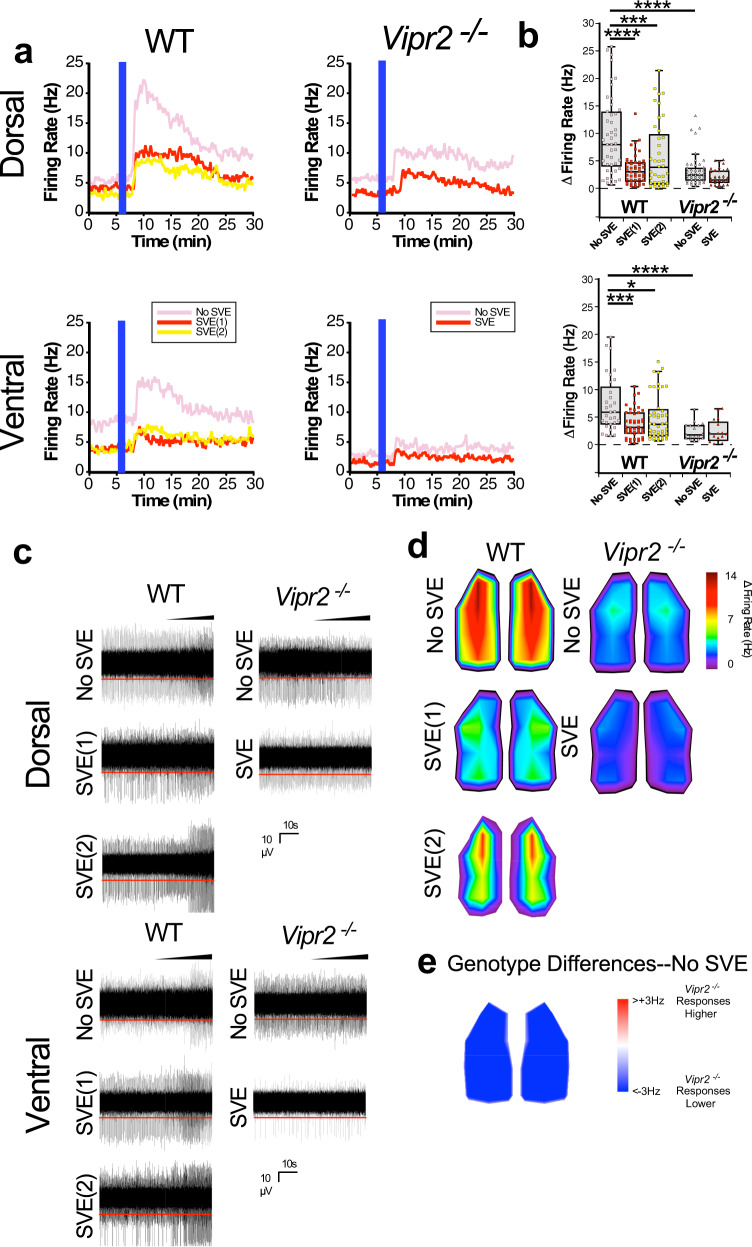
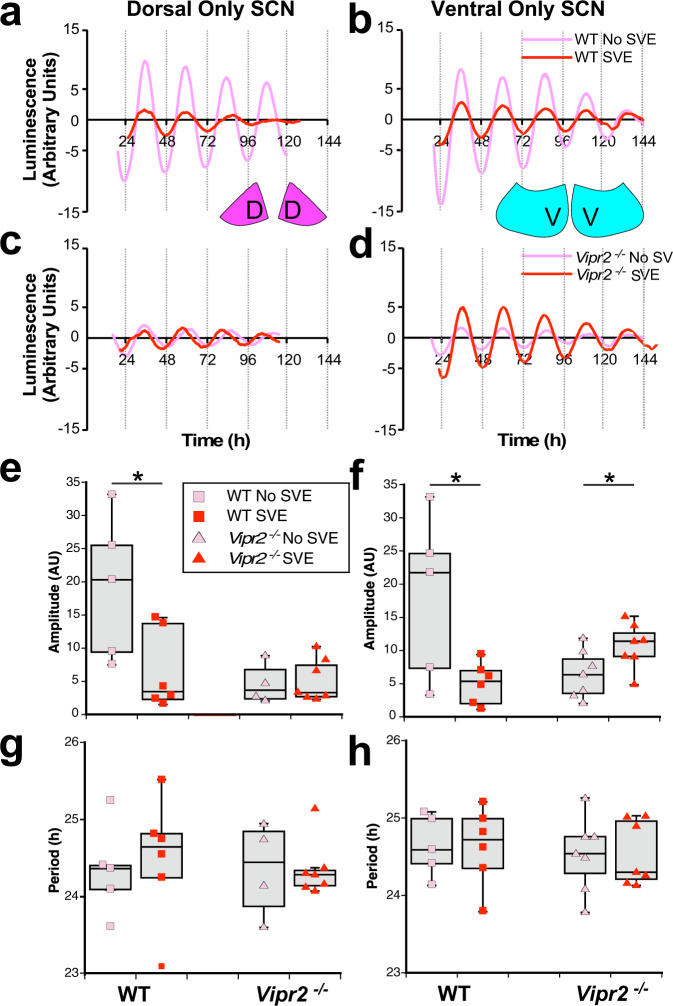
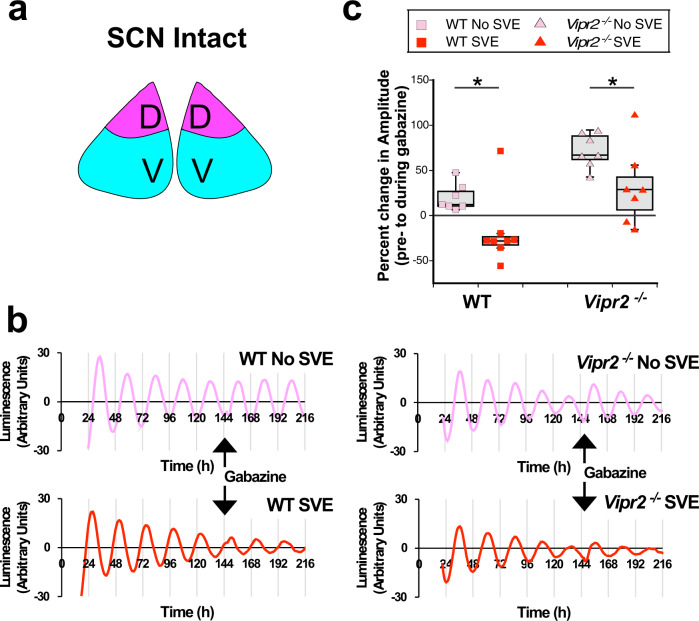
Regular exercise is important for physical and mental health. An underexplored and intriguing property of exercise is its actions on the body's 24 h or circadian rhythms. Molecular clock cells in the brain's suprachiasmatic nuclei (SCN) use electrical and chemical signals to orchestrate their activity and convey time of day information to the rest of the brain and body. To date, the long-lasting effects of regular physical exercise on SCN clock cell coordination and communication remain unresolved. Utilizing mouse models in which SCN intercellular neuropeptide signaling is impaired as well as those with intact SCN neurochemical signaling, we examined how daily scheduled voluntary exercise (SVE) influenced behavioral rhythms and SCN molecular and neuronal activities. We show that in mice with disrupted neuropeptide signaling, SVE promotes SCN clock cell synchrony and robust 24 h rhythms in behavior. Interestingly, in both intact and neuropeptide signaling deficient animals, SVE reduces SCN neural activity and alters GABAergic signaling. These findings illustrate the potential utility of regular exercise as a long-lasting and effective non-invasive intervention in the elderly or mentally ill where circadian rhythms can be blunted and poorly aligned to the external world.


Conflict of interest statement

The authors declare no competing interests.

Figures

Fig. 1
Fig. 1. Scheduled locomotor exercise promotes ~24 h behavioral rhythms in mice with disrupted VIP–VPAC2 signaling.
a Representative double-plotted actograms showing locomotor (black) and drinking (blue) activity for mice undergoing 3 weeks of scheduled voluntary exercise (SVE; n = 25, 39, 17 and 22, respectively). Shaded areas represent darkness. Red boxes indicate time of wheel availability during SVE and yellow lines mark onsets of activity pre- and post-SVE. b WT mice stably entrained to longer durations of SVE (also see Fig. S1f). c Chi2 periodograms showing dominant circadian period and rhythm strength of wheel-running activity pre-SVE (pink/light) and post-SVE (red/dark). Diagonal broken lines indicate significance threshold at p = 0.0001. Vertical blue lines indicate 24 h period for reference. d VIP and VPAC2 immunoreactivity in the SCN of wild-type (WT), Vipr2−/−, Vip−/−, and Vip−/−Vipr2−/− mice (scale bar: 200 µm). e, f Bar charts showing the percentage of rhythmic mice (e) and percentage of rhythmic mice with ~24 h period (f). g, h Dot plots overlaid on box plots show the period of wheel-running activity (g) and rhythm strength of wheel-running activity (h). Dots are the individual data points used in statistical analysis. Gray shaded boxes represent the interquartile distance between the upper and lower quartile with the median plotted as a horizontal line within the box. Whiskers in g, h depict the lower quartile − 1.5 × interquartile distance and upper quartile + 1.5 × interquartile distance (only individuals rhythmic both pre- and post-SVE were included in paired t tests due to the requirements of this repeated-measures assessment; n = 25 of 25 WT, 19 of 39 Vipr2−/−, 6 of 17 Vip−/−, 5 of 22 Vip−/−Vipr2−/−). Versions of g, h showing all data points pre- and post-SVE can be seen in Figs. S1g, h. Bar chart/dot shading for fh is as shown in e. SVE significantly increased the proportion of Vipr2−/−, Vip−/−, and Vip−/−Vipr2−/− mice rhythmic with an ~24 h period (p < 0.00001, p = 0.0195, and p = 0.035, respectively; McNemar’s test). Such mice do not spontaneously generate ~24 h behavioral rhythms in extended DD in the absence of SVE (Fig. S1a, b). The period of post-SVE locomotor behavior was significantly lengthened in Vipr2−/−, Vip−/−, and Vip−/−Vipr2−/− mice (p < 0.00001, p = 0.0028, and p < 0.00001, respectively; paired t tests) and rhythm strength was significantly increased in Vipr2−/− and Vip−/−Vipr2−/− mice (both p < 0.05); paired t tests). The phase angles of entrainment were significantly different between “LD to pre-SVE (DD1)” and “SVE to post-SVE (DD2)” for Vipr2−/− and Vipr2−/−Vip−/− (p < 0.0001) and Vip−/− (p < 0.005) mice, and there was a significantly different phase relationship between these transitions for WT mice (p < 0.0001; all paired t tests; also see Fig. S1e). *p < 0.05; **p < 0.01; ***p < 0.00005; ****p < 0.00001. Also see Fig. S1.
Fig. 2
Fig. 2. Neuropeptide signaling-deficient mice show dose-dependent responses to SVE but do not typically express ~25 h rhythms following an SVE Zeitgeber with a 25 h period.
a Representative double-plotted actograms showing locomotor activity (black) and drinking activity (blue) for WT and Vipr2−/− mice (n = 4 and 28, respectively) undergoing an 8-day 24 h SVE protocol. Shaded areas represent darkness. Red boxes indicate time of wheel availability during SVE (6 h). b Dot plot overlaid on box plot depicts the period of wheel-running activity, while bar charts show the percentage of mice rhythmic (in total) and percentage of mice rhythmic with ~24 h period pre- and post-SVE. Gray shaded boxes represent the interquartile distance between the upper and lower quartile with the median plotted as a horizontal line within the box. Whiskers in b depict the lower quartile − 1.5 × interquartile distance and upper quartile + 1.5 × interquartile distance, while the individual data point symbols show only points that contributed to statistical assessment (only individuals rhythmic both pre- and post-SVE were included in paired t tests due to the requirements of this repeated-measures assessment; n = 4 of 4 WT, 17 of 28 Vipr2−/−). A version of this panel showing all data points pre- and post-SVE can be seen in Fig. S2c. Bar/dot shading for upper and middle panels of b is as shown in the lower panel. The increase from 4 to 18% of the Vipr2−/− population (n = 28 total) expressing ~24 h rhythms following 8 days of SVE is not significant. However, the mean period of post-8-day SVE Vipr2−/− mice was significantly lengthened (22.94 ± 0.16 h post-SVE vs. 22.5 ± 0.03 h pre-SVE; p = 0.023; paired t test). *p = 0.023. Post 8-day SVE, WT behavioral period was significantly shorter than pre-8-day SVE, which represents the typical shortening of period associated with continued free run in constant darkness and is not a result of 8-day SVE (see Table 1). c Representative double-plotted actograms showing locomotor activity (black) and drinking activity (blue) for Vipr2−/− mice (n = 8) undergoing a 1 h per day SVE protocol (SVE1h). Shaded areas represent darkness. Red boxes indicate time of wheel availability during SVE (1 h). One individual exhibited robust ~24 h rhythms in behavior after 1 h/day of SVE for 21 days, but the remaining 7 individuals failed to express clearly identifiable rhythms. See also Table 1. d Representative double-plotted actograms showing locomotor activity (black) and drinking activity (blue) for Vipr2−/− mice (n = 14) undergoing a 25 h SVE protocol (SVE25h). Here the animals have the opportunity to voluntarily exercise in the running wheel for 6 h every 25 h. Shaded areas represent darkness. Red boxes indicate time of wheel availability during SVE. e Chi2 periodograms showing dominant circadian period of running-wheel activity both pre-SVE25h (pink/light) and post SVE25h (red/dark). Diagonal broken lines indicate significance threshold at p = 0.0001. Vertical blue lines indicate 24 h period for visual reference. f Bar chart showing percentages of mice rhythmic (in total), rhythmic with ~24 h period, and rhythmic with ~25 h period, pre- and post-SVE25h. Few Vipr2−/− mice express ~25h period behavioral rhythms post-SVE25h, with most mice that are rhythmic expressing ~24 h rhythms in behavior. Also see Table 1.
Fig. 3
Fig. 3. SVE significantly improves Vipr2−/− SCN temporal architecture.
a Photomicrographs of WT and Vipr2−/− SCN tissue from non-SVE and SVE mice expressing mPer1::d2eGFP fluorescence, resolved to the single-cell level (scale bar: 200 µm). b Example rhythm profiles show 10 cells each from single bilateral SCN recordings of mPer1::d2eGFP fluorescence. Arrowheads in b indicate phase of images shown in a. c SVE significantly increased the synchrony (Rayleigh R increased to 0.65 ± 0.06 from 0.48 ± 0.07 (mean ± SEM); p = 0.039) and rhythmicity (77 ± 5% vs. 59 ± 4%; p = 0.001) and reduced the intercellular variability (SD of intercellular periods reduced to 1.1 ± 0.1 from 2.2 ± 0.3; p = 0.001) of rhythms resolved at the single-cell level in Vipr2−/− SCN-containing brain slices. Correlation plot (c, far right panel) illustrates the relationship between cellular synchrony and percentage of cells rhythmic across SCNs from both genotypes and experimental conditions. *p < 0.05; **p < 0.01. WT non-SVE: 210 cells from 7 slices; WT SVE SCN: 270 cells from 9 slices; non-SVE Vipr2−/− SCN: 190 cells, 8 slices; post-SVE Vipr2:−/− 210 cells, 8 slices. Gray shaded boxes represent the interquartile distance between the upper and lower quartile with the median plotted as a horizontal line within the box. Whiskers in c depict the lower quartile − 1.5 × interquartile distance and upper quartile + 1.5 × interquartile distance. Individual data points overlaid. Also see Fig. S3.
Fig. 4
Fig. 4. Altered spontaneous action potential firing in the SCN of WT and neuropeptide signaling-deficient mice and its manipulation by SVE.
Box plots overlaid with dot plots (a, c), example recordings (b, d), and topographical heatmaps (e, f) showing multiunit MEA recordings of spontaneous action potential firing at (~CT13 for non-SVE control mice, 1 h following onset of wheel availability/onset of activity for SVE Vipr2−/− animals, and either 1 h following the onset of wheel availability (SVE(1)) or onset of behavior (drinking; SVE(2)) in WT mice). Also see Fig. S5. In the dorsal SCN subregion, firing rate varied across genotypes and exercise condition (1-way ANOVA; p < 0.0001) (see also Table S1). In the WT SCN, scheduled exercise did not alter action potential frequency in the dorsal subregion (mean ± SEM; 3.1 ± 0.3, 3.2 ± 0.4, and 2.1 ± 0.4 Hz, respectively, for non-SVE, SVE(1), and SVE(2) (n = 48, 54, and 45 recording electrodes); both p > 0.05; a, b; Table S1). Firing rate in the Vipr2−/− dorsal SCN did not differ from WT mice (p > 0.05), but scheduled exercise reduced spontaneous action potential frequency (3.8 ± 0.5 vs. 2.3 ± 0.3 Hz; n = 59 and 67; p = 0.041 a, b). In the ventral subregion, firing rate varied across genotypes and exercise condition (1-way ANOVA; <0.0001). In the WT ventral SCN, action potential frequency was reduced by scheduled exercise in the SVE(1) condition (8.8 ± 1.1 vs. 4.9 ± 0.6 Hz; n = 35 and 47, p = 0.01) but not in the SVE(2) group (6.8 ± 0.7 Hz; n = 48, p > 0.05; c, d). In the Vipr2−/− ventral SCN, spontaneous firing rate was lower than WT (p < 0.0001), but scheduled exercise did not significantly alter firing rate (1.9 ± 0.3 vs. 1.1 ± 0.2 Hz; n = 47 and 45; p > 0.05; c, d). Heatmaps show average firing (e) and differences in firing between non-SVE WT and Vipr2−/− SCN (f). Horizontal red lines in b, d show detection threshold at −17 µV. Gray shaded boxes in a, c represent the interquartile distance between the upper and lower quartile with the median plotted as a horizontal line within the box. Whiskers depict the lower quartile − 1.5 × interquartile distance and upper quartile + 1.5 × interquartile distance. Individual data points are overlaid. Recordings were made from six SCN-containing brain slices from WT non-SVE mice, and seven slices each from WT SVE(1), WT SVE(2), Vipr2−/− non-SVE, and Vipr2−/− SVE mice. *p < 0.05; **p < 0.01; ****p < 0.0001. Also see Fig. S4. Further details of statistical outcomes are in Table S1.
Fig. 5
Fig. 5. Altered GABAergic signaling in the SCN of WT and neuropeptide signaling-deficient mice and its manipulation by SVE.
a Example firing rate response plots, b box plots overlaid with dot plots, c example recordings, and d, e topographical heatmaps showing multiunit firing rate responses of SCN to treatment with 100 μM gabazine, recorded using MEA. In the dorsal SCN subregion, firing rate response to gabazine varied over genotype and exercise condition (1-way ANOVA; p < 0.0001; see also Table S2). Scheduled voluntary exercise did not significantly reduce the firing rate response of dorsal Vipr2−/− SCN to gabazine (3.4 ± 0.4, 2.2 ± 0.2 Hz, non-SVE and SVE, respectively; n = 46 and 34 recording electrodes; p > 0.05) but significantly reduced the response of WT dorsal SCN neurons to GABA blockade (dorsal WT: 9.7 ± 1.0, 3.5 ± 0.4, and 6.1 ± 1.0 Hz, n = 45, 46, and 39; non-SVE, SVE(1), and SVE(2), respectively, both p < 0.001; Table S2). In the ventral SCN, firing rate response to gabazine varied over genotype and exercise condition (1-way ANOVA; p < 0.0001). Scheduled voluntary exercise significantly reduced the response to gabazine of ventral WT SCN neurons: 7.4 ± 0.9, 3.8 ± 0.4, 5.0 ± 0.6 Hz, n = 31, 46, and 44, respectively, p < 0.01 and p < 0.05) but did not alter the firing rate response of ventral Vipr2−/− SCN neurons to gabazine (2.4 ± 0.4 vs. 2.5 ± 0.5 Hz; n = 17 and 16; p > 0.05; Table S2). Both dorsal and ventral Vipr2−/− responses to gabazine in SCNs from non-SVE animals were lower than corresponding WT values (both p < 0.0001). Vertical blue lines on traces in a indicate the time of treatment with gabazine. Gray shaded boxes in b represent the interquartile distance between the upper and lower quartile with the median plotted as a horizontal line within the box. Whiskers depict the lower quartile − 1.5 × interquartile distance and upper quartile + 1.5 × interquartile distance. Individual data points are overlaid. c Horizontal red lines in c show detection threshold at −17 µV and sloped black bars indicate increasing concentration of gabazine in the slice chamber during gabazine wash-in. d, e Topographical heatmaps showing average changes in SCN firing in response to gabazine treatment (d) and average differences in response to gabazine treatment between non-SVE recordings for WT and Vipr2−/− SCN (e). Numbers of slices recorded as for Fig. 4. *p < 0.05; ***p < 0.001; ****< 0.0001. Also see Fig. S4. Further details of statistical outcomes are in Table S2.
Fig. 6
Fig. 6. SVE improves molecular rhythms in the ventral SCN in microdissected explants from Vipr2−/− mice.
ad PER2::LUC bioluminescence amplitude was significantly reduced by SVE in the WT dorsal only SCN (doSCN; pink filled D diagram insert) and ventral only SCN (voSCN; blue filled diagram insert) microdissected mini slices (dorsal: 19.2 ± 4.8 vs. 6.5 ± 2.4 arbitrary units, p = 0.018; ventral: 18.0 ± 5.6 vs. 5.0 ± 1.3, p = 0.017) but was boosted by SVE in the Vipr2−/− voSCN (6.4 ± 1.4 vs. 10.7 ± 1.3; p = 0.041, all t tests). SVE did not alter amplitude in the Vipr2−/− doSCN (4.6 ± 1.5 vs. 5.1 ± 1.2; p > 0.05). Period (g, h) was not altered by SVE in either part of the SCN for either genotype. Gray shaded boxes in eh represent the interquartile distance between the upper and lower quartile with the median plotted as a horizontal line within the box. Whiskers depict the lower quartile − 1.5 × interquartile distance and upper quartile + 1.5 × interquartile distance. Individual data points are overlaid. *p = 0.05. Symbol color coding in fh is as shown in e. a, c, e, g show data from doSCN. b, d, f, h show data from vo SCN. See also Figs. S3 and S4. D and V in diagram inserts label dorsal SCN and ventral SCN, respectively.
Fig. 7
Fig. 7. SVE reduces GABAergic influences on PER2 rhythms in the intact SCN.
a Schematic diagram of intact SCN. b, c Gabazine treatment evoked significant increases in PER2::LUC rhythm amplitude in intact SCN (pink and blue filled diagram insert) from non-SVE WT and Vipr2−/− mice. This was abolished and significantly reduced in post-SVE tissue from WT and Vipr2−/− SCN, respectively (percent changes in amplitude during gabazine treatment: WT non-SVE 20.0 ± 5.6% vs. WT SVE −19.2 ± 13.5%, p = 0.024; Vipr2−/− non-SVE 72.1 ± 7.2% vs. Vipr2−/− SVE 31.9 ± 16.2%, p = 0.025. All ANOVA with planned comparisons). WT (mPer2luc): non-SVE, n = 7 and SVE n = 8 and Vipr2−/− (Vipr2−/−,mPer2luc): n = 7 each, non-SVE and post-SVE. Abnormal increases in amplitude of non-SVE Vipr2−/− SCN in response to GABAA receptor blockade are reduced to WT-like responses in post-SVE Vipr2−/− SCN. Gray shaded boxes in c represent the interquartile distance between the upper and lower quartile with the median plotted as a horizontal line within the box. Whiskers depict the lower quartile − 1.5 × interquartile distance and upper quartile + 1.5 × interquartile distance. Individual data points are overlaid. *p = 0.05. See also Figs. S3 and S4. D and V in diagram inserts label dorsal SCN and ventral SCN, respectively.

References

    1. Mohawk JA, Takahashi JS. Cell autonomy and synchrony of suprachiasmatic nucleus circadian oscillators. Trends Neurosci. 2011;34:349–358. doi: 10.1016/j.tins.2011.05.003. - DOI - PMC - PubMed
    1. Welsh DK, Takahashi JS, Kay SA. Suprachiasmatic nucleus: cell autonomy and network properties. Annu. Rev. Physiol. 2010;72:551–577. doi: 10.1146/annurev-physiol-021909-135919. - DOI - PMC - PubMed
    1. Brown TM, Piggins HD. Electrophysiology of the suprachiasmatic circadian clock. Prog. Neurobiol. 2007;82:229–255. doi: 10.1016/j.pneurobio.2007.05.002. - DOI - PubMed
    1. Colwell CS. Linking neural activity and molecular oscillations in the SCN. Nat. Rev. Neurosci. 2011;12:553–569. doi: 10.1038/nrn3086. - DOI - PMC - PubMed
    1. Hegazi, S. et al. A symphony of signals: intercellular and intracellular signaling mechanisms underlying circadian timekeeping in mice and flies. Int. J. Mol. Sci. 10.3390/ijms20092363 (2019). - PMC - PubMed

Publication types