. 2021 Jul;40(29):4759-4769.
doi: 10.1038/s41388-021-01876-5. Epub 2021 Jun 18.

The FLI portion of EWS/FLI contributes a transcriptional regulatory function that is distinct and separable from its DNA-binding function in Ewing sarcoma

Affiliations

The FLI portion of EWS/FLI contributes a transcriptional regulatory function that is distinct and separable from its DNA-binding function in Ewing sarcoma

Megann A Boone et al. Oncogene. 2021 Jul.

Abstract

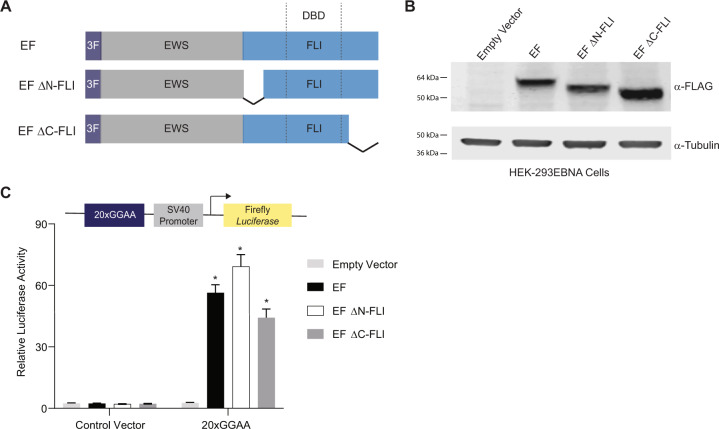
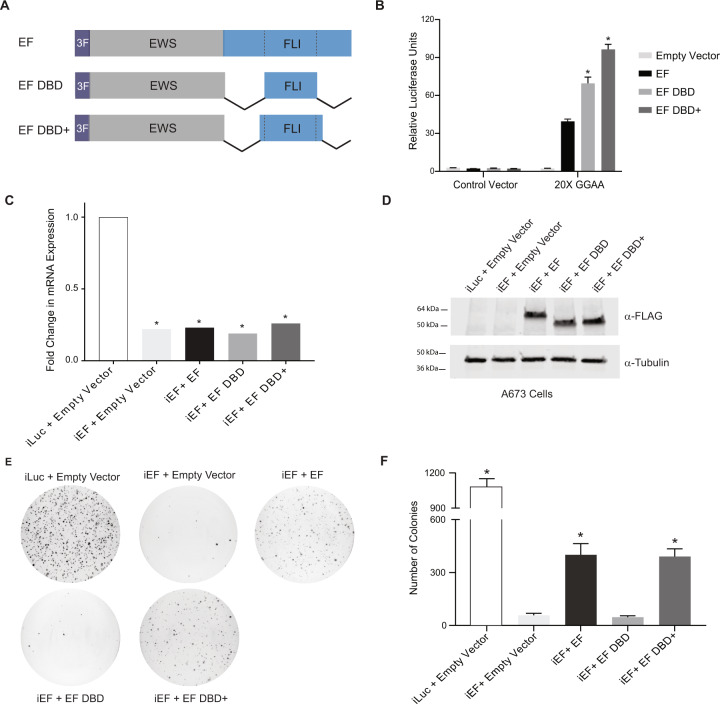
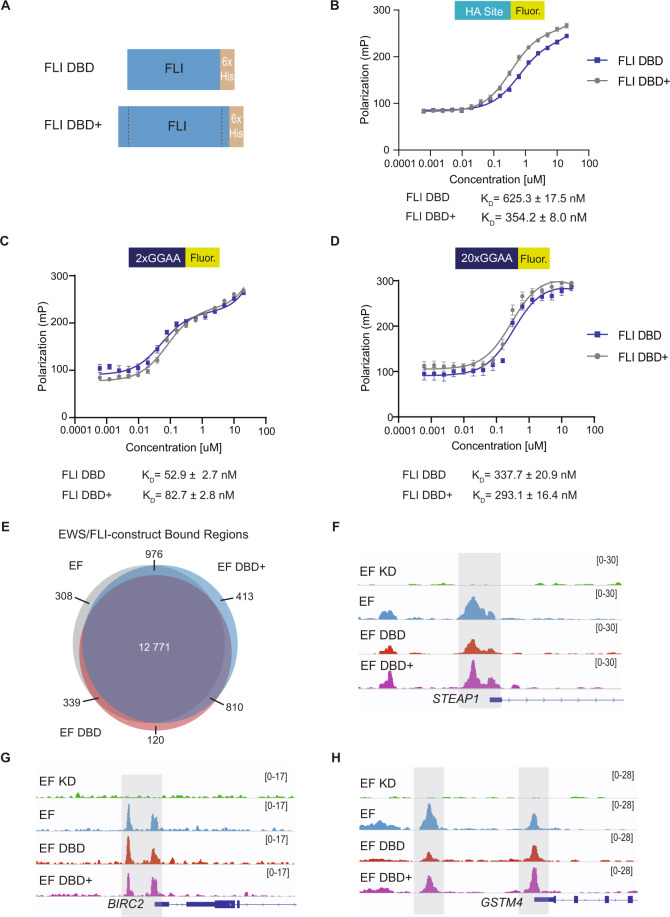
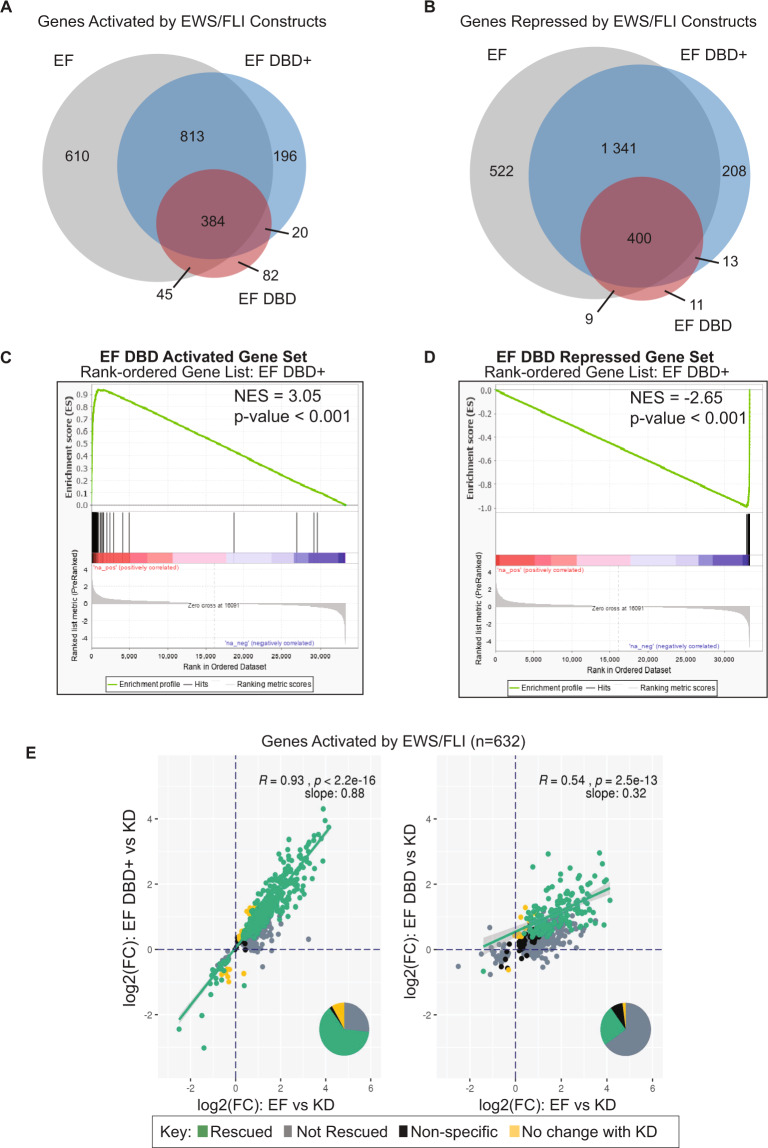
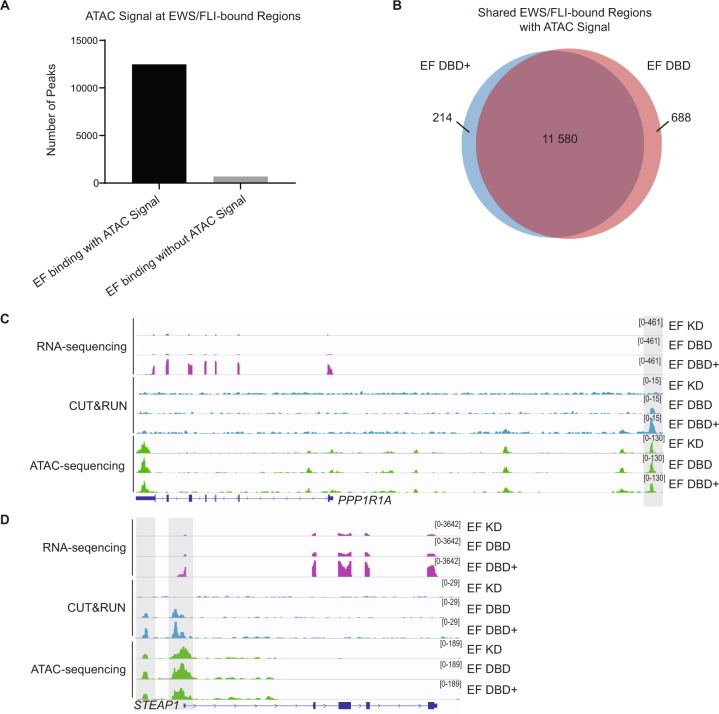
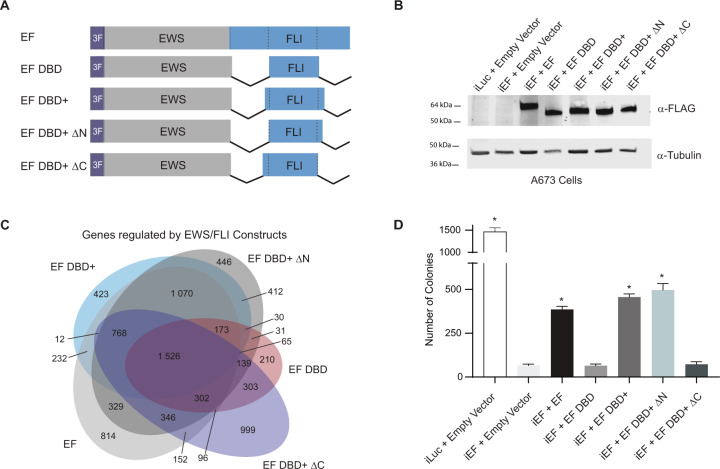
Ewing sarcoma is an aggressive bone cancer of children and young adults defined by the presence of a chromosomal translocation: t(11;22)(q24;q12). The encoded protein, EWS/FLI, fuses the amino-terminal domain of EWS to the carboxyl-terminus of FLI. The EWS portion is an intrinsically disordered transcriptional regulatory domain, while the FLI portion contains an ETS DNA-binding domain and two flanking regions of unknown function. Early studies using non-Ewing sarcoma models provided conflicting information on the roles of each domain of FLI in EWS/FLI oncogenic function. We therefore sought to define the specific contributions of each FLI domain to EWS/FLI activity in a well-validated Ewing sarcoma model and, in doing so, to better understand Ewing sarcoma development mediated by the fusion protein. We analyzed a series of engineered EWS/FLI mutants with alterations in the FLI portion using a variety of assays. Fluorescence anisotropy, CUT&RUN, and ATAC-sequencing experiments revealed that the isolated ETS domain is sufficient to maintain the normal DNA-binding and chromatin accessibility function of EWS/FLI. In contrast, RNA-sequencing and soft agar colony formation assays revealed that the ETS domain alone was insufficient for transcriptional regulatory and oncogenic transformation functions of the fusion protein. We found that an additional alpha-helix immediately downstream of the ETS domain is required for full transcriptional regulation and EWS/FLI-mediated oncogenesis. These data demonstrate a previously unknown role for FLI in transcriptional regulation that is distinct from its DNA-binding activity. This activity is critical for the cancer-causing function of EWS/FLI and may lead to novel therapeutic approaches.


Conflict of interest statement

Research reported in this publication was supported by the National Institute of Health award T32 GM068412 to MAB, and U54 CA231641 to SLL. The content is solely the responsibility of the authors and does not necessarily represent the official views of the National Institutes of Health. SLL declares a competing interest as a member of the advisory board for Salarius Pharmaceuticals. SLL is also a listed inventor on United States Patent No. US 7,939,253 B2, “Methods and compositions for the diagnosis and treatment of Ewing’s sarcoma,” and United States Patent No. US 8,557,532, “Diagnosis and treatment of drug-resistant Ewing’s sarcoma.” This does not alter our adherence to Oncogene policies on sharing data and materials.

Figures

Fig. 1
Fig. 1. Amino- and carboxyl-terminal regions of FLI are not required for EWS/FLI-mediated transcriptional activation.
A Protein schematic of 3xFLAG-tagged (3 F) EWS/FLI (EF) cDNA constructs. EWS is represented in gray, FLI is represented in blue, and dashed lines in the FLI portion represent the 85-amino acid ETS DNA-binding domain (DBD) of FLI. In each construct, EWS is fused directly to the FLI portion, but connecting lines are shown here to represent regions of FLI that are eliminated in each construct. EF represents a full-length “type IV” EWS/FLI translocation. EF ΔN-FLI and EF ΔC-FLI indicate constructs where EWS was fused to a version of FLI with a deletion in the amino- or carboxyl-terminal region, respectively. B Western blot of 3xFLAG-tagged EWS/FLI protein expression in HEK-293EBNA cells. Membranes were probed with either α-FLAG or α-tubulin antibodies. C Dual luciferase reporter assay results for the indicated cDNA constructs co-transfected into HEK-293EBNA cells with a Control Vector harboring no GGAA-repeats, or a vector containing 20xGGAA-repeats (represented above the graph). Data are presented as mean ± SEM (N = 6 biological replicates with 3 technical replicates each). Asterisks indicate that the activity of EF, EF ΔN-FLI, and EF ΔC-FLI are each statistically significant when compared to Empty Vector on a 20xGGAA μSat (p-value < 0.05). The activity of EF ΔN-FLI and EF ΔC-FLI are not statistically different from EF on the 20xGGAA μSat (p-value = 0.8).
Fig. 2
Fig. 2. Oncogenic transformation capacity of EWS/FLI affected by short regions surrounding the FLI DBD.
A Protein schematic of 3xFLAG-tagged (3 F) EWS/FLI cDNA constructs with deleted FLI domain regions. EF represents a full-length type IV EWS/FLI, EF DBD represents EWS fused directly to the 85-amino acid DNA-binding domain of FLI, and EF DBD+ represents EWS fused to a 102-amino acid region of FLI that contains the 85 amino-acid DNA-binding domain with 7 additional amino-acids on the amino-terminal side and 10 additional amino-acids on the carboxyl-terminal side. B Dual luciferase reporter assay results for the indicated constructs tested on control and 20xGGAA μSat-containing plasmids (as described in Fig. 1). Data are presented as mean ± SEM (N = 6 biological replicates with 3 technical replicates each). Asterisks indicate that the activity of EF DBD and EF DBD+ are each statistically higher than EF (p-value < 0.001). C Representative qRT-PCR results of endogenous EWS/FLI in A673 cells harboring the indicated constructs (iLuc is a control shRNA targeting luciferase and iEF is a shRNA targeting the 3′UTR of endogenous EWS/FLI; N = 1 biological replicate with 3 technical replicates for each sample). EWS/FLI mRNA values are normalized to RPL30 mRNA control values. Asterisks indicate samples are statistically different as compared to control (iLuc + Empty Vector) cells (p-value < 0.001). D Western blot analysis of exogenous EWS/FLI protein expression in the A673 knock-down/rescue cells. Protein constructs were detected using α-FLAG antibody and α-Tubulin was used as a loading control. E Representative soft agar assay results of A673 Ewing sarcoma cells containing the indicated constructs. F Soft agar assay colony formation quantification. Data presented as mean ± SEM (N = 9 biological replicates with 2 technical replicates each). Asterisks indicate p-value < 0.001 as compared to iEF + Empty Vector cells.
Fig. 3
Fig. 3. DNA-binding and genomic localization properties of EWS/FLI unaltered by deletions flanking the FLI DNA-binding domain.
A Protein schematic of FLI DBD and FLI DBD+ recombinant protein (with C-terminal 6xHistidine-tag [6xHis]). BD Fluorescence anisotropy assay results for FLI DBD and FLI DBD+ recombinant proteins (0–20 μM) on 5 nM fluorescein-labeled DNA sequences: B ETS high-affinity (HA) site DNA, C 2x-repeat GGAA μSat DNA, and D 20x-repeat GGAA μSat DNA (N = 2 biological replicates, 3 technical replicates each). Dissociation constants (KD) for FLI DBD and FLI DBD+ are noted for each DNA response element. E Venn diagram comparing peaks called in CUT&RUN for EWS/FLI construct localization in knock-down/rescue cells (EF = iEF + EF; EF DBD = iEF + EF DBD; EF DBD + = iEF + EF DBD+) when compared to cells that did not contain a rescue construct (iEF + Empty Vector) (adjusted p-value (FDR) < 0.05; N = 2 biological replicates each). The number of peaks overlapping between constructs are indicated on the Venn diagram. FH Representative CUT&RUN peak tracks from IGV are shown for iEF + Empty Vector (EF KD), EF, EF DBD, and EF DBD+ samples. Examples of peaks from EWS/FLI-associated HA-site regulated genes ([F] STEAP1 and [G] BIRC2) and GGAA-μSat-regulated genes ([H] GSTM4) are highlighted. Peak track scales are shown on the right.
Fig. 4
Fig. 4. EWS/FLI-driven transcriptional regulation diminished by FLI DBD flanking deletions in Ewing sarcoma cells.
AB Venn diagram analysis of RNA-sequencing data comparing genes significantly A activated or B repressed in A673 cells rescued with the indicated constructs (full-length EWS/FLI [EF], EF DBD, and EF DBD+) when compared to A673 cells with no exogenous EWS/FLI construct (iEF + Empty Vector) (adjusted p-value (FDR) < 0.05; N = 3 biological replicates each). CD GSEA analysis comparing all genes regulated by EF DBD+ as the rank-ordered gene list to a gene set of C genes activated by EF DBD (log2(FC) > 1.5, FDR < 0.05) or D genes repressed by EF DBD (log2(FC) < −1.5, FDR < 0.05) as the gene set. E Genes significantly activated by endogenous EWS/FLI were defined using a previous RNA-sequencing dataset [32]. Genes activated by EF, EF DBD, and EF DBD+ in A673 knock-down/rescue cells were compared to this list of EWS/FLI-activated genes. Scatterplots comparing genes activated by EF (on the x-axis) to EF DBD+ (left) or EF DBD (right) (on the y-axis) were plotted to determine the ability of these constructs to rescue expression these genes. Significance was defined by a log2(FC) > 0 and an adjusted p-value < 0.05. Pearson correlation coefficient and associated p-values with slope are noted on the plots. Pie charts represent the proportion of genes found in each of the described groups.
Fig. 5
Fig. 5. Chromatin-opening ability of EWS/FLI is unaltered by deletions flanking the FLI DNA-binding domain.
A All EWS/FLI-bound loci in A673 cells (determined by CUT&RUN of knock-down/rescue cells expressing full-length EWS/FLI [EF]) were compared to loci harboring ATAC signal peaks and shown in graphical format (ATAC performed on N = 2 biological replicates each). There were 12 482 EF-bound peaks with ATAC signal and 696 EF-bound peaks without ATAC signal. B Venn diagram analysis of regions bound by EF DBD+ and/or EF DBD that also had overlapping ATAC signals. CD Representative tracks of RNA-sequencing, CUT&RUN genomic localization, and ATAC-sequencing signals for the indicated knock-down/rescue A673 cells (EF KD = iEF + EF; EF DBD = iEF + EF DBD; EF DBD + = iEF + EF DBD+). Scales to view tracks were kept consistent across sequencing type in each panel and are represented on the right. Representative genes PPP1R1A (C) and STEAP1 (D) are regulated by EF DBD+ but not EF DBD (adjusted p-value < 0.05) and overlapping CUT&RUN and ATAC-sequencing peaks are highlighted.
Fig. 6
Fig. 6. The carboxyl-terminal amino acids flanking the FLI DNA-binding domain are essential for EWS/FLI-mediated oncogenic transformation.
A Protein schematics of 3xFLAG-tagged (3 F) EWS/FLI constructs: EF, EF DBD and EF DBD+ are described in Fig. 2. EF DBD+ ΔN represents an EWS/FLI mutant where EWS is fused to the DBD+ version of FLI missing the 7amino-terminal amino acids to the DNA-binding domain; EF DBD+ ΔC represents an EWS/FLI mutant where EWS is fused to the DBD+ version of FLI missing the 10 carboxyl-terminal amino acids to the DNA-binding domain. B Western blot analysis of constructs expressed in A673 cells using our knock-down/rescue system. C Venn diagram overlap analysis of RNA-sequencing results (N = 3 biological replicates each). Overlap depicts genes called as significantly regulated by the listed construct compared to control cells (iEF + Empty Vector Cells). Genes were called as significantly regulated using an FDR cut-off of 0.05 (p-value of overlap < 2.2e−16). D Soft agar assay colony formation quantification of A673 knock-down/rescue cells containing the listed knock-down and rescue constructs. Data represented by mean ± SEM (N = 3 biological replicates with 2 technical replicates each). Asterisks indicate p-value < 0.05 as compared to negative control iEF + Empty Vector sample with no EWS/FLI expression.

References

    1. Longhi A, Ferrari S, Tamburini A, Luksch R, Fagioli F, Bacci G, et al. Late effects of chemotherapy and radiotherapy in osteosarcoma and Ewing sarcoma patients: the Italian Sarcoma Group Experience (1983-2006) Cancer. 2012;118:5050–9. doi: 10.1002/cncr.27493. - DOI - PubMed
    1. Delattre O, Zucman J, Plougastel B, Desmaze C, Melot T, Peter M, et al. Gene fusion with an ETS DNA-binding domain caused by chromosome translocation in human tumours. Nature. 1992;359:162–5. doi: 10.1038/359162a0. - DOI - PubMed
    1. Zucman J, Melot T, Desmaze C, Ghysdael J, Plougastel B, Peter M, et al. Combinatorial generation of variable fusion proteins in the Ewing family of tumours. EMBO J. 1993;12:4481–7. doi: 10.1002/j.1460-2075.1993.tb06137.x. - DOI - PMC - PubMed
    1. Bailly RA, Bosselut R, Zucman J, Cormier F, Delattre O, Roussel M, et al. DNA-binding and transcriptional activation properties of the EWS-FLI-1 fusion protein resulting from the t(11;22) translocation in Ewing sarcoma. Mol Cell Biol. 1994;14:3230–41. - PMC - PubMed
    1. Aurias A, Rimbaut C, Buffe D, Dubousset J, Mazabraud A. [Translocation of chromosome 22 in Ewing’s sarcoma] C R Seances Acad Sci III. 1983;296:1105–7. - PubMed

MeSH terms