Review
. 2021 Oct;22(10):627-644.
doi: 10.1038/s41576-021-00370-8. Epub 2021 Jun 18.

Integrating single-cell and spatial transcriptomics to elucidate intercellular tissue dynamics

Affiliations
Review

Integrating single-cell and spatial transcriptomics to elucidate intercellular tissue dynamics

Sophia K Longo et al. Nat Rev Genet. 2021 Oct.

Abstract

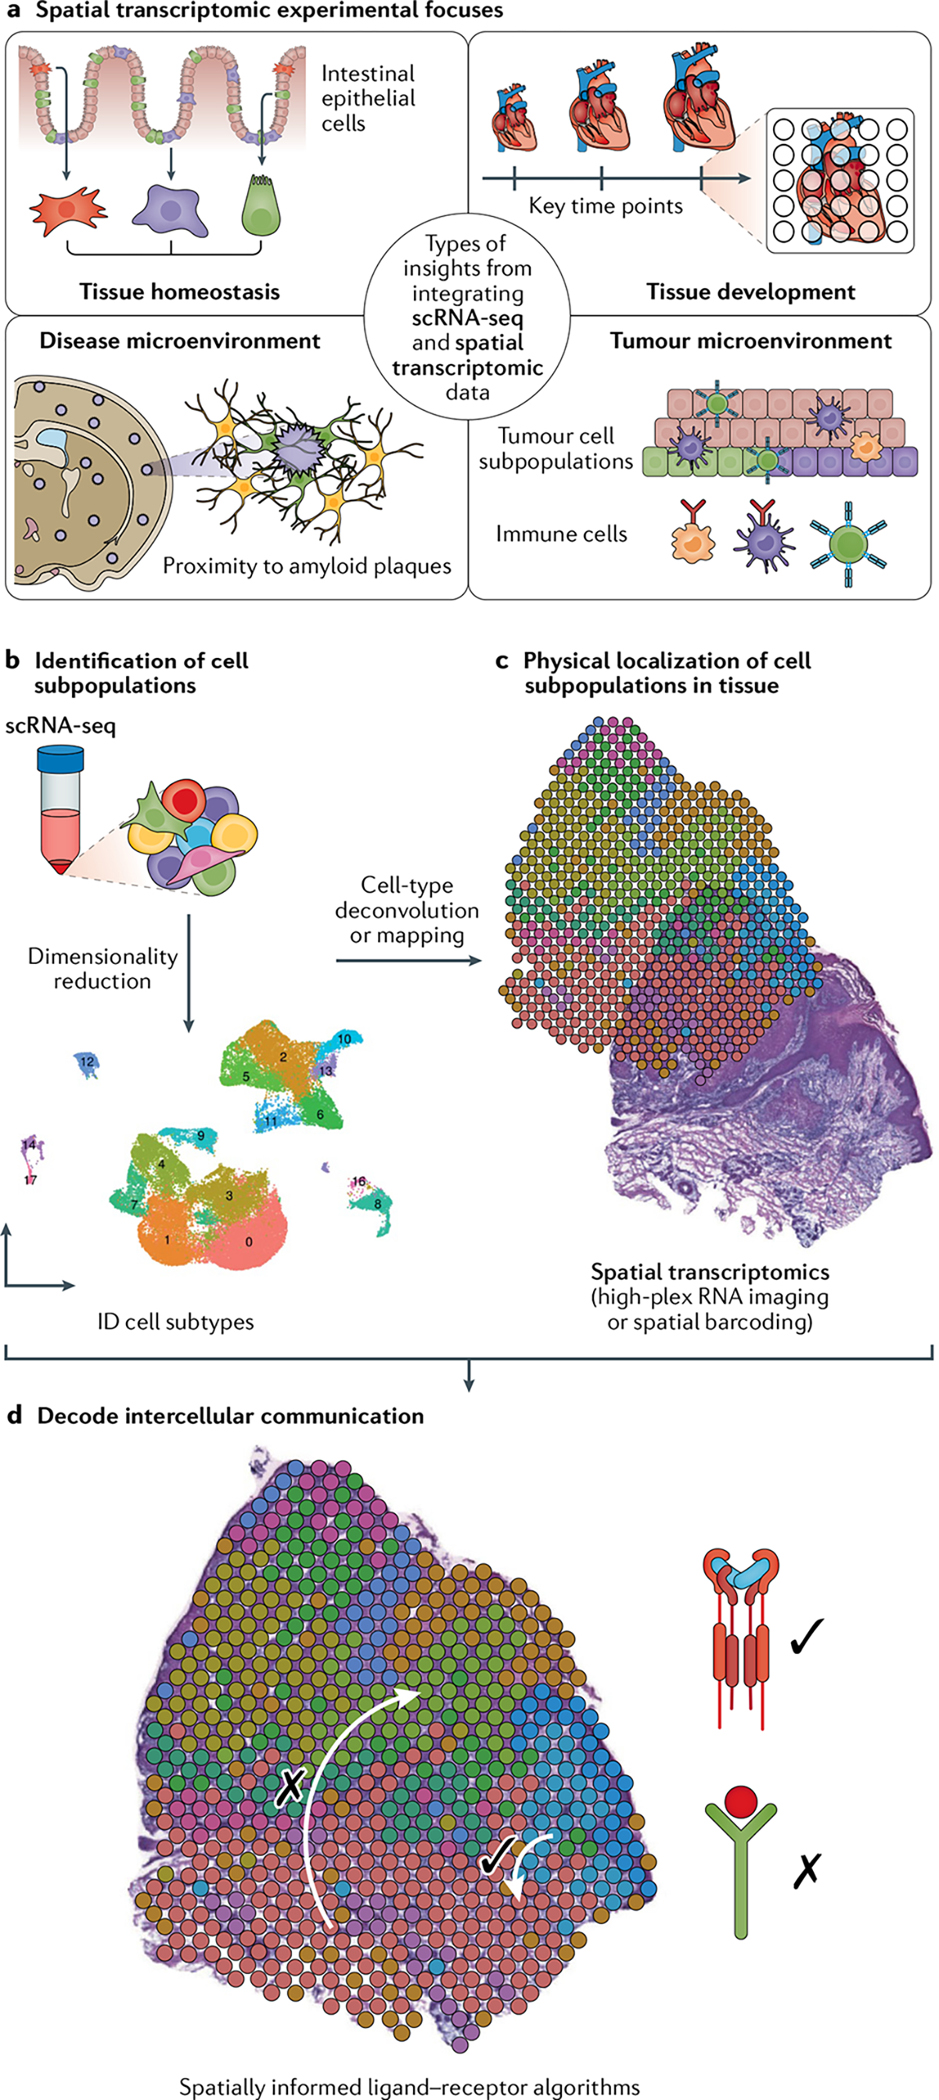
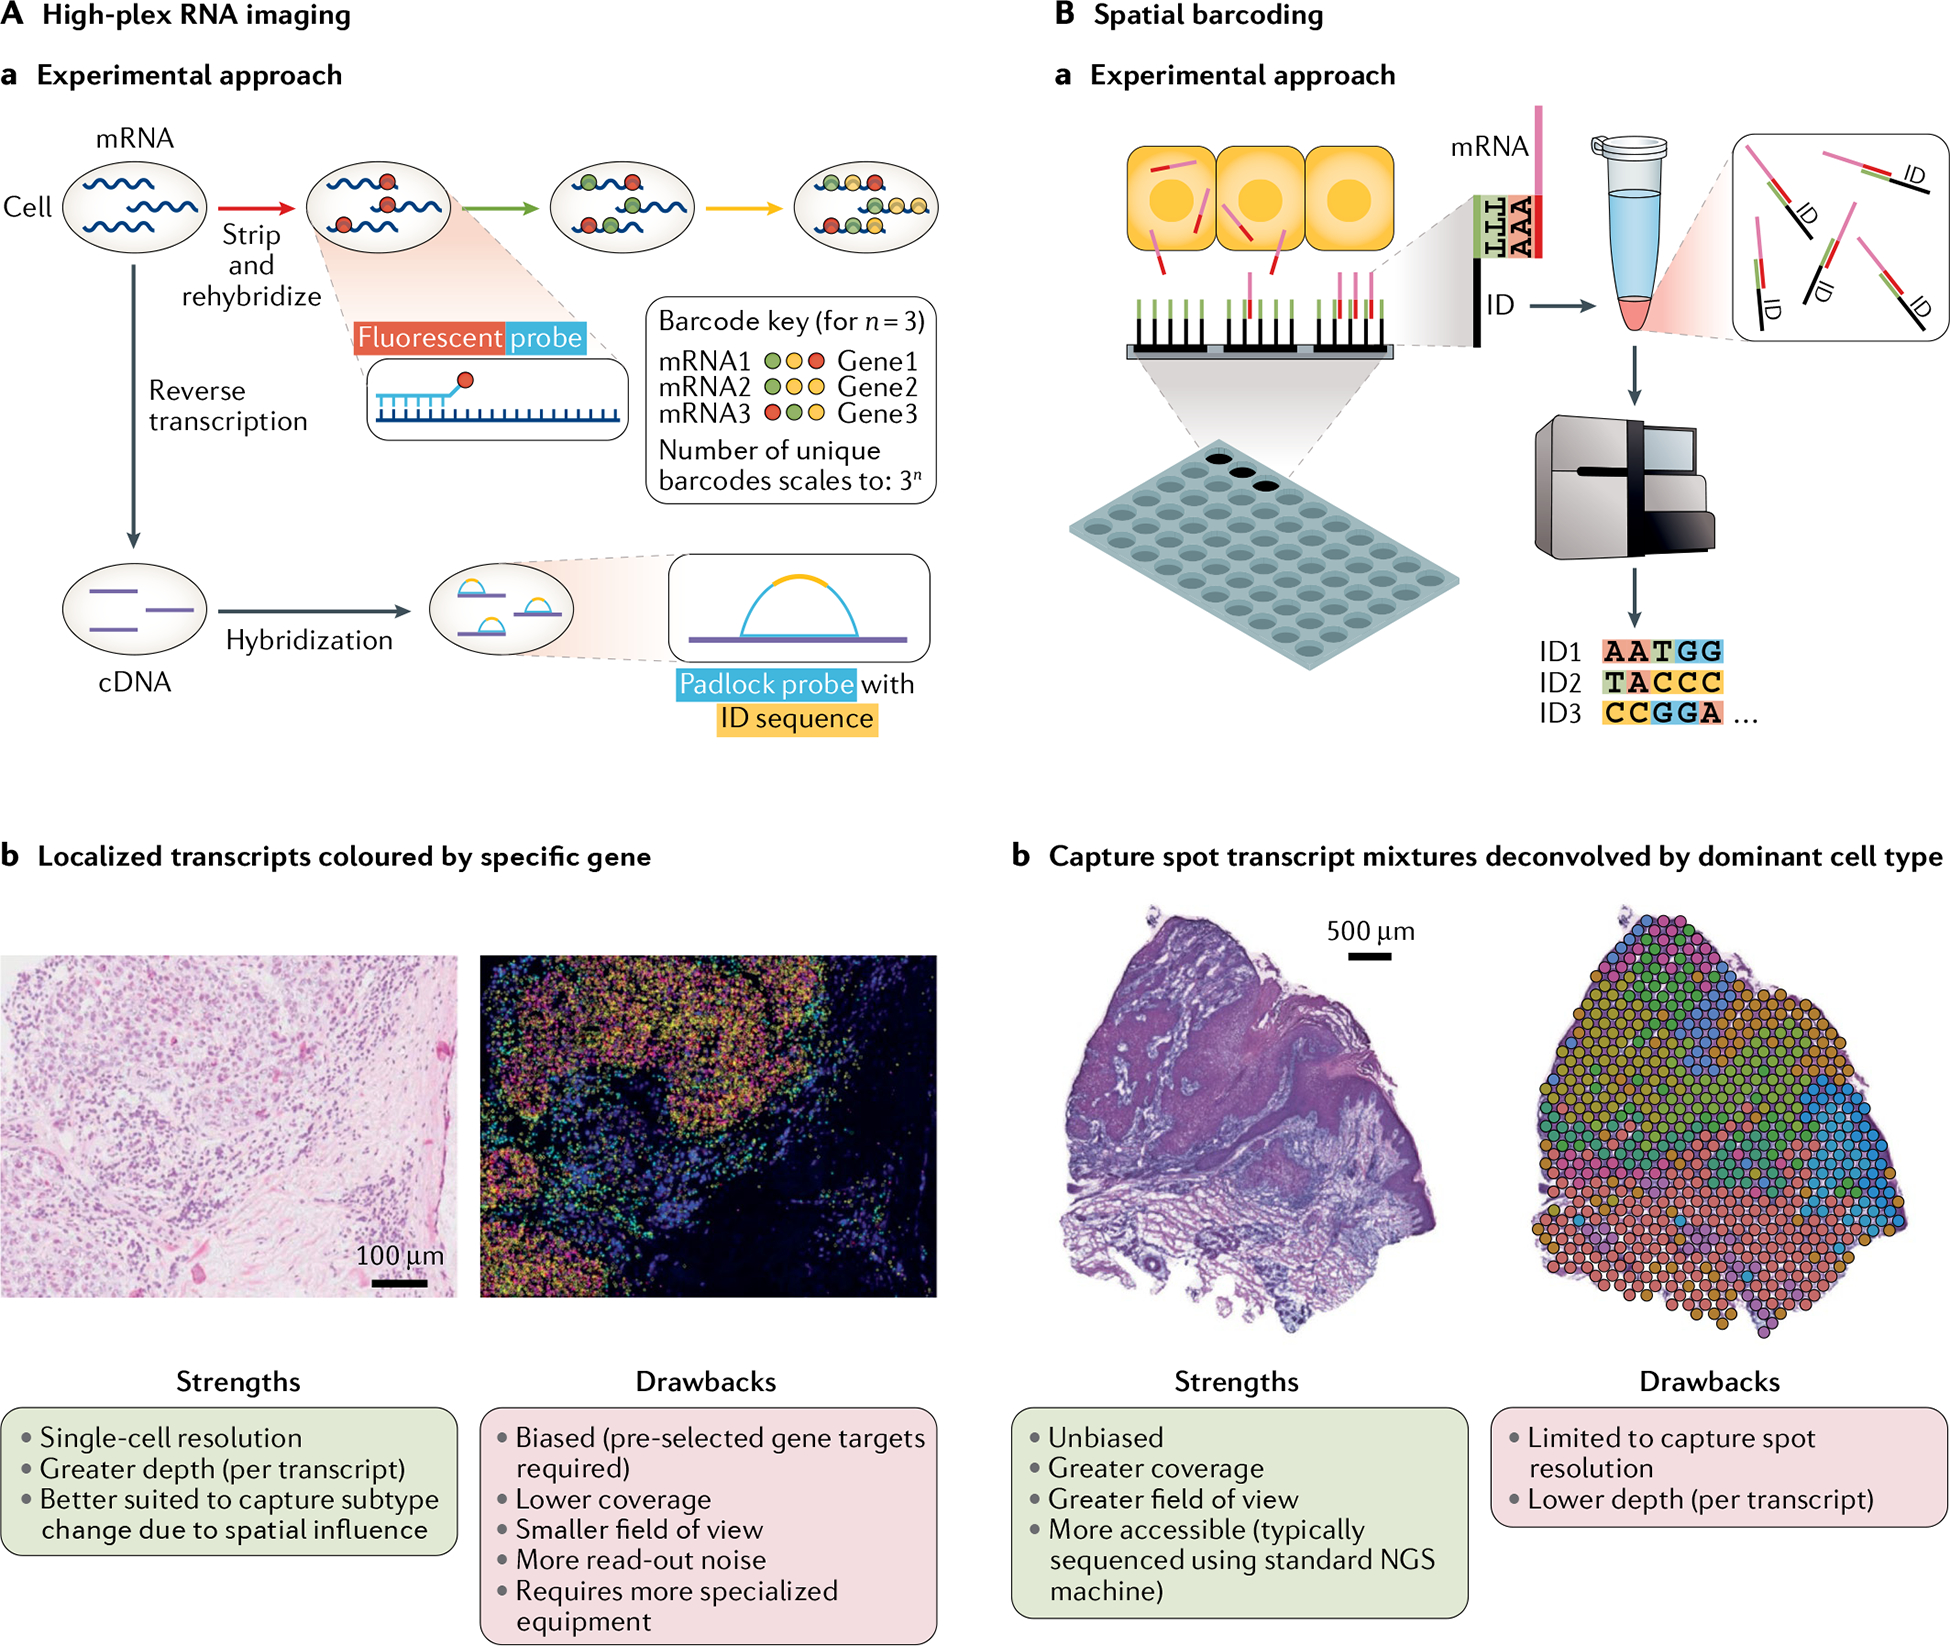
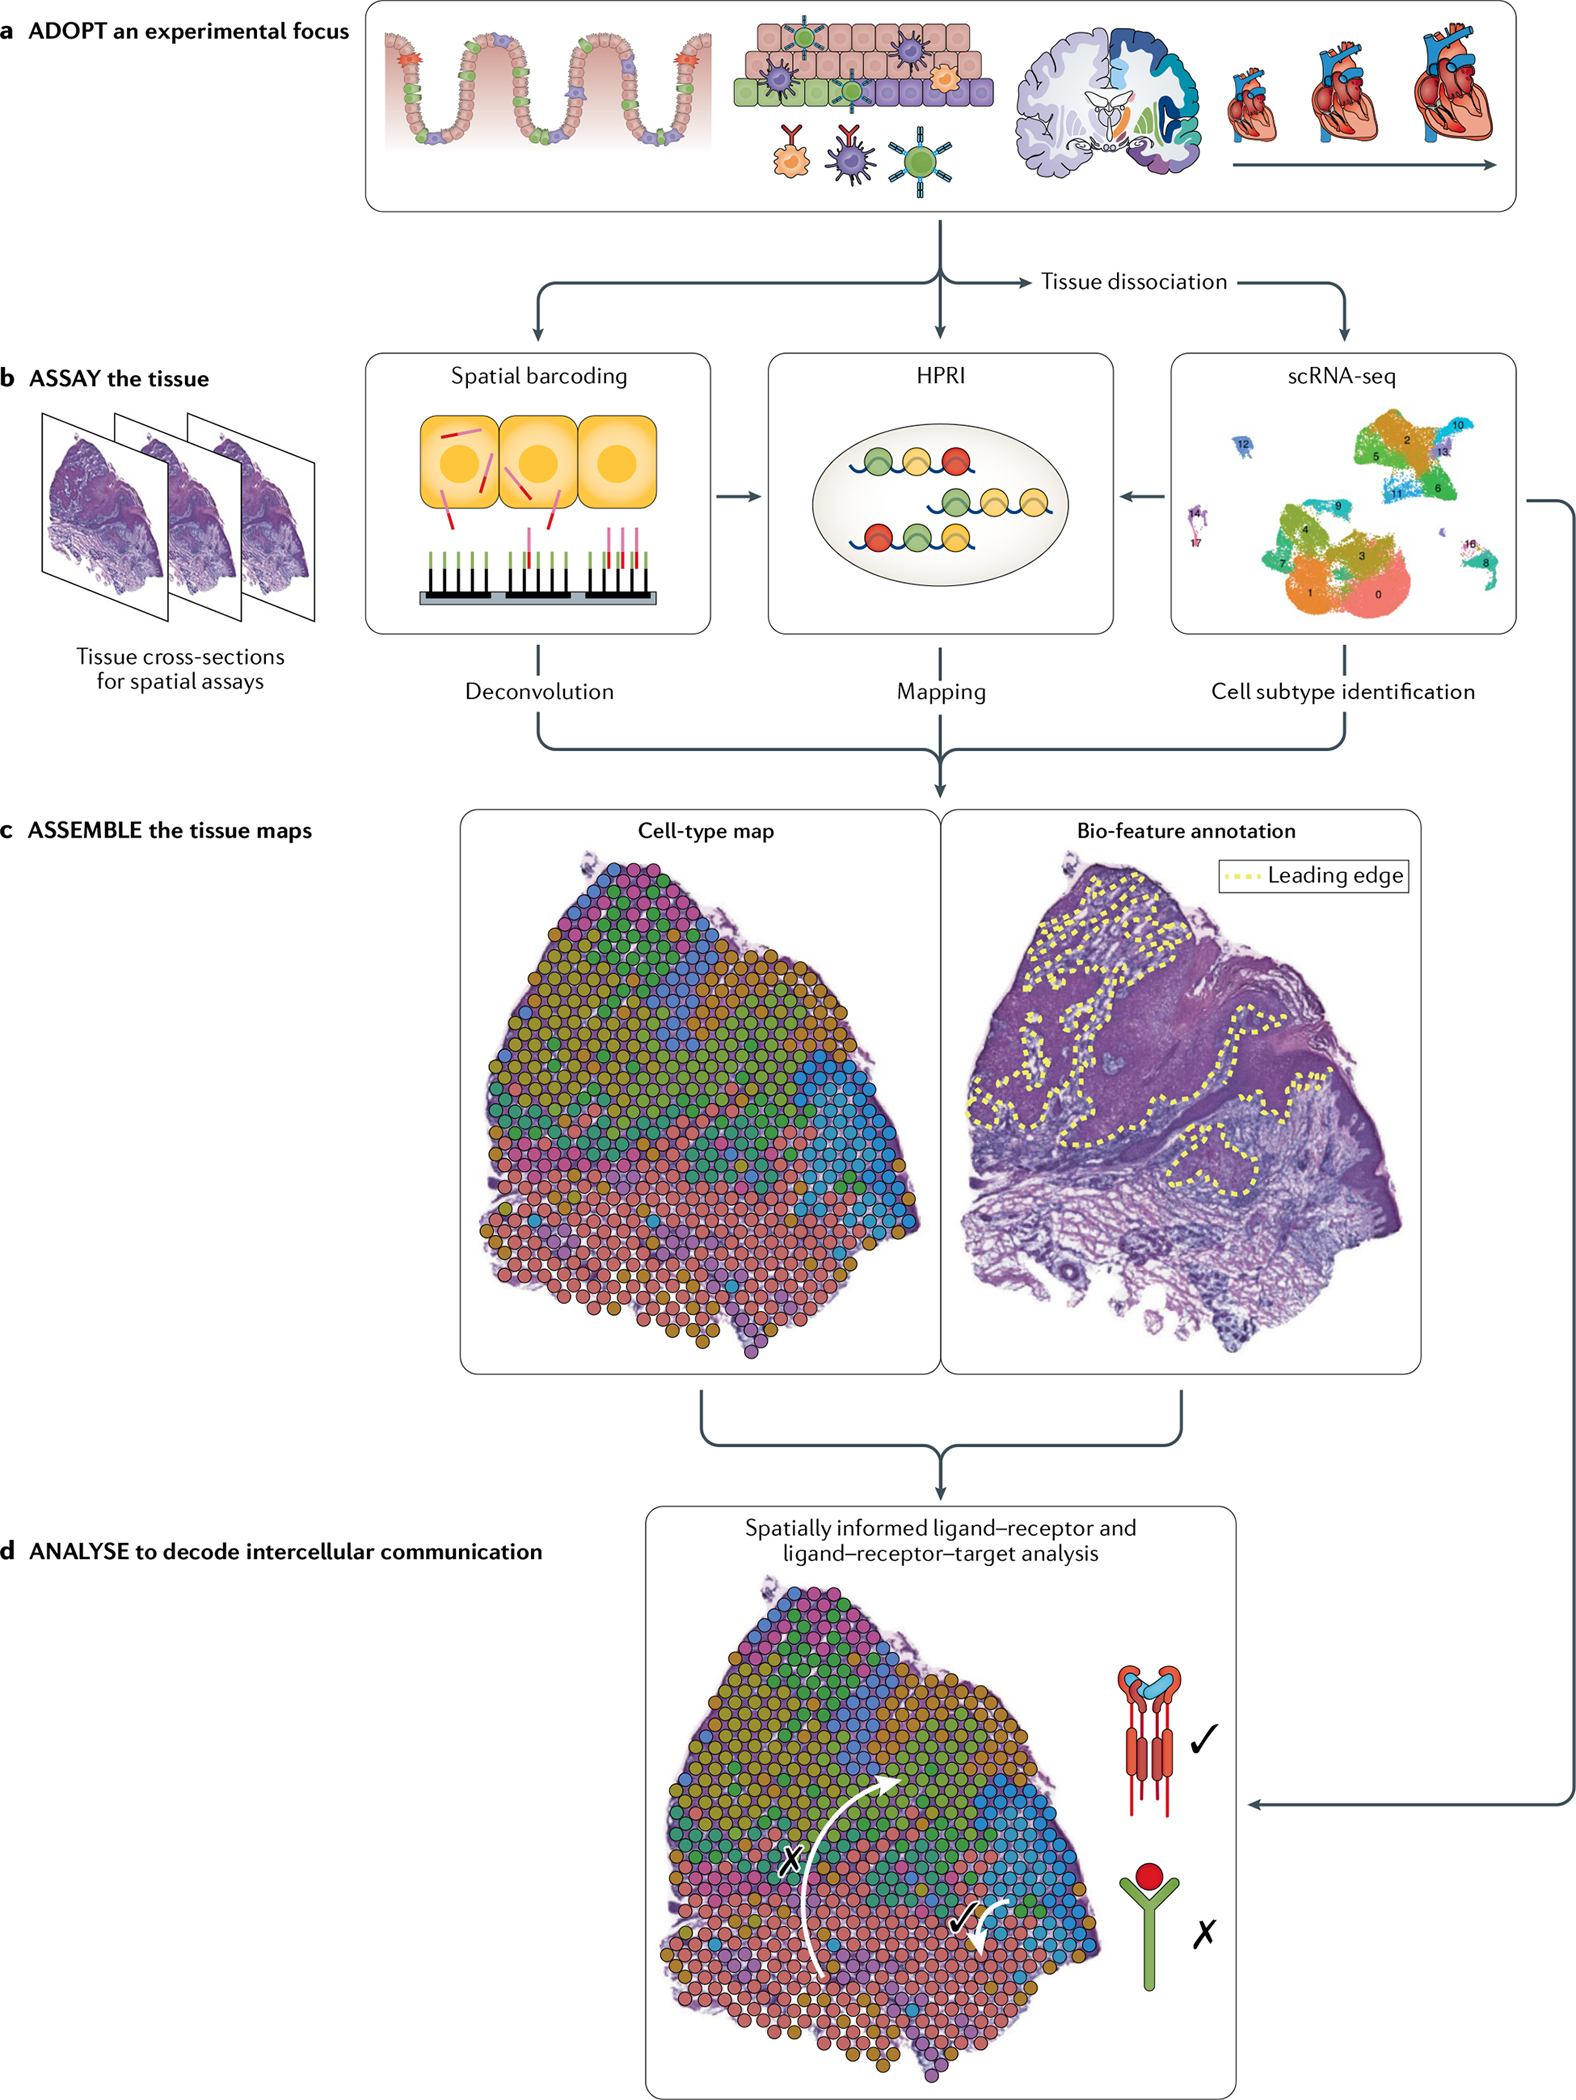
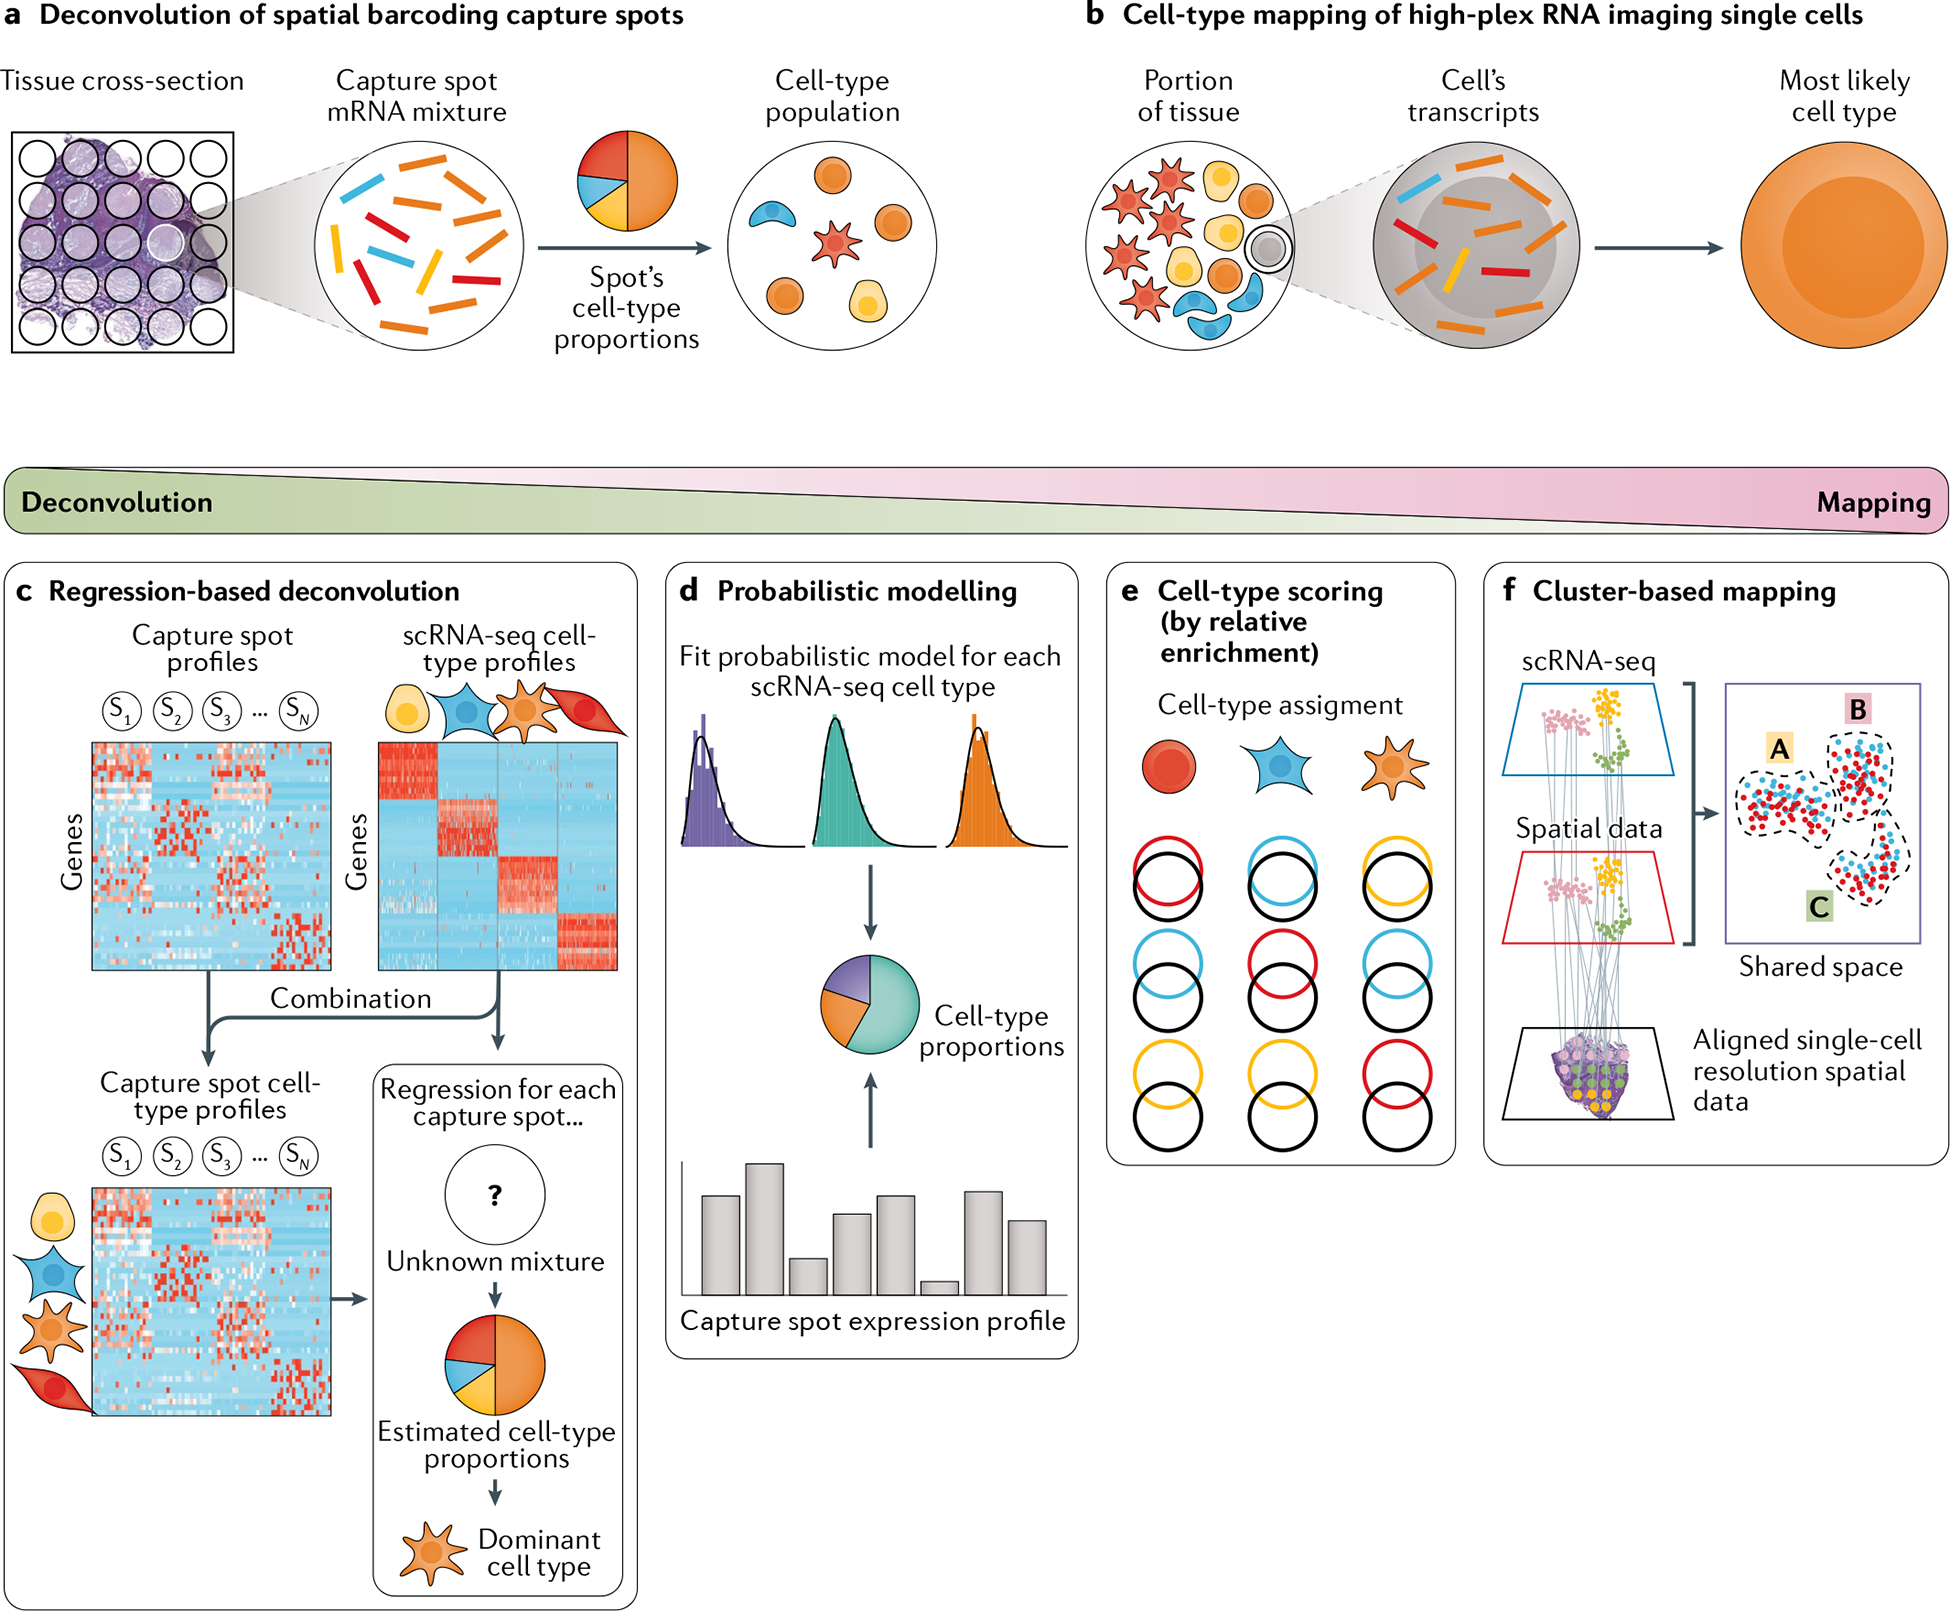
Single-cell RNA sequencing (scRNA-seq) identifies cell subpopulations within tissue but does not capture their spatial distribution nor reveal local networks of intercellular communication acting in situ. A suite of recently developed techniques that localize RNA within tissue, including multiplexed in situ hybridization and in situ sequencing (here defined as high-plex RNA imaging) and spatial barcoding, can help address this issue. However, no method currently provides as complete a scope of the transcriptome as does scRNA-seq, underscoring the need for approaches to integrate single-cell and spatial data. Here, we review efforts to integrate scRNA-seq with spatial transcriptomics, including emerging integrative computational methods, and propose ways to effectively combine current methodologies.


Conflict of interest statement

Competing interests

The authors declare no competing interests.

Figures

Fig. 1 |
Fig. 1 |. Adding spatial information to transcriptomes: integration of single-cell and spatial transcriptomics data.
a | ‘Tissue homeostasis’ refers to elucidating spatial division of discrete cellular subtypes in a healthy tissue at a singular time point, for example, in the intestinal epithelium. ‘Tissue development’ refers to the study of how the spatial transcriptome changes in tissue at key stages in the development of a tissue. ‘Disease microenvironment’ refers to elucidating the spatial transcriptome in diseased and injured tissue niches with an eye towards proximity to relevant biological features, for example, proximity to amyloid plaques in brain tissue of patients with Alzheimer disease. ‘Tumour microenvironment’ refers to the study of spatial architecture of tumours and their interface with other cell subtypes in their environment. b | Workflows combining single-cell RNA sequencing (scRNA-seq) and spatial transcriptomic techniques begin by establishing cell subtypes typically through dimensionality reduction and clustering of scRNA-seq data. c | Deconvolution and mapping are used to localize cell subpopulations. Deconvolution is typically applied to spatial barcoding data, and mapping is typically applied to single-cell resolution spatial data (that is, high-plex RNA imaging (HPRI) data) to localize scRNA-seq subpopulations. d | Algorithms that evaluate spatial arrangement of localized subpopulations can further assess ligand–receptor interactions predicted from scRNA-seq data. Figure component in parts c and d adapted from REF., CC BY 4.0 (https://creativecommons.org/licenses/by/4.0/).
Fig. 2 |
Fig. 2 |. Common spatial transcriptomics techniques.
Aa | High-plex RNA imaging (HPRI) methods localize mRNA transcripts through probes that target specific genes. Fluorescent probe methods typically employ an encoding scheme whereby each gene can be identified through a unique sequence of fluorescent probe signals obtained through multiple rounds of hybridization. Padlock probe methods typically use probes that target the complementary DNA (cDNA) of target genes. Each probe has an identification (ID) sequence of nucleotides specific to each gene. The strategy for fluororescent sequencing of this ID varies by method. Ab | HPRI map of human breast cancer tissue cross-section with mRNA transcripts decoded based on gene fluorescent signals (not yet annotated by cell type, which can be done through mapping). Left: associated haematoxylin and eosin (H&E) stain (scale bar = 100 μm). Strengths and drawbacks of HPRI methods are listed. Pre-selected gene target panels typically range from 100 to 200 genes for intact tissue sections (proof-of-concept literature indicates an ~10,000 gene limit in tissue culture that is not easily scaled to intact tissue), and for some well-established methods only long RNA species (greater than 1,000 nucleotides) can be included. More specialized equipment typically makes for a more labour-intensive workflow. Ba | Spatial barcoding uses spatially barcoded (ID = location barcode) poly-T oligonucleotide capture of mRNA transcripts across tissue cross-sections followed by detachment and deep sequencing. Following sequencing, each transcript is de-multiplexed for assignment to its capture spot of origin based on its ID. Bb | Spatial barcoding map of human squamous cell carcinoma cross-section with capture spot mRNA mixtures deconvolved by cell type. Left: associated H&E stain (scale bar = 500 μm). Strengths and drawbacks of spatial barcoding methods are listed. Unbiased refers to the fact that the method does not involve selection of target genes. Greater accessibility also comes from the commercialization of spatial barcoding methods. NGS, next-generation sequencing. Part Ab reprinted from REF., Springer Nature Limited.
Fig. 3 |
Fig. 3 |. Model workflow integrating scRNA-seq and spatial transcriptomics: the four As.
a | Adopt a rationale for assessing the spatial transcriptome in a particular tissue type. Common applications are depicted in FIG. 1a. b | Assay using single-cell RNA sequencing (scRNA-seq) to identify discrete cell subpopulations in a given tissue, and then with spatial barcoding to ascertain their physical locations in situ. Given their unbiased nature, scRNA-seq and spatial barcoding can help identify optimal gene panels for high-plex RNA imaging (HPRI) studies. Additional genes of interest for HPRI studies can be obtained by algorithms that identify spatially differentially expressed genes, and through literature research. c | Assemble maps that localize specific cell subtypes spatially within the tissue. For spatial barcoding data, deconvolution can be used to localize cell types. For HPRI data, mapping can be used to localize cell types. Matched histology images can be annotated for landmarks of interest such as the tumour leading edge to further inform spatial analysis. d | Analyse assembled cell-type maps to nominate the cell types, tissue niches and ligand–receptor interactions involved in intercellular communication that drive the tissue phenotype. Figure component used in parts b and c adapted from REF., CC BY 4.0 (https://creativecommons.org/licenses/by/4.0/).
Fig. 4 |
Fig. 4 |. Deconvolution and mapping methods.
Computational approaches that localize cellular subtypes through integration of single-cell and spatial transcriptomics data. As spatial transcriptomics can only measure a fraction of the genes compared with single-cell RNA sequencing (scRNA-seq), deconvolving and mapping scRNA-seq-based cell types enriches spatial transcriptomics cell-type tissue maps. a | For spatial barcoding data, cell subpopulations can be localized by deconvolving the mixture of mRNA transcripts from each capture spot to predict the proportions of each cell type from the mixture of cells at each spot. b | For high-plex RNA imaging (HPRI) data, cell subpopulations can be localized by mapping scRNA-seq-based cell types onto each spatially resolved cell. Deconvolution and mapping methods to characterize spatial transcriptomics data using scRNA-seq cell subtypes exist on a weighted spectrum as each type of method can theoretically be applied to elucidate the subtype composition for both capture spots and single-cell transcript mixtures. Statistical regression (left) is most commonly applied to capture spot deconvolution and cluster-based mapping methods mostly towards HPRI cell-type mapping. c | Regression-based deconvolution combines scRNA-seq data clustered by cell type with capture spot data to yield a matrix containing capture spot profiles with scRNA-seq cell subtypes overlaid. Regression is used to find the scRNA-seq subtype profiles that best explain each capture spot mixture. d | Probabilistic distribution models are fitted to scRNA-seq transcript distributions for each cell type, with each capture spot characterized by determining the degree to which each cell type fits that spot’s transcript distribution. e | Cell-type scoring assigns cell types to single cells or capture spots based on overlap of spatial gene expression (black circles) with the marker genes for each cell type (coloured circles). f | Cluster-based mapping involves integrating scRNA-seq data (blue plot) and single-cell resolution spatial data (red plot) into a shared low-dimensional space (purple plot) whose clusters represent scRNA-seq cell types correspondening to spatial assay cell types. Tissue cross-section in part a adapted from REF., CC BY 4.0 (https://creativecommons.org/licenses/by/4.0). Parameter estimation distribution graphs in part d adapted from REF., CC BY 4.0 (https://creativecommons.org/licenses/by/4.0/). Part f adapted from REF., CC BY 4.0 (https://creativecommons.org/licenses/by/4.0/).
Fig. 5 |
Fig. 5 |. Principles used to decode mechanisms of intercellular communication via expression of ligands and receptors in physically proximal cell subpopulations.
In a given tissue niche, cell subpopulations are more likely to be in communication if they are spatially proximal to each other (part A) and exhibit appropriate target gene signatures in signal-receiving cells (part B). A | Communicative cell types are established by evaluating co-localization to a given capture spot and/or expression of cell types in adjacent capture spots or cells. B | To account for longer-range communicative cell types that might be missed by the aforementioned strategies, the SpaOTsc algorithm predicts the maximum communication range for a given ligand–receptor pair through ligand–receptor target gene co-expression. Whereas ligand–receptor and ligand–receptor–target co-expression restriction can be used to establish intercellular communications from single-cell RNA sequencing (scRNA-seq) data alone, the spatial context can enhance this analysis by predicting maximum communication ranges and may disprove communications if the distance between the pairs is much farther than expected based on typical ranges recorded in the literature. Tissue cross-section adapted from REF., CC BY 4.0 (https://creativecommons.org/licenses/by/4.0/).

Similar articles

Cited by

References

    1. [No authors listed] Method of the Year 2020: spatially resolved transcriptomics. Nat. Methods 18, 1 (2021). - PubMed
    1. Stegle O, Teichmann S & Marioni J Computational and analytical challenges in single-cell transcriptomics. Nat. Rev. Genet. 16, 133–145 (2015). - PubMed
    1. Tang F et al. mRNA-seq whole-transcriptome analysis of a single cell. Nat. Methods 6, 377–382 (2009). - PubMed
    1. Chen G, Ning B & Shi T Single-cell RNA-seq technologies and related computational data analysis. Front. Genet. 10, 317 (2019). - PMC - PubMed
    1. van den Brink SC et al. Single-cell sequencing reveals dissociation-induced gene expression in tissue subpopulations. Nat. Methods 14, 935–936 (2017). - PubMed

Publication types