. 2021 Oct 1;162(10):bqab118.
doi: 10.1210/endocr/bqab118.

Intestinal Flora is a Key Factor in Insulin Resistance and Contributes to the Development of Polycystic Ovary Syndrome

Affiliations

Intestinal Flora is a Key Factor in Insulin Resistance and Contributes to the Development of Polycystic Ovary Syndrome

Yue-Lian Yang et al. Endocrinology. .

Abstract

Context: The key gut microbial biomarkers for polycystic ovarian syndrome (PCOS) and how dysbiosis causes insulin resistance and PCOS remain unclear.

Objective: To assess the characteristics of intestinal flora in PCOS and explore whether abnormal intestinal flora can affect insulin resistance and promote PCOS and whether chenodeoxycholic acid (CDCA) can activate intestinal farnesoid X receptor (FXR), improving glucose metabolism in PCOS.

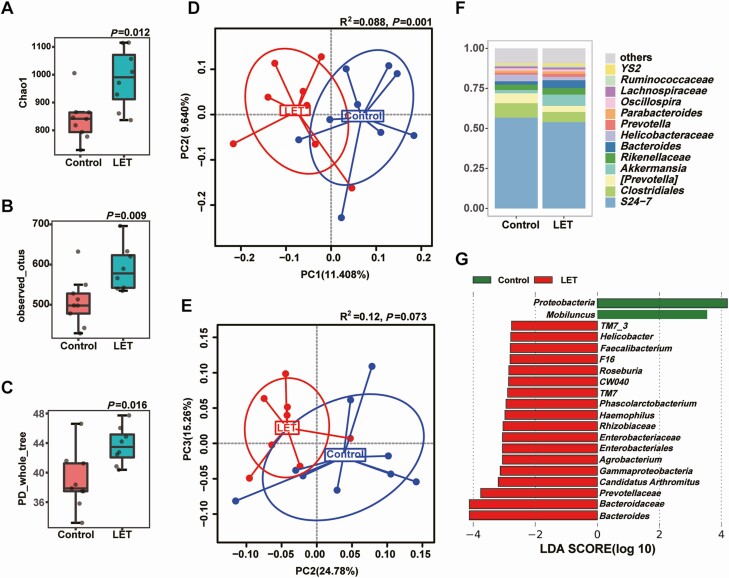
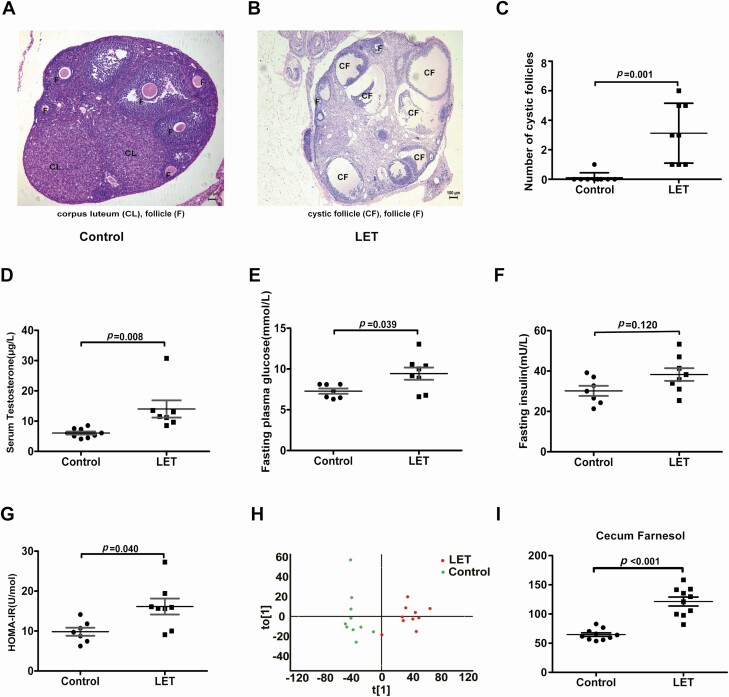
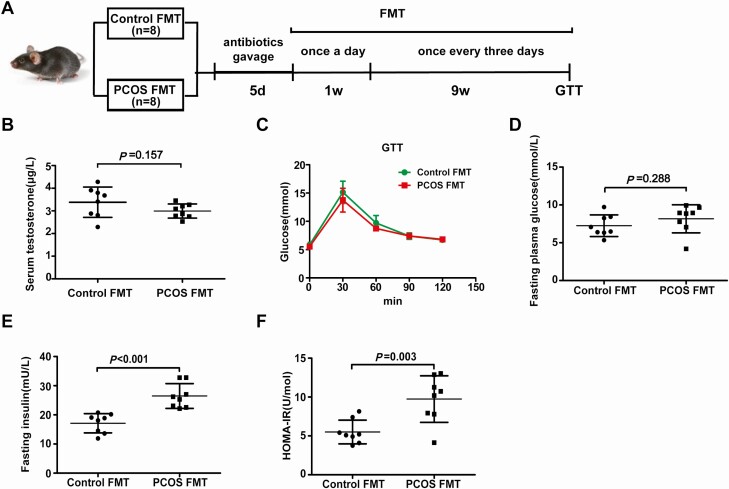
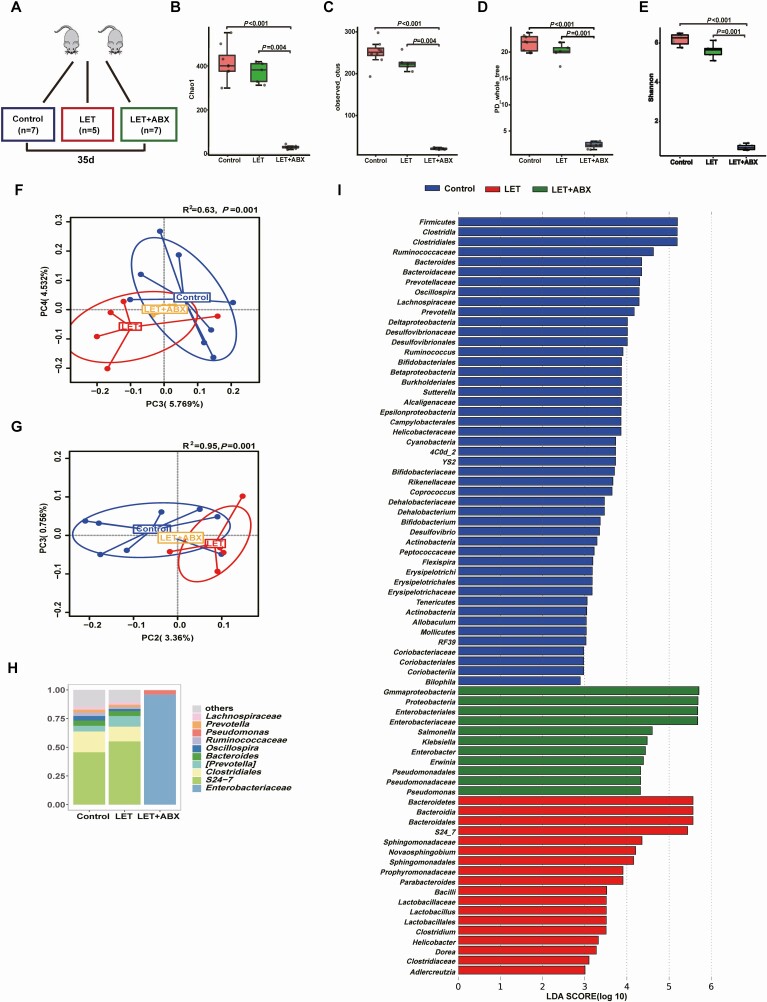
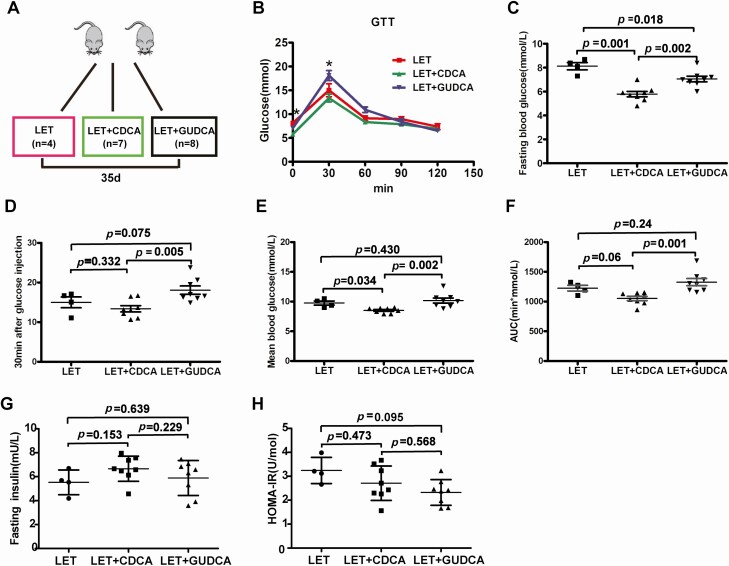
Setting and design: The intestinal flora of treatment-naïve PCOS patients and hormonally healthy controls was analyzed. Phenotype analysis, intestinal flora analysis, and global metabolomic profiling of caecal contents were performed on a letrozole-induced PCOS mouse model; similar analyses were conducted after 35 days of antibiotic treatment on the PCOS mouse model, and glucose tolerance testing was performed on the PCOS mouse model after a 35-day CDCA treatment. Mice receiving fecal microbiota transplants from PCOS patients or healthy controls were evaluated after 10 weeks.

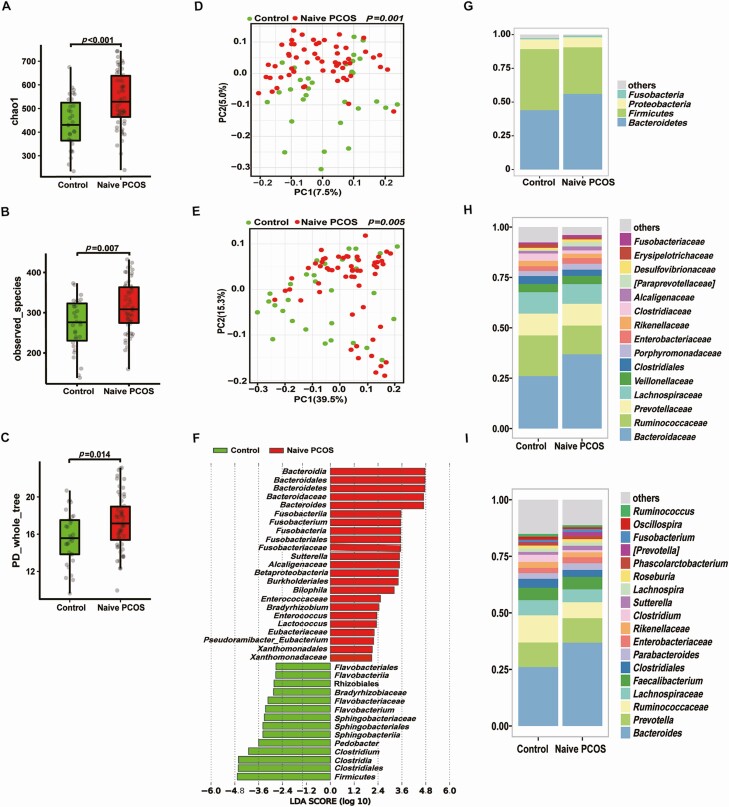
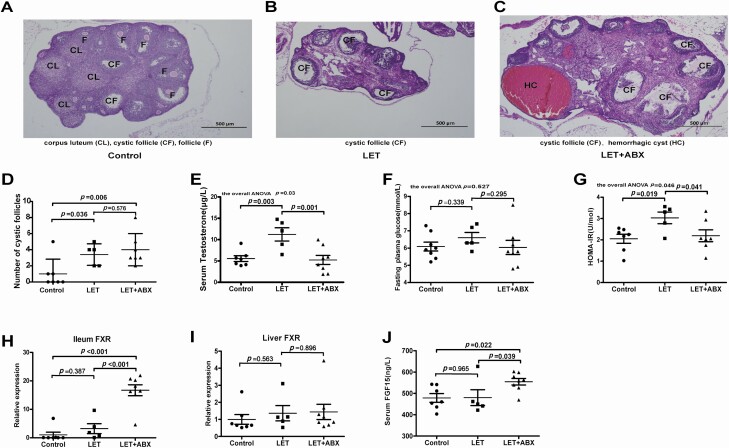
Results: Bacteroides was significantly enriched in treatment-naïve PCOS patients. The enrichment in Bacteroides was reproduced in the PCOS mouse model. Gut microbiota removal ameliorated the PCOS phenotype and insulin resistance and increased relative FXR mRNA levels in the ileum and serum fibroblast growth factor 15 levels. PCOS stool-transplanted mice exhibited insulin resistance at 10 weeks but not PCOS. Treating the PCOS mouse model with CDCA improved glucose metabolism.

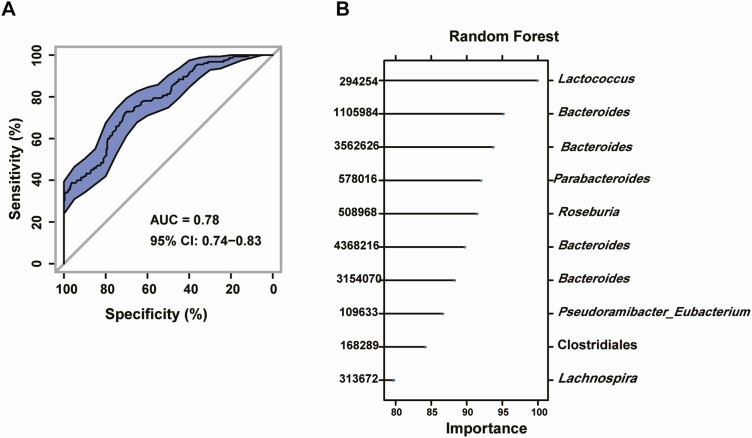
Conclusions: Bacteroides is a key microbial biomarker in PCOS and shows diagnostic value. Gut dysbiosis can cause insulin resistance. FXR activation might play a beneficial rather than detrimental role in glucose metabolism in PCOS.

Keywords: FXR; PCOS; insulin resistance; intestinal flora.


Figures

Figure 1.
Figure 1.
Characteristics of the gut microbiota in individuals with PCOS. Comparison of the stool microbiome of women with treatment-naïve PCOS with that of healthy controls (treatment-naïve PCOS patients: 56; controls: 31). (A-C) α-diversity of the microbiota in the feces. Data are presented as the mean ± SEM, P < 0.05, Wilcoxon rank-sum test. (D, E) Two-dimensional plot of PCoA for the microbiota. (F) Differentially abundant taxa identified using LEfSe analysis, P < 0.05, Kruskal-Wallis rank sum test. (G-I) The gut microbiota average relative abundance of predominant bacterial taxa at the phylum, family, and genus levels. PCoA, principal coordinate analysis; PCOS, polycystic ovarian syndrome.
Figure 2.
Figure 2.
The gut microbiota signature can be used to discriminate between treatment-naïve PCOS patients and healthy controls. A random forest model based on the intestinal flora of treatment-naïve PCOS patients and healthy controls was used to explore the potential ability of the intestinal flora to identify treatment-naïve PCOS patients (treatment-naïve PCOS patients: 56; controls: 31). (A) A random forest model assessed using receiver operating characteristic analysis (area under the curve [AUC] = 0.78). (B) The top 10 OTUs with the potential to identify treatment-naïve PCOS patients. OTU, operational taxonomic unit; PCOS, polycystic ovarian syndrome.
Figure 3.
Figure 3.
Characteristics of the gut microbiota in PCOS model mice. Comparison of the stool microbiome between letrozole (LET)-induced PCOS model mice and controls (PCOS model mice: 8; controls: 9). (A-C) α-diversity of the microbiota in the feces. Data are presented as the mean ± SEM, P < 0.05, Wilcoxon rank-sum test. (D, E) Two-dimensional plot of PCoA for the microbiota. (F) The gut microbiota average relative abundance of the predominant bacterial taxa at the genus level. (G) Differentially abundant taxa identified using LEfSe analysis, P < 0.05, Kruskal-Wallis rank sum test. PCoA, principal coordinate analysis; PCOS, polycystic ovarian syndrome; SEM, standard error of the mean.
Figure 4.
Figure 4.
Insulin resistance and cecum farnesol are increased in PCOS model mice. Comparing the phenotype and cecal contents by global metabolomics between letrozole (LET)-induced PCOS model mice and controls (PCOS model mice: 8; controls: 9). (A, B) Hematoxylin and eosin staining of ovaries, corpus luteum (CL), cystic follicle (CF), and follicle (F). (C) Quantitative analysis of cystic follicles. (D) Serum testosterone levels. (E) Fasting blood glucose. (F) Fasting insulin. (G) HOMA-IR. (H) Orthogonal partial least squares-discriminate analysis (OPLS-DA) of cecum content global metabolomics. (I) Cecum farnesol. (C-I) P values were determined by 2-tailed Student t test, and P < 0.05 was considered statistically significant. HOMA-IR, homeostasis model assessment for insulin resistance index; PCOS, polycystic ovarian syndrome.
Figure 5.
Figure 5.
Effects of PCOS fecal microbiota transplantation on the disruption of insulin sensitivity. Mice transplanted with stool suspensions from healthy controls and women with PCOS were defined as the control-FMT and PCOS-FMT groups, respectively. After treatment with an antibiotic cocktail (20 mg/mL vancomycin, 40 mg/mL neomycin sulfate, 40 mg/mL metronidazole, 40 mg/mL ampicillin intragastrically once daily) for 5 days, the mice were orally gavaged with stool suspensions once a day for 1 week and once every 3 days for 9 weeks (control-FMT: 8; PCOS-FMT: 8). (A) Schematic representation of the experimental design. (B) Serum testosterone levels. (C) GTT. (D) Fasting blood glucose. (E) Fasting insulin. (F) HOMA-IR. (B-E) P values were determined by 2-tailed Student t test, and P < 0.05 was considered statistically significant. FMT, fecal microbiota transplantation; GTT, glucose tolerance test; HOMA-IR, homeostasis model assessment for insulin resistance index; PCOS, polycystic ovarian syndrome.
Figure 6.
Figure 6.
Characteristics of the gut microbiota in PCOS mice after treatment with antibiotic cocktails. Intestinal flora analysis of PCOS model mice after antibiotic treatment (20 mg/mL vancomycin, 40 mg/mL neomycin sulfate, 40 mg/mL metronidazole, 40 mg/mL ampicillin intragastrically once daily) removed the intestinal flora for 35 days (control: 7; LET: 5; LET+ABX: 7). (A) Schematic representation of the above experimental design. (B-E) α-diversity of the microbiota in the feces. Data are presented as the mean ± SEM, P < 0.05, Wilcoxon rank-sum test. (F, G) Two-dimensional plot of PCoA for the microbiota. (H) The gut microbiota average relative abundance of the predominant bacterial taxa at the genus level. (I) Differentially abundant taxa identified using LEfSe analysis, P < 0.05, Kruskal-Wallis rank-sum test. ABX, antibiotic treatment; LET, letrozole; PCoA, principal coordinate analysis; PCOS, polycystic ovarian syndrome; SEM, standard error of the mean.
Figure 7.
Figure 7.
Removal of the intestinal flora can improve insulin resistance and suppress the development of PCOS. Phenotype analysis of PCOS model mice after antibiotic treatment (20 mg/mL vancomycin, 40 mg/mL neomycin sulfate, 40 mg/mL metronidazole, 40 mg/mL ampicillin intragastrically once daily) removed the intestinal flora for 35 days (control: 7; LET: 5; LET+ABX: 7). (A-C) Hematoxylin and eosin staining of the ovary, corpus luteum (CL), cystic follicle (CF), and hemorrhagic cyst (HC). (D) Quantitative analysis of cystic follicles. (E) Serum testosterone levels. (F) Fasting blood glucose. (G) HOMA-IR. (H) mRNA levels of ileum FXR. (I) mRNA levels of liver FXR. (J) Serum FGF15 levels. (D-J) P values were determined by 1-way ANOVA for normally distributed data and the Kruskal-Wallis test for nonnormally distributed data. P < 0.05 was considered statistically significant. ABX, antibiotic treatment; FGF15, fibroblast growth factor 15; FXR, farnesoid X receptor; HOMA-IR, homeostasis model assessment for insulin resistance index; LET, letrozole; PCOS, polycystic ovarian syndrome.
Figure 8.
Figure 8.
Intestinal FXR plays an important role in glucose metabolism in PCOS model mice. Mice were divided into 3 groups (LET, LET+CDCA, and LET+GUDCA) and were treated for 35 days to explore the effects of intestinal FXR (LET: 4, LET+CDCA: 7, and LET+GUDCA: 8). (A) Schematic representation of the experimental design. (B) GTT. (C) Fasting blood glucose. (D) Thirty minutes after glucose injection. (E) Mean blood glucose. (F) Area under the curve (AUC) of the GTT. (G) Fasting insulin. (H) HOMA-IR. (B-H) P values were determined by 1-way ANOVA with the least significant difference (LSD) multiple comparison post hoc test. P < 0.05 was considered statistically significant. CDCA, chenodeoxycholic acid; FXR, farnesoid X receptor; GTT, glucose tolerance test; GUDCA, glycoursodeoxycholic acid; HOMA-IR, homeostasis model assessment for insulin resistance index; LET, letrozole; PCOS, polycystic ovarian syndrome.

Comment in

References

    1. Escobar-Morreale HF. Polycystic ovary syndrome: definition, aetiology, diagnosis and treatment. Nat Rev Endocrinol. 2018;14(5):270-284. - PubMed
    1. Jacewicz-Święcka M, Kowalska I. Polycystic ovary syndrome and the risk of cardiometabolic complications in longitudinal studies. Diabetes Metab Res Rev. 2018;34(8):e3054. - PubMed
    1. Spinedi E, Cardinali DP. The polycystic ovary syndrome and the metabolic syndrome: a possible chronobiotic-cytoprotective adjuvant therapy. Int J Endocrinol. 2018;2018:1349868. - PMC - PubMed
    1. Kumarendran B, O’Reilly MW, Manolopoulos KN, et al. . Polycystic ovary syndrome, androgen excess, and the risk of nonalcoholic fatty liver disease in women: a longitudinal study based on a United Kingdom primary care database. Plos Med. 2018;15(3):e1002542. - PMC - PubMed
    1. Bajuk Studen K, Jensterle Sever M, Pfeifer M. Cardiovascular risk and subclinical cardiovascular disease in polycystic ovary syndrome. Front Horm Res. 2013;40:64-82. - PubMed

Publication types

MeSH terms