Review
. 2021 Dec;50(12):2319-2347.
doi: 10.1007/s00256-021-03807-7. Epub 2021 Jun 18.

MRI nomenclature for musculoskeletal infection

Affiliations
Review

MRI nomenclature for musculoskeletal infection

Erin F Alaia et al. Skeletal Radiol. 2021 Dec.

Erratum in

  • Correction to: MRI nomenclature for musculoskeletal infection.
    Alaia EF, Chhabra A, Simpfendorfer CS, Cohen M, Mintz DN, Vossen JA, Zoga AC, Fritz J, Spritzer CE, Armstrong DG, Morrison WB. Alaia EF, et al. Skeletal Radiol. 2022 May;51(5):1103-1104. doi: 10.1007/s00256-022-03999-6. Skeletal Radiol. 2022. PMID: 35083546 Free PMC article. No abstract available.

Abstract

The Society of Skeletal Radiology (SSR) Practice Guidelines and Technical Standards Committee identified musculoskeletal infection as a White Paper topic, and selected a Committee, tasked with developing a consensus on nomenclature for MRI of musculoskeletal infection outside the spine. The objective of the White Paper was to critically assess the literature and propose standardized terminology for imaging findings of infection on MRI, in order to improve both communication with clinical colleagues and patient care.A definition was proposed for each term; debate followed, and the committee reached consensus. Potential controversies were raised, with formulated recommendations. The committee arrived at consensus definitions for cellulitis, soft tissue abscess, and necrotizing infection, while discouraging the nonspecific term phlegmon. For bone infection, the term osteitis is not useful; the panel recommends using terms that describe the likelihood of osteomyelitis in cases where definitive signal changes are lacking. The work was presented virtually to SSR members, who had the opportunity for review and modification prior to submission for publication.

Keywords: Abscess; MRI; Musculoskeletal infection; Osteomyelitis.


Conflict of interest statement

The authors declare no conflict of interest.

Figures

Fig. 1
Fig. 1
Cellulitis of the foot in a 61-year-old male. Short axis T1 (A) and proton-density fat-suppressed images (B) show skin thickening (dashed arrows, B) and cellulitis of the superficial subcutaneous tissues, with edema-like signal and reticulation of the subcutaneous fat (arrows A, B). Pre-contrast (C) and post-contrast (D) fat-suppressed T1 images show ill-defined enhancement of the skin (dashed arrows, D) and superficial subcutaneous tissues (arrows, D)
Fig. 2
Fig. 2
Bland edema in a 59-year-old male. Short axis T2 fat-suppressed (A), T1 (B), and T1 post-contrast images with fat-suppression show confluent subcutaneous edema at the dorsum of the foot (arrows, A), with thickening of the dermis (arrows, B) but no visible skin defect or organized fluid collection. Lack of enhancement on post-contrast image (C) confirms the diagnosis of bland edema
Fig. 3
Fig. 3
Plantar ulcer and sinus tract in a 55-year-old male. Short axis T2 fat-suppressed (A) and T1 fat-suppressed post-contrast images (B) demonstrate ulceration of the plantar soft tissues underlying the first webspace (arrowheads A, B), with contiguous sinus tract (arrows A, B) outlined by thin enhancing granulation tissue
Fig. 4
Fig. 4
Thigh intramuscular soft tissue abscess in a 33-year-old male. Axial STIR (A), axial T1 (B), and axial T1 fat-suppressed post-contrast (C) images demonstrate an intramuscular multiloculated fluid collection within the lateral thigh (arrows, A), involving the vastus lateralis and rectus femoris muscles, demonstrating a subtle relatively T1 hyperintense rim (“penumbra sign,” arrows, B), and avid peripheral rim enhancement (arrows, C), compatible with an intramuscular soft tissue abscess
Fig. 5
Fig. 5
Utility of diffusion weighted imaging for abscess detection in a 47-year-old female. Short axis T2 Dixon water map image of the foot demonstrates a fluid collection encircling the first metatarsal (arrows, A), demonstrating high signal on diffusion-weighted images (arrows, B, image above, b = 800), and low signal (ADC = 0.5–0.6 × 10−3 mm2/s) on the ADC map (arrows, B, image below), features compatible with abscess
Fig. 6
Fig. 6
Involucrum and sequestrum in the lower leg of a 4-year-old male with chronic osteomyelitis. Axial T2-weighted fat-suppressed MR image (A) and corresponding axial pre and post-contrast T1-weighted fat suppressed MR images (B) of the lower leg show diffuse edema within the tibia (long arrow) with lack of enhancement, consistent with sequestrum formation. Surrounding muscular edema and enhancement (arrowheads, short white arrows) represents myositis, without discrete soft tissue abscess. The shell of enhancing bone (short black arrows) represents the new bone formation (involucrum)
Fig. 7
Fig. 7
Devitalized tissue in an 83-year-old diabetic female. Short axis STIR (A), T1 (B), and T1 fat-suppressed post-contrast (C) images of the forefoot demonstrating shallow ulceration of the plantar soft tissues (arrowheads), with surrounding cellulitis, and a geographic area of non-enhancement (arrows B, C), compatible with devitalized tissue
Fig. 8
Fig. 8
A 39-year-old female with necrotizing deep soft tissue infection of the thigh. Axial T2 fat-suppressed (A) and T1 fat-suppressed post-contrast (B) images of the thigh suggest presence of a necrotizing soft tissue infection, with rim-enhancing abscesses extending along deep fascial planes of multiple compartments (arrows A, B), with thick enhancement of the deep fascia (white arrows, B)
Fig. 9
Fig. 9
Septic arthritis and osteomyelitis in a 67-year-old female. Coronal T2 fat-suppressed (A), T1 (B), and T1 fat-suppressed post-contrast (C) images of the second digit show marked edema and enhancement of the proximal interphalangeal joint capsule and the surrounding soft tissues secondary to synovitis from septic arthritis (arrows, A, C), with symmetric, diffuse joint space narrowing and an erosion along the proximal phalanx head (arrow, B), with adjacent T1 marrow replacement and periosteal reaction compatible with osteomyelitis
Fig. 10
Fig. 10
Septic arthritis with osteomyelitis in a 67-year-old male. Coronal T1 (A) and T1 fat-suppressed post-contrast (B) images of the right hip show erosions at the lateral femoral neck and superomedial acetabulum with disruption of the subchondral bone plate (arrowheads, A). Confluent replacement of normal fat signal in the medullary space of the adjacent acetabulum (arrow, A) with post-contrast enhancement (arrow, B) is consistent with progression to osteomyelitis. Enhancement of the joint fluid and capsule is compatible with synovitis (arrowheads, B)
Fig. 11
Fig. 11
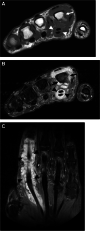
Septic tenosynovitis in a 48-year-old male. Axial T1 (A), T2 fat-suppressed (B), and coronal STIR (C) images of the hand show complex fluid distending the second digit flexor tendon sheath (arrowheads, AC), compatible with septic tenosynovitis. Also present is a complex effusion of the second metacarpophalangeal joint (arrows, B), with erosion at the second metacarpal head (arrow, A), compatible with septic arthritis
Fig. 12
Fig. 12
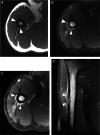
Humeral osteomyelitis with periosteal reaction in a 16-year-old male. Axial T1 (A), axial T2 fat-suppressed (B), and axial (C) and coronal (D) T1 fat-suppressed post-contrast images demonstrate confluent T1 marrow replacement of the humeral medullary canal (asterisk, A), compatible with osteomyelitis, with a thick rim of enhancing periosteal new bone formation (arrowheads), compatible with periosteal reaction
Fig. 13
Fig. 13
Subperiosteal spread of infection in a 21-year-old female with sickle cell disease and bone infarcts. Axial T2 fat-suppressed Dixon image with water amplification (A), axial T1 (B), and axial T1 fat-saturated post-contrast images of the lower leg demonstrating a subperiosteal fluid collection (arrowheads, A) which demonstrates a thin T1 hyperintense rim (“penumbra sign,” arrowheads, B) which enhances after contrast administration (arrowheads, C), confirming subperiosteal spread of infection with abscess formation
Fig. 14
Fig. 14
Cloaca and sinus tract in a 55-year-old male with chronic osteomyelitis. Axial T1 (A), axial T2 fat-suppressed (B), and sagittal T1 fat-suppressed post-contrast (C) images of the lower leg demonstrate chronic tibial osteomyelitis, with an intraosseous abscess decompressing to the skin surface via a cloaca and a contiguous sinus tract (arrows, AC). Of note, the tibia and fibula are fused from prior trauma
Fig. 15
Fig. 15
Osteomyelitis of the calcaneus in a 48-year-old diabetic female. Sagittal T1 (A) and STIR (B) images of the ankle show a large ulcer at the plantar aspect of the heel (arrows, A) communicating with the inferior calcaneus. Replacement of the normal calcaneal fatty marrow (arrowheads, A) and corresponding marrow edema-like signal (arrowheads, B) within the medullary space represents osteomyelitis
Fig. 16
Fig. 16
Marrow signal changes with high likelihood for osteomyelitis of the fifth metatarsal head in a 54-year-old diabetic female. Short axis T1 (A) and T2 fat-suppressed (B) images of the forefoot show lateral ulceration (arrows, A). Signal in the adjacent fifth metatarsal head is discordant- normal signal on T1 (arrowhead, A), with subcortical bone marrow edema-like signal on fluid sensitive images (arrowheads, B). In the presence of an adjacent soft tissue infection, findings should be considered to represent a high likelihood for early osteomyelitis
Fig. 17
Fig. 17
Patterns of T1 signal alteration. Short-axis T1-weighted image of the first proximal phalanx shows a hazy, reticular pattern of T1 marrow signal abnormality, where patchy areas of fat signal are seen amidst a background of reticular low T1 signal (arrows, A), while an axial T1 image of the ankle shows a subcortical distribution of signal abnormality, with a thin linear region of low T1 signal adjacent to the medial tibial cortex (arrows, B). An axial image of the hip shows T1 features compatible with osteomyelitis, with a confluent pattern and medullary distribution of marrow signal abnormality (arrows, C), involving a geographic area of the medullary canal along the greater trochanter
Fig. 18
Fig. 18
Intra-osseous abscess in a 35-year-old male with chronic osteomyelitis. Coronal T1 (A), T2 (B), and T1 post-contrast images (C) of the distal femur show cortical thickening (arrows, A) related to chronic osteomyelitis. A rounded region of low T1, high T2 signal (arrowheads, A, B) in the central medullary canal is present, revealing post-contrast rimenhancement (arrowheads, C); in the setting of infection, this meets criteria for intra-osseous abscess
Fig. 19
Fig. 19
Sequestrum in a 40-year-old male with chronic osteomyelitis of the distal tibia following an open fracture. Sagittal T1 (A), STIR (B), and T1 fat-suppressed post-contrast (C) images of the ankle show destruction of the distal tibia with low T1 and intermediate-to-high signal STIR signal in the distal tibial medullary space, with heterogeneous enhancement (white arrows, AC) representing chronic osteomyelitis. A focus of black signal (black arrows, A, B) at the articular surface represents a sequestrum, with no/minimal enhancement (black arrows, C) representing devitalization

Similar articles

Cited by

References

    1. Duryea D, Bernard S, Flemming D, Walker E, French C. Outcomes in diabetic foot ulcer patients with isolated T2 marrow signal abnormality in the underlying bone: should the diagnosis of "osteitis" be changed to "early osteomyelitis"? Skeletal Radiol. 2017;46(10):1327–1333. - PubMed
    1. Hirschfeld CB, Kapadia SN, Bryan J, Jannat-Khah DP, May B, Vielemeyer O, et al. Impact of diagnostic bone biopsies on the management of non-vertebral osteomyelitis: a retrospective cohort study. Medicine (Baltimore) 2019;98(34):e16954. - PMC - PubMed
    1. Hoang D, Fisher S, Oz OK, La Fontaine J, Chhabra A. Percutaneous CT guided bone biopsy for suspected osteomyelitis: diagnostic yield and impact on patient's treatment change and recovery. Eur J Radiol. 2019;114:85–91. - PubMed
    1. Lipsky BA, Berendt AR, Cornia PB, Pile JC, Peters EJ, Armstrong DG, et al. 2012 Infectious Diseases Society of America clinical practice guideline for the diagnosis and treatment of diabetic foot infections. Clin Infect Dis. 2012;54(12):e132–173. - PubMed
    1. American College of Radiology, ACR Manual on Contrast Media. 2021.