. 2021 Jul;33(30):e2008539.
doi: 10.1002/adma.202008539. Epub 2021 Jun 17.

Multimodal Digital X-ray Scanners with Synchronous Mapping of Tactile Pressure Distributions using Perovskites

Affiliations

Multimodal Digital X-ray Scanners with Synchronous Mapping of Tactile Pressure Distributions using Perovskites

Jiuk Jang et al. Adv Mater. 2021 Jul.

Abstract

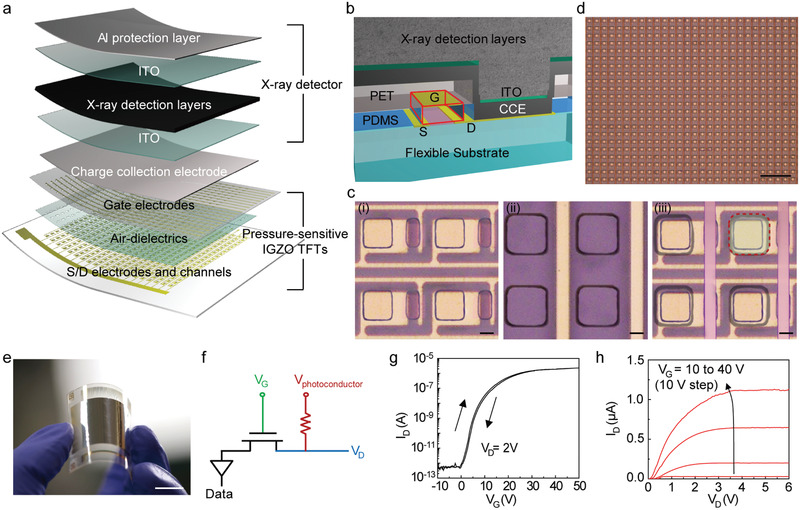
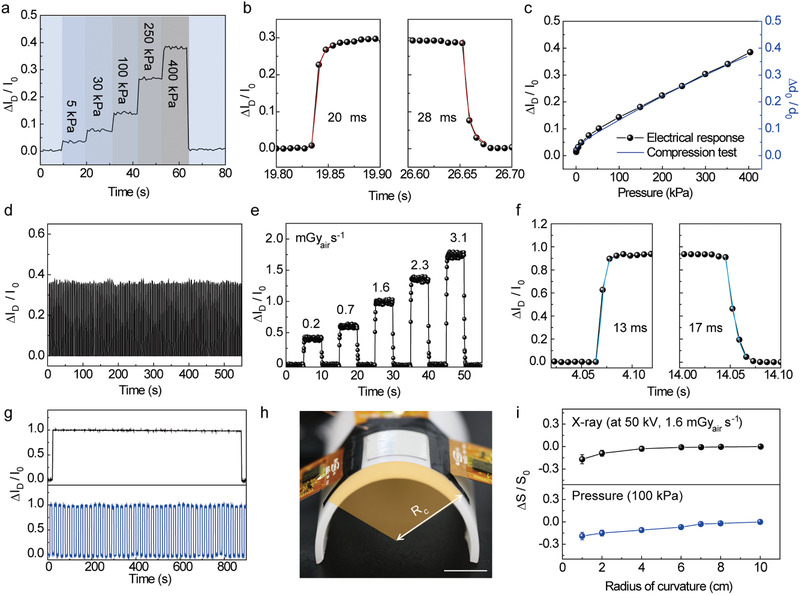
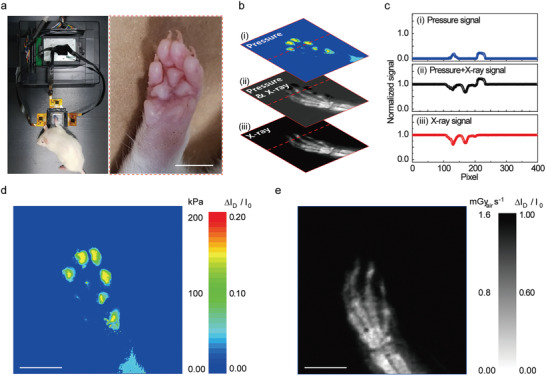
Visual and tactile information are the key intuitive perceptions in sensory systems, and the synchronized detection of these two sensory modalities can enhance accuracy of object recognition by providing complementary information between them. Herein, multimodal integration of flexible, high-resolution X-ray detectors with a synchronous mapping of tactile pressure distributions for visualizing internal structures and morphologies of an object simultaneously is reported. As a visual-inspection method, perovskite materials that convert X-rays into charge carriers directly are synthesized. By incorporating pressure-sensitive air-dielectric transistors in the perovskite components, X-ray detectors with dual modalities (i.e., vision and touch) are attained as an active-matrix platform for digital visuotactile examinations. Also, in vivo X-ray imaging and pressure sensing are demonstrated using a live rat. This multiplexed platform has high spatial resolution and good flexibility, thereby providing highly accurate inspection and diagnoses even for the distorted images of nonplanar objects.

Keywords: X-ray detectors; lead halide perovskites; multimodal sensors; perovskites; pressure sensors; tactile sensors.


Conflict of interest statement

The authors declare no conflict of interest.

Figures

Figure 1
Figure 1
Synthesis and characterizations of GA‐doped MAPbI3. a) The tolerance factor of GA x MA1−x PbI3 as a function of GA concentration. b) The molecular structures of MA and GA along with their net dipole moments (µ). The blue, gray, and white colored spheres represent nitrogen, carbon, and hydrogen, respectively. c) The SEM image of GA0.1MA0.9PbI3 film showing micrometer‐sized grains. Scale bar: 50 µm. The inset shows the cross‐sectional SEM image of the film. Scale bar: 200 µm. d) The XRD spectra of pure MAPbI3 and GA0.1MA0.9PbI3 films. e) Real‐time response of the diode‐configured X‐ray detector under X‐ray irradiation (tube voltage of 50 kV, and dose rate of 1.6 mGyair s−1 for 300 ms) with varying applied bias voltage. f) The sensitivities of the X‐ray detector as a function of bias voltage.
Figure 2
Figure 2
Integration of the pressure‐sensitive IGZO TFT arrays with the perovskite layer. a) Schematic layouts of the multiplexed detector that consisted of pressure‐sensitive IGZO TFTs and X‐ray detectors. b) Schematic image of the cross‐sectional perspective view of the fully‐integrated multiplexed detector. c) Optical microscopy images before the integration of the perovskite layers. The bottom panel consists of the IGZO channels, S/D electrodes, and elastomeric partition spacers with via holes (i). The top panel consists of the gate electrode and via holes (ii). The bottom and top panel are integrated with the alignment of via holes (iii). Scale bars: 10 µm. d) Optical microscopy image of a high‐resolution pressure‐sensitive IGZO TFT arrays with a pixel pitch of 50 µm. Scale bar: 200 µm. e) Photograph of a flexible, high‐resolution multiplexed detector with a sensing area of 2 × 2 cm. Scale bar: 1 cm. f) Circuit diagram of the multiplexed detector. g,h) Transfer characteristic (V D = 2 V) and output characteristic (V G = 10 to 40 V) of the multiplexed detector.
Figure 3
Figure 3
Characteristics of the sensors in the multiplexed detector for tactile pressures and X‐rays. a) Real‐time detection of the ∆I D/I 0 when the pressure was applied stepwise ranging from 5 to 400 kPa without X‐ray irradiation (the biases of 30, 2, and 30 V were applied to the terminals of the V G, V D, and V photoconductor, respectively). b) Response and recovery time of the multiplexed detector with the applied pressure of 250 kPa. c) Comparison between electrical response of the multiplexed detector under applied pressure and true strain–stress curve from the compression test of PDMS. d) Reliability of the multiplexed detector during the repetitive application of 100 cycles at a pressure of 400 kPa. e) Real‐time detection of the ∆I D/I 0 during X‐ray irradiation with different dose rates from 0.2 to 3.1 mGyair s−1 (V photoconductor = 30 V). The voltage of the X‐ray tube was kept at 50 kV. f) Response and recovery time of the multiplexed detector with the X‐ray dose rate of 1.6 mGyair s−1. g) Photostability of the multiplexed detector during the continuous (top) or repetitive (bottom) X‐ray irradiation (1.6 mGyair s−1). h) Photograph of the experimental setup for the bending test. Scale bar: 1 cm. i) Relative changes in sensitivities (∆S D/S 0) of the multiplexed detector for each physical quantity (i.e., X‐ray and tactile pressure) with different radii of bending curvatures.
Figure 4
Figure 4
In vivo imaging of the X‐ray and the pressure. a) Photographs of the experimental set‐up (left) for in vivo radiography and pressure distribution imaging of the foot and an enlarged image of the rat's foot (right). Scale bar: 5 mm. b) Calibration process to distinguish the complex signals from visual (i.e., X‐rays) and tactile (i.e., pressure) information. i,iii) Contour plot of the pressure distribution, and X‐ray radiography, respectively. c) Normalized ∆I D/I 0 measured along the red dotted line in the contour plots in (b). d,e) Contour plots of the pressure distribution and anatomical structure of the rat's foot obtained by the multiplexed detector after the calibration process. The voltage of the X‐ray tube was kept at 50 kV with a dose rate of 1.6 mGyair s−1 for 500 ms (total X‐ray dose: 0.8 mGyair). Scale bars: 5 mm.

References

    1. Bandodkar A. J., Choi J., Lee S. P., Jeang W. J., Agyare P., Gutruf P., Wang S., Sponenburg R. A., Reeder J. T., Schon S., Ray T. R., Chen S., Mehta S., Ruiz S., Rogers J. A., Adv. Mater. 2019, 31, 1902109. - PubMed
    1. Sim K., Rao Z., Ershad F., Yu C., Adv. Mater. 2020, 32, 1902417. - PubMed
    1. Ai Y., Hsu T. H., Wu D. C., Lee L., Chen J.‐H., Chen Y.‐Z., Wu S.‐C., Wu C., Wang Z. M., Chueh Y.‐L., J. Mater. Chem. C 2018, 6, 5514.
    1. Yoo Y. J., Kim W.‐G., Ko J. H., Kim Y. J., Lee Y., Stanciu S. G., Lee J.‐M., Kim S., Oh J.‐W., Song Y. M., Adv. Sci. 2020, 7, 2000978. - PMC - PubMed
    1. Yin R., Xu Z., Mei M., Chen Z., Wang K., Liu Y., Tang T., Priydarshi M. K., Meng X., Zhao S., Deng B., Peng H., Liu Z., Duan X., Nat. Commun. 2018, 9, 2334. - PMC - PubMed

LinkOut - more resources