

A community challenge to evaluate RNA-seq, fusion detection, and isoform quantification methods for cancer discovery
- PMID: 34146471
- PMCID: PMC8376800
- DOI: 10.1016/j.cels.2021.05.021
A community challenge to evaluate RNA-seq, fusion detection, and isoform quantification methods for cancer discovery
Abstract
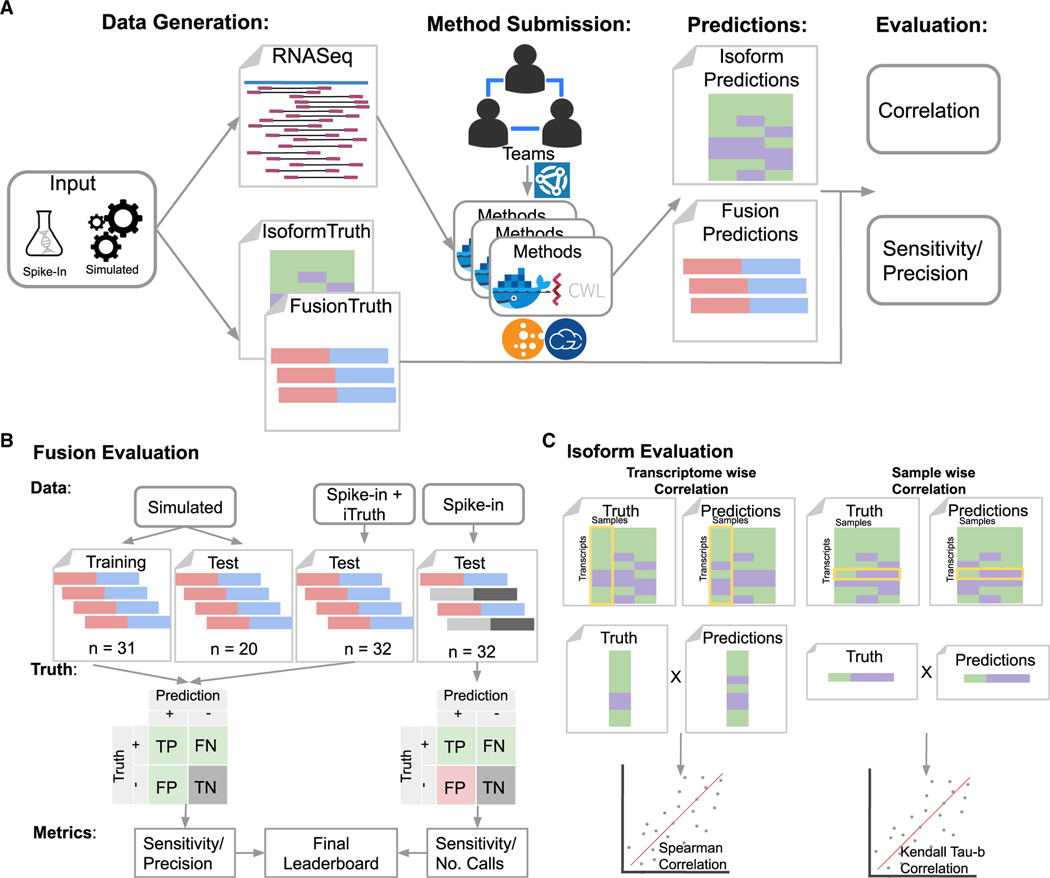
The accurate identification and quantitation of RNA isoforms present in the cancer transcriptome is key for analyses ranging from the inference of the impacts of somatic variants to pathway analysis to biomarker development and subtype discovery. The ICGC-TCGA DREAM Somatic Mutation Calling in RNA (SMC-RNA) challenge was a crowd-sourced effort to benchmark methods for RNA isoform quantification and fusion detection from bulk cancer RNA sequencing (RNA-seq) data. It concluded in 2018 with a comparison of 77 fusion detection entries and 65 isoform quantification entries on 51 synthetic tumors and 32 cell lines with spiked-in fusion constructs. We report the entries used to build this benchmark, the leaderboard results, and the experimental features associated with the accurate prediction of RNA species. This challenge required submissions to be in the form of containerized workflows, meaning each of the entries described is easily reusable through CWL and Docker containers at https://github.com/SMC-RNA-challenge. A record of this paper's transparent peer review process is included in the supplemental information.
Keywords: Cancer; Cloud compute; DREAM Challenge; RNA fusion; RNA-seq; benchmark; crowd-sourced; evaluation; isoform quantification.
Copyright © 2021 The Authors. Published by Elsevier Inc. All rights reserved.
Conflict of interest statement
Declaration of interests The authors declare no competing interests.
Figures
References
-
- Abugessaisa I, Noguchi S, Carninci P, and Kasukawa T. (2017). The FANTOM5 computation ecosystem: genomic information hub for promoters and active enhancers. Methods Mol. Biol. 1611, 199–217. - PubMed
-
- Ahsen ME, Vogel R, and Stolovitzky G. (2018). Unsupervised evaluation and weighted aggregation of ranked predictions. J. Mach. Learn. Res. 20, 1–40.
-
- Bray NL, Pimentel H, Melsted P, and Pachter L. (2016). Near-optimal probabilistic RNA-seq quantification. Nat. Biotechnol. 34, 525–527. - PubMed
-
- Chen S, Huang V, Xu X, Livingstone J, Soares F, Jeon J, Zeng Y, Hua JT, Petricca J, Guo H, et al. (2019). Widespread and functional RNA circularization in localized prostate. Cancer Cell 176, 831–843. - PubMed
Publication types
MeSH terms
Substances
Grants and funding
- U24 CA180922/CA/NCI NIH HHS/United States
- U24 CA209923/CA/NCI NIH HHS/United States
- R01 GM109031/GM/NIGMS NIH HHS/United States
- U24 CA143799/CA/NCI NIH HHS/United States
- P30 CA016042/CA/NCI NIH HHS/United States
- R01 CA180778/CA/NCI NIH HHS/United States
- R50 CA211461/CA/NCI NIH HHS/United States
- HHSN261200800001C/RC/CCR NIH HHS/United States
- HHSN261200800001E/CA/NCI NIH HHS/United States
- U24 CA210990/CA/NCI NIH HHS/United States
- U24 CA210957/CA/NCI NIH HHS/United States
- R01 HG010053/HG/NHGRI NIH HHS/United States
