Multicenter Study
. 2021 Oct;161(4):1245-1256.e20.
doi: 10.1053/j.gastro.2021.06.024. Epub 2021 Jun 17.

Mucosal Biofilms Are an Endoscopic Feature of Irritable Bowel Syndrome and Ulcerative Colitis

Affiliations
Multicenter Study

Mucosal Biofilms Are an Endoscopic Feature of Irritable Bowel Syndrome and Ulcerative Colitis

Maximilian Baumgartner et al. Gastroenterology. 2021 Oct.

Abstract

Background & aims: Irritable bowel syndrome (IBS) and inflammatory bowel diseases result in a substantial reduction in quality of life and a considerable socioeconomic impact. In IBS, diagnosis and treatment options are limited, but evidence for involvement of the gut microbiome in disease pathophysiology is emerging. Here we analyzed the prevalence of endoscopically visible mucosal biofilms in gastrointestinal disease and associated changes in microbiome composition and metabolism.

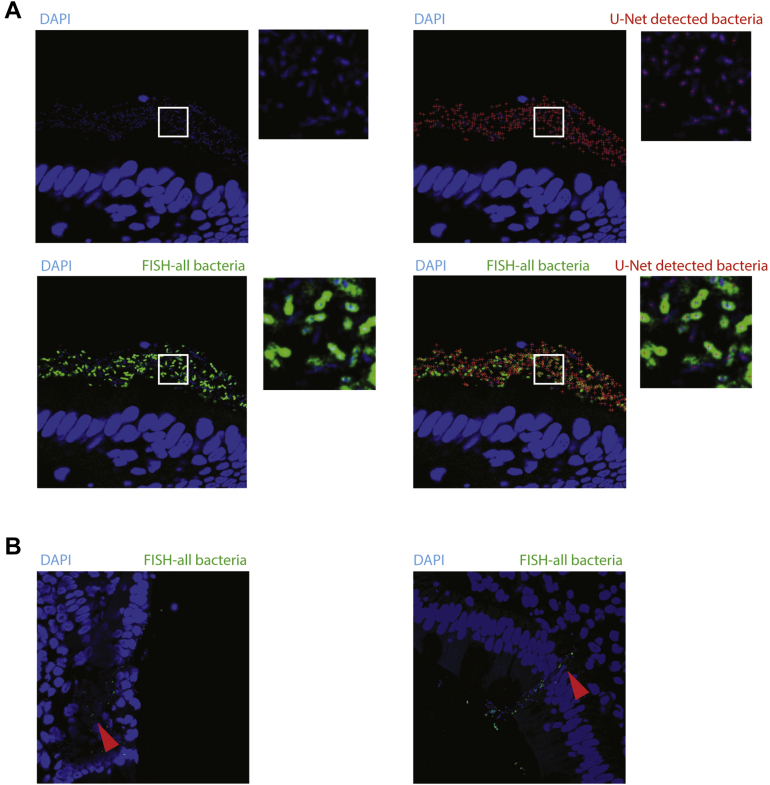
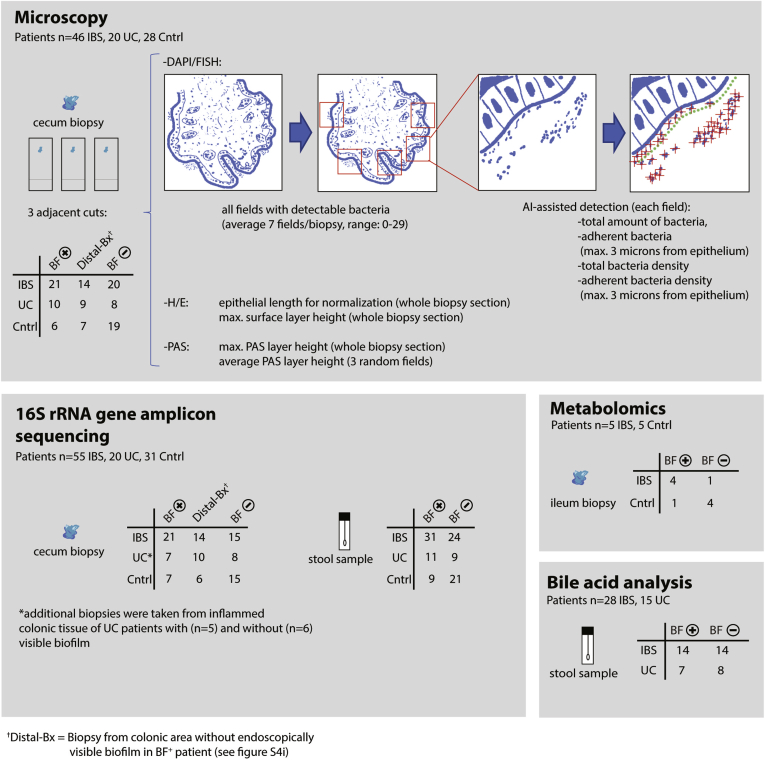
Methods: The presence of mucosal biofilms was assessed in 1426 patients at 2 European university-based endoscopy centers. One-hundred and seventeen patients were selected for in-depth molecular and microscopic analysis using 16S ribosomal RNA gene amplicon-sequencing of colonic biopsies and fecal samples, confocal microscopy with deep learning-based image analysis, scanning electron microscopy, metabolomics, and in vitro biofilm formation assays.

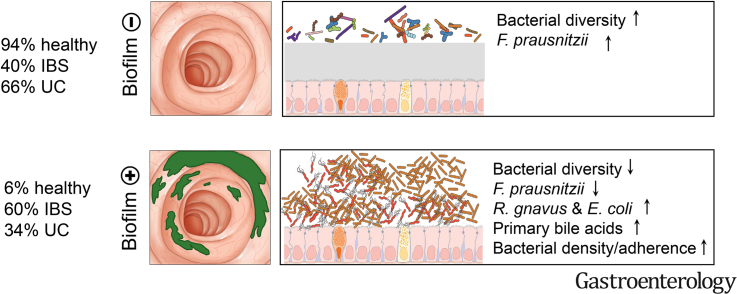
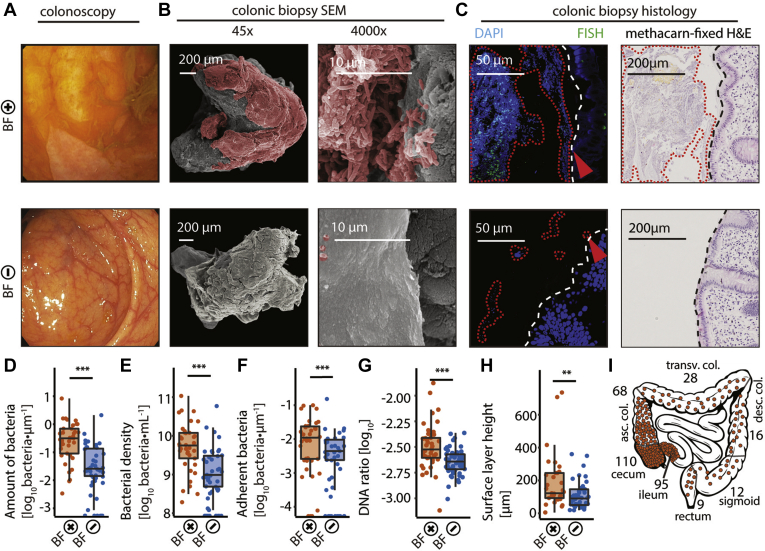
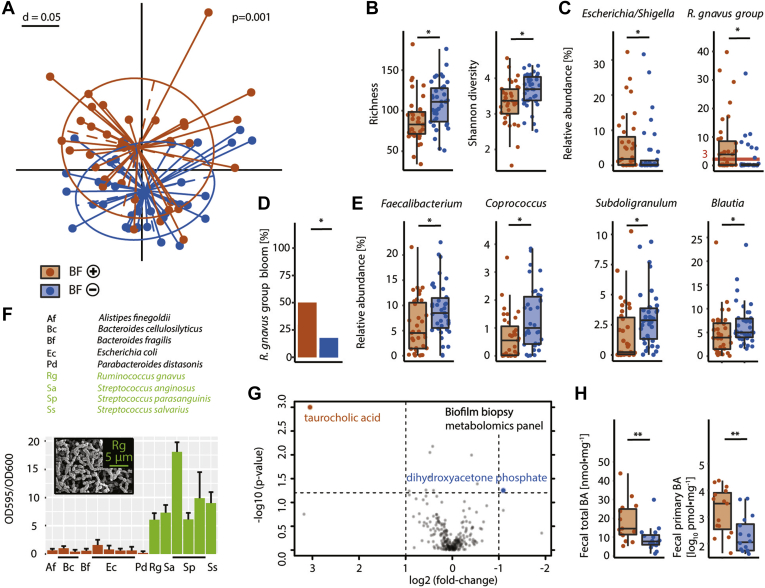
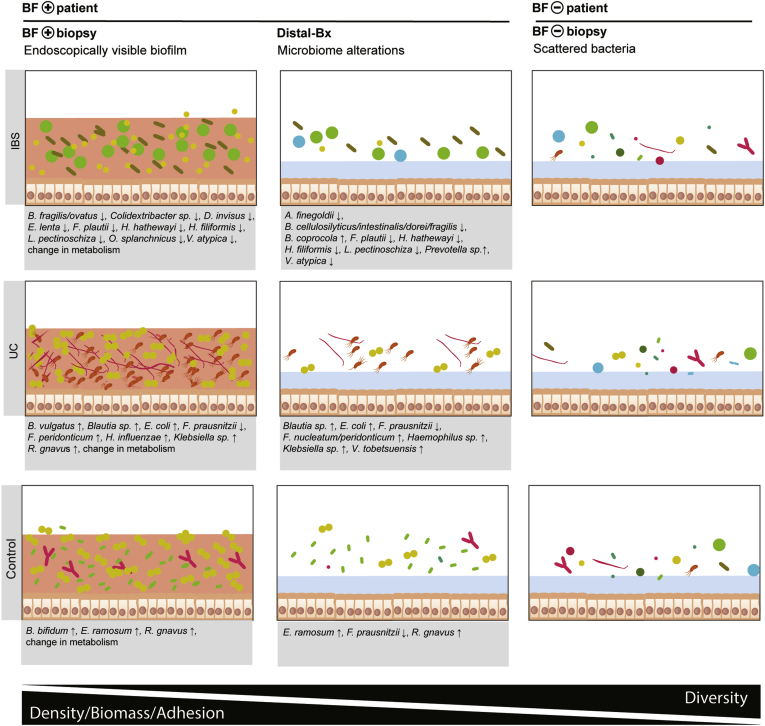
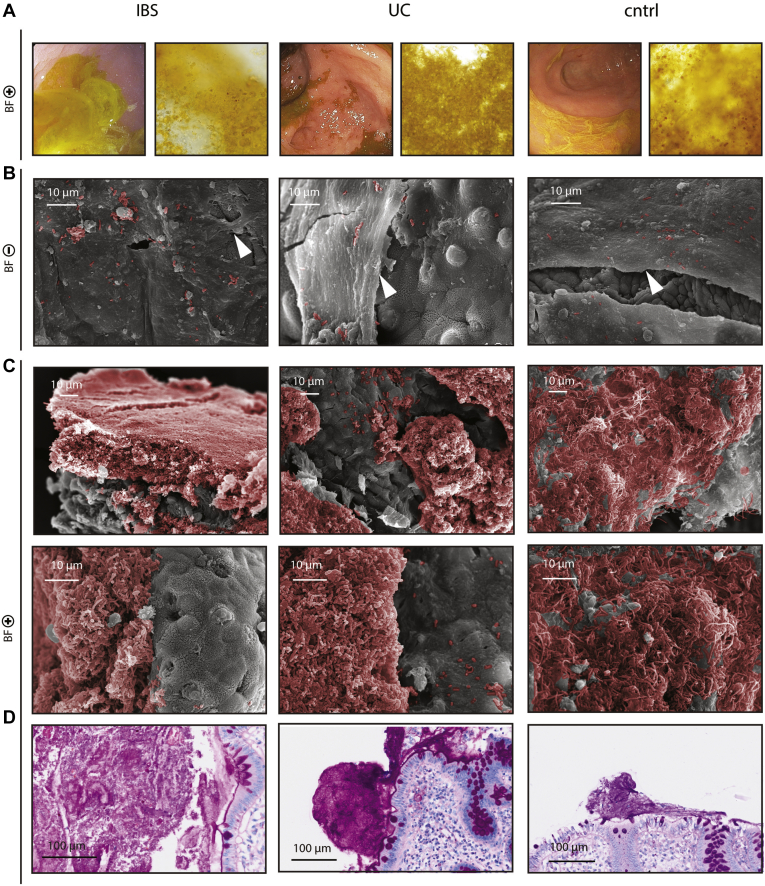
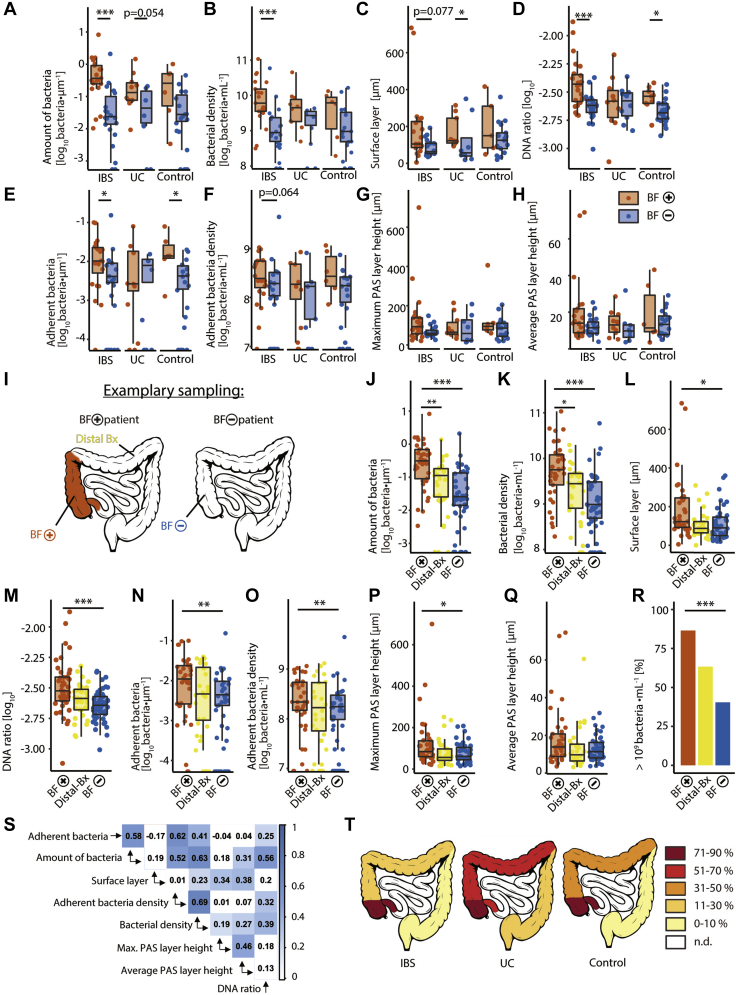
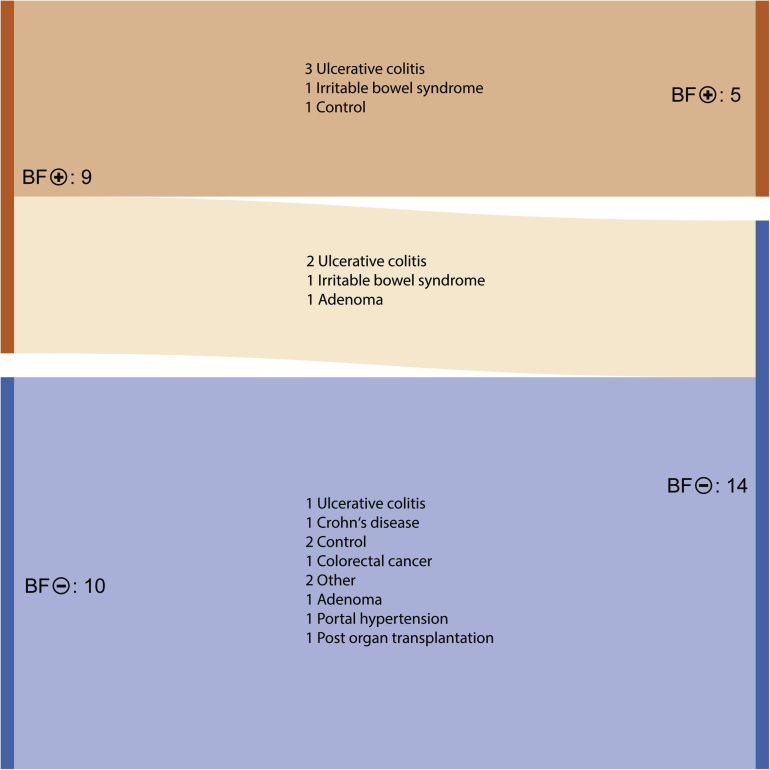
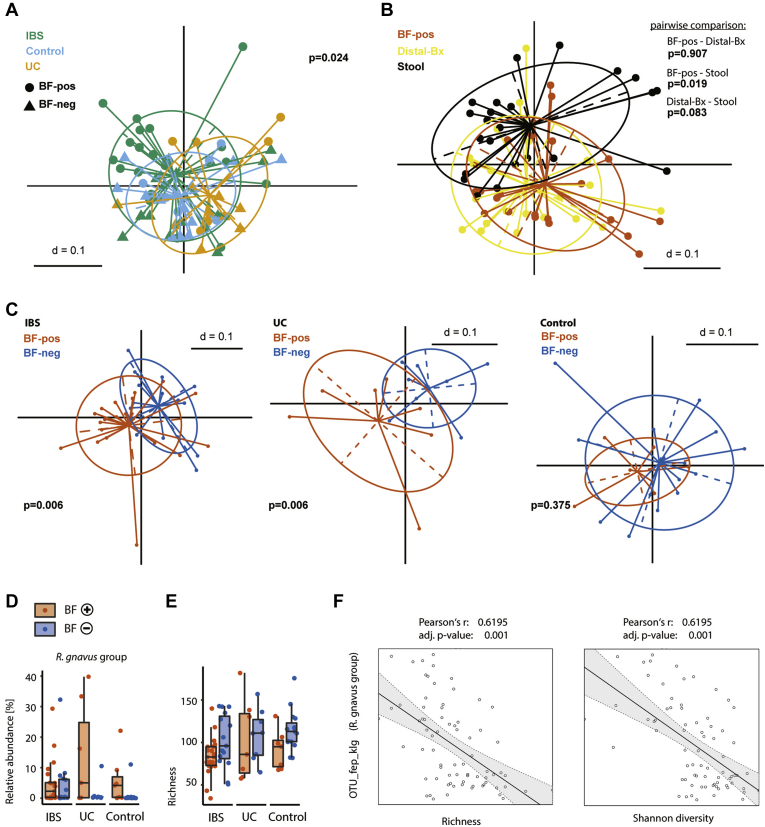
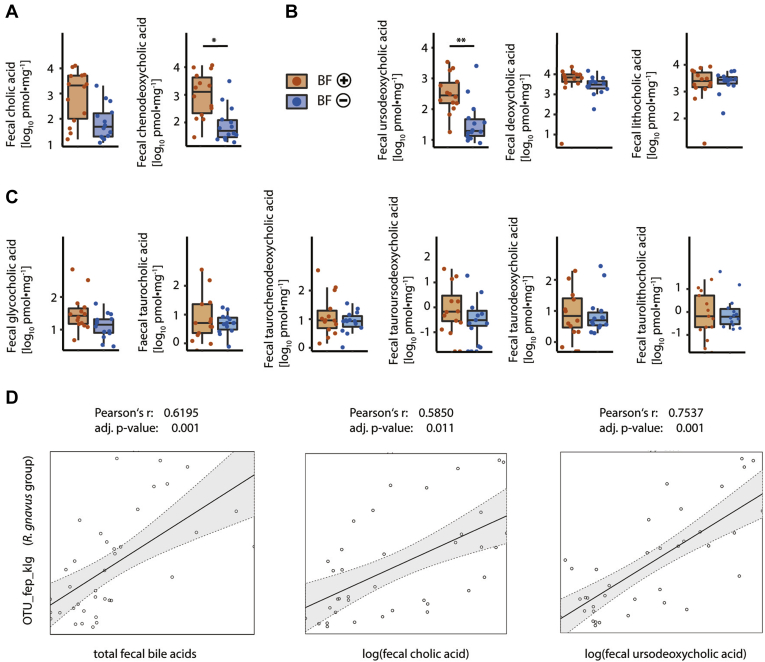
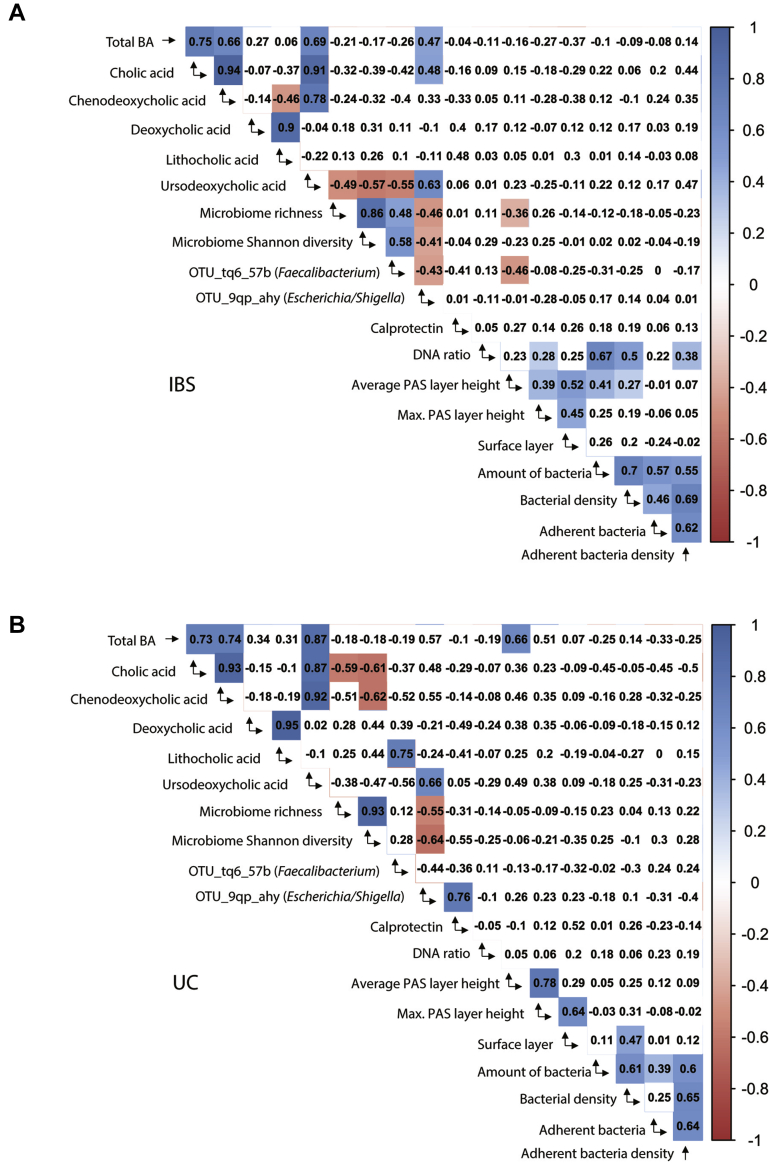
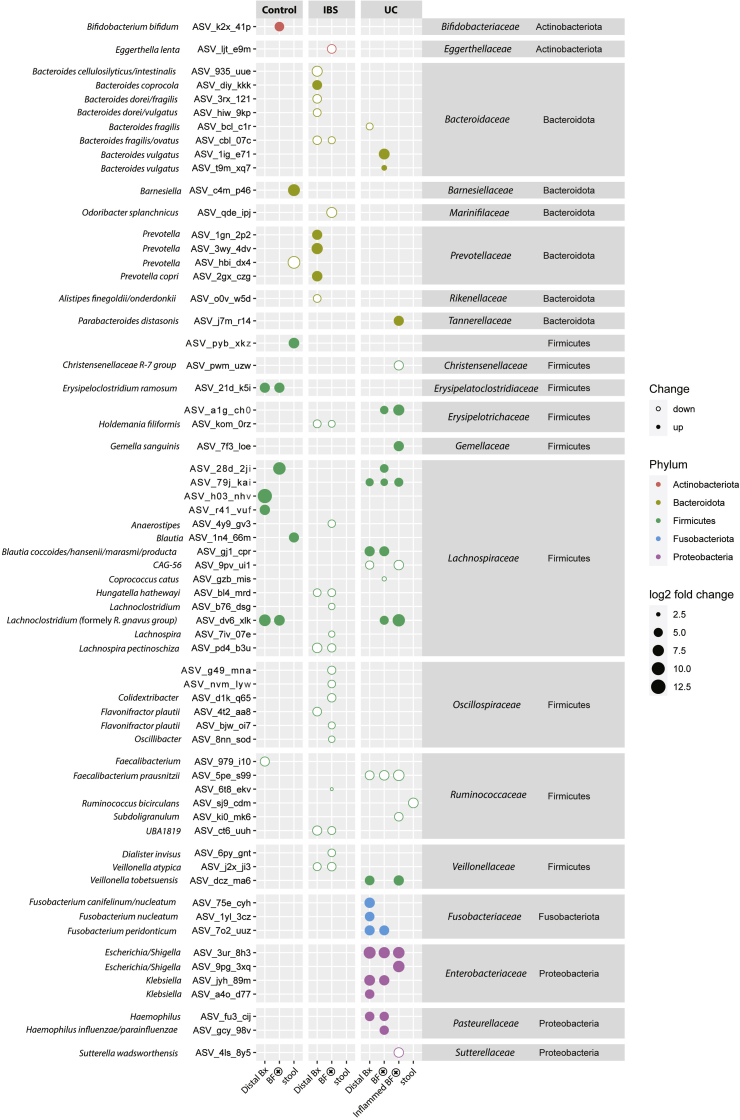
Results: Biofilms were present in 57% of patients with IBS and 34% of patients with ulcerative colitis compared with 6% of controls (P < .001). These yellow-green adherent layers of the ileum and right-sided colon were microscopically confirmed to be dense bacterial biofilms. 16S-sequencing links the presence of biofilms to a dysbiotic gut microbiome, including overgrowth of Escherichia coli and Ruminococcus gnavus. R. gnavus isolates cultivated from patient biofilms also formed biofilms in vitro. Metabolomic analysis found an accumulation of bile acids within biofilms that correlated with fecal bile acid excretion, linking this phenotype with a mechanism of diarrhea.

Conclusions: The presence of mucosal biofilms is an endoscopic feature in a subgroup of IBS and ulcerative colitis with disrupted bile acid metabolism and bacterial dysbiosis. They provide novel insight into the pathophysiology of IBS and ulcerative colitis, illustrating that biofilm can be seen as a tipping point in the development of dysbiosis and disease.

Keywords: Bacterial–Epithelial Interaction; Endoscopy; Functional Gastrointestinal Disorders; Microbiota.


Figures

None
Graphical abstract
Figure 1
Figure 1
Endoscopically visible biofilms consist of dense bacterial agglomerations. (A–C) Comparison of representative endoscopic pictures and biopsies of patients with (BF+ IBS, top panel) and without (BF control, bottom panel) macroscopically visible biofilms. (A) Endoscopic picture of a yellow-green layer adhering to the intestinal mucosal surface of a BF+ patient, which is not present in BF patients. (B) SEM of the same patients, confirming the presence of tightly packed bacteria adhering to the epithelium in BF+ biopsies (bacteria in red). BF biopsies had an intact mucus layer with foci of scattered bacteria. (C) Biopsy sections stained with DAPI (blue) and fluorescence in situ hybridization with a general bacteria probe Mix EUB338 I-III (green) revealed densely packed bacteria in direct contact with the epithelium (red arrow) in BF+ biopsies, compared with scattered bacteria distant from the epithelium in BF biopsies. Dashed white line marks the border of the epithelium. H&E staining revealed a surface layer comprising mucus and bacteria in BF+ biopsies. (D) Total number of bacteria normalized to length of epithelium per section (BF+ biopsies, orange; BF biopsies, blue). (E) Maximum density of bacteria in one 144.7 × 144.7 μm confocal microscopy image per section. (F) Number of bacteria within 3-μm distance from the epithelium, normalized to length of epithelium per section. (G) Ratio of 16S rRNA gene copies to total double-stranded DNA per biopsy. (H) Maximum height of methacarn-fixed H&E-stained surface layer on top of the epithelium, per section. (i) Location and number of biofilms of the primary study cohort. Most biofilms were observed in the ileum, cecum, and ascending colon. (D, E, F) Zero values are displayed on the x-axis, as they are not defined on a log-scale. Statistical analysis: (D, E, F, H) Mann-Whitney U test, n = 37 BF+, n = 47 BF, (G) t test on log-transformed data, n = 42 BF+, n = 56 BF; ∗∗P ≤ .01, ∗∗∗P ≤ .001.
Figure 2
Figure 2
Bacterial dysbiosis, spontaneous biofilm formation, and increased BA levels in BF+ patients. (A) Multidimensional scaling plot of bacterial profiles (16S, generalized UniFrac distances) from colonic BF+ biopsies (orange) and BF biopsies (blue), including patients with IBS, patients with UC, and healthy controls. (B) BF+ biopsies had bacterial dysbiosis (reduced richness and Shannon diversity index). (C) BF+ biopsies were enriched in bacteria from the Escherichia/Shigella genus and R. gnavus group. (D) 51% of BF+ biopsies had a bloom of R. gnavus compared with 18% of BF biopsies. (E) BF+ biopsies had a reduction in short-chain fatty acid–producing genera, including Faecalibacterium, Coprococcus, Subdoligranulum, and Blautia. (F) In vitro biofilm formation assay of 15 bacterial isolates from 6 BF+ brushes (2 controls, 4 patients with IBS). Strains with >5 OD595/OD600 ratio were defined as biofilm formers and are green. Inset: SEM picture of R. gnavus biofilm. (G) Volcano plot of metabolomics panel revealing an enrichment of taurocholic acid (the only BA in our metabolite panel) and a reduction of dihydroxyacetone phosphate in BF+ biopsies, P value threshold .05; log2 fold-change threshold ±1. (H) Increase of total and primary BA in stool samples from BF+ Patients with IBS. Statistical analysis: (A) Permutational multivariate analysis of variance of the distance matrices, (B–C, E) Kruskal-Wallis rank sum test with Benjamini-Hochberg correction for multiple comparisons, (D) Fisher exact test, (H) Mann-Whitney U test; (A–E) n = 35 BF+, n = 38 BF, (F) n = 8 replicates per strain, (G) n = 5 BF+, n = 5 BF, (H) n = 14 BF+, n = 14 BF; ∗P ≤ .05, ∗∗P ≤ .01.
Figure 3
Figure 3
Bacterial signatures in intestinal biofilms of patients with IBS, patients with UC, and healthy controls. Changes of bacterial ASVs in BF+ patients at areas with (BF+ biopsy) and without (Distal-Bx) endoscopically visible biofilms vs BF patients (BF biopsy), for IBS, UC, and healthy controls. Mucus layer (blue), biofilm (red). For each ASV, the bacterial species or genus is listed. n = 35 BF+ biopsies, n = 38 BF biopsies, n = 30 Distal-Bx, n = 51 BF+ stool, and n = 54 BF stool samples.
Supplementary Figure 1
Representative images of biofilm-mode of bacterial growth in patients with IBS, patients with UC, and controls. (A) Biofilm flush specimen show yellow color, bacteria, and shed epithelial cells under light microscopy. (B) SEM of BF biopsies shows an intact mucus layer (white arrows) with scattered bacteria on top (bacteria color enhanced, red). (C) SEM analysis of BF+ biopsies shows a thick layer of bacterial biofilm in direct contact with the epithelium (bacteria color enhanced, red). (D) PAS staining of BF+ biopsies.
Supplementary Figure 2
Machine learning–based bacteria quantification and invasion of epithelium in 2 cases of IBS biofilms. (A) Unmodified exemplary picture of bacteria detected with U-Net machine learning on an image (colonic biopsy of BF+ patient with IBS), which was not part of the U-Net training set (red crosses), DAPI (blue), and overlay of FISH general bacterial probe signal (green). (B) Bacterial invasion into the epithelium in 2 cases of IBS biofilms DAPI (blue) FISH general bacterial probe (green).
Supplementary Figure 3
Description of in-depth molecular and microscopic analysis in a subset of the primary cohort. Depiction of in-depth microscopic and molecular analysis, including sample material, patient cohorts, and sample number. Microscopic analysis (top panel): analysis was performed on methacarn-fixed cecal biopsies (endoscopically BF+, BF, and areas without biofilm from BF+ patients [Distal-Bx]), 3 adjacent sections from each biopsy were processed for DAPI/FISH, H&E, and PAS analysis. Confocal microscopy images were obtained from all areas of the whole section with visible bacteria in the DAPI channel. Each image was subjected to artificial intelligence–assisted quantification of bacteria to calculate total number of bacteria normalized to length of epithelium per section (amount of bacteria); maximum density of bacteria in one 144.7 × 144.7 μm confocal microscopy image per section (bacterial density); number of bacteria 3 μm from the epithelium, normalized to length of epithelium per section (adherent bacteria); and maximum density of bacteria up to 3 μm distal from the epithelium in one 144 × 144 μm confocal microscopy image per section (adherent bacteria density). H&E-stained sections were analyzed for the whole length of the epithelium (for normalization) and maximum width of H&E surface layer on top of epithelium per section (surface layer). PAS-stained sections were analyzed for average and maximum width of PAS-stained surface layer on top of epithelium per section (average PAS layer height, maximum PAS layer height). 16S rRNA gene amplicon sequencing (bottom left panel) was performed from snap-frozen cecal biopsies (BF+ and BF and areas without biofilm from BF+ patients [Distal-Bx]) and stool samples (BF+ and BF). Metabolomics (bottom right panel) was performed on snap-frozen ileal biopsies (BF+ and BF). BA analysis (bottom right panel) was performed on stool samples (BF+ and BF).
Supplementary Figure 4
Endoscopically visible biofilms consist of dense bacterial agglomerations independent of disease. (A–H) Comparison between BF+ biopsies (orange) and BF biopsies (blue), separated for disease cohort (same patients as Figure 1). (I) Description of biopsy locations: BF+ biopsies (orange) were taken from areas in the cecum or ascending colon with endoscopically visible biofilm, BF biopsies (blue) were taken in the same area of BF patients. Distal-Bx (biopsies) (yellow) were taken from BF+ patients in distal areas without endoscopically visible biofilms. (J–R) Same samples as for Supplementary Figure 4A–H with addition of data from Distal-Bx (yellow). (A, J) Total number of bacteria normalized to length of epithelium per section. (B, K) Maximum density of bacteria in one 144.7 × 144.7 μm confocal microscopy image per section. (C, L) Maximum width of methacarn-fixed H&E surface layer on top of epithelium in each section. (D, M) Ratio of quantitative polymerase chain reaction determined 16S rRNA gene copies to total DNA of biopsies. (E, N) Number of bacteria 3 μm from the epithelium, normalized to length of epithelium per section. (F, O) Maximum density of bacteria up to 3 μm distal from the epithelium in one 144 × 144 μm confocal microscopy image per section. (G, P) Maximum width of methacarn-fixed PAS surface layer on top of epithelium per section. (H, Q) Average width of methacarn-fixed PAS-stained surface layer on top of epithelium per section. (R) Percentage of biopsies with more than 109 · mL–1 bacteria invading the mucus layer in at least one 144.7 × 144.7 μm confocal microscopy image. (S) Correlation matrix with Pearson correlation coefficients of microscopic data of BF+ biopsies and BF biopsies, P values ≤ .05 have been colored. (T) Location of endoscopically visible biofilms in IBS, UC, and controls. ∗P ≤ .05; ∗∗P ≤ 0.01; ∗∗∗P ≤ .001. (A, B, E, F, J, K, N, O) Zero values are displayed in direct contact with the x-axis, as they are not defined on a log-scale. (AC, E, F, JL, N, O) Kruskal-Wallis test with Dunn’s multiple comparison test, (D, G, H, M, P, Q) 1-way analysis of variance with Turkey’s multiple comparison test on log-transformed data, (R) Fisher exact test with Bonferroni correction for multiple comparisons. (A–C, E–L, N–S) n = 37 BF+, n = 47 BF, n = 30 Distal-Bx (D, M) n = 42 BF+, n = 56 BF, n = 35 Distal-Bx.
Supplementary Figure 5
Sankey diagram of longitudinal biofilm status. Biofilm status of longitudinal patients in the primary patient cohort, first time point on the left and second time point on the right side. Patient flows have been colored according to biofilm status and include disease cohorts, BF+ on both time points (orange), BF+ on the first time point and BF on the second time point (light orange), and BF on both time points (blue). Other represents GI infection– and chemotherapy-induced diarrhea, n = 19 patients, average time between colonoscopies was 7 months.
Supplementary Figure 6
Microbial biofilm composition separated for disease. (A) Samples from Figure 2 with multidimensional scaling plot of generalized UniFrac distances from BF+ (circle) and BF patients (triangle) colored for disease cohort. (B) Intra-patient comparison of stool samples (black), BF+ biopsies (orange), and Distal-Bx (yellow). (C) Samples from Figure 2 split for disease cohorts. (D) Comparison of R. gnavus group relative abundance and bacterial richness between BF+ biopsies (orange) and BF biopsies (blue), split for disease cohort (using data from Figure 2B and E). (F) Correlation of colonic R. gnavus OTU relative abundance with richness and Shannon diversity of colonic biopsies. (A–C) P value represents a permutational multivariate analysis of variance of generalized unifrac distance matrices. (D, E) Kruskal-Wallis rank sum test with Benjamini-Hochberg correction for multiple comparisons. (F) Pearson correlation of centered log-ratio transformed OTU abundance, richness, and Shannon diversity. (A, C–F) n = 35 BF+, n = 38 BF (B) n = 22 BF+, n = 22 Distal-Bx, n = 22 BF+ stool samples.
Supplementary Figure 7
Fecal BA levels of BF+ and BF patients with IBS. (A) Levels of primary BAs in stool samples of BF+ (orange) and BF (blue) patients with IBS. (B) Levels of secondary BA in stool samples of BF+ and BF patients with IBS. (C) Levels of tauro- and glycol-conjugated BA in stool samples of BF+ and BF patients with IBS. (D) Correlation of colonic R. gnavus OTU relative abundance and fecal BA levels. (A–C) Mann Whitney U test with Bonferroni correction for multiple comparisons. (D) Pearson correlation of centered log-ratio transformed OTU abundance and fecal BA levels. (A–C) n = 14 BF+, n = 14 BF, (D) n = 40.
Supplementary Figure 8
Exploratory correlation matrices of calprotectin, microbiome, microscopic, and BA data in IBS and UC. Correlation matrices with Pearson correlation coefficients for patients with IBS (top panel) and patients with UC (bottom panel). Microscopic data from colonic biopsies (average and maximum width of methacarn-fixed PAS-stained surface layer on top of epithelium per section [average PAS layer height, maximum PAS layer height], maximum width of methacarn-fixed H&E surface layer on top of epithelium per section [surface layer], total number of bacteria normalized to length of epithelium per section [amount of bacteria], maximum density of bacteria in one 144.7 × 144.7 μm confocal microscopy image per section [bacterial density], number of bacteria 3 μm from the epithelium, normalized to length of epithelium per section [adherent bacteria], maximum density of bacteria up to 3 μm distal from the epithelium in one 144 × 144 μm confocal microscopy image per section [adherent bacteria density]), ratio of quantitative polymerase chain reaction determined 16S rRNA gene copies to total DNA of biopsies (DNA ratio), microbiome data from colonic biopsies (relative abundance of OTU_tq6_57b belonging to the Faecalibacterium genus and OTU_9qp_ahy belonging to the Escherichia/Shigella genus, microbiome richness and Shannon diversity), BA data from stool samples (total BA, cholic acid, chenodeoxycholic acid, deoxycholic acid, lithocholic acid, and UCDA), calprotectin data from stool samples (calprotectin). Positive correlation coefficients in blue, negative correlation coefficients in red. P values ≤.05 have been colored. (A) n = 61. (B) n = 30.
Supplementary Figure 9
Biofilms show disease-specific changes on ASV level. ASV-based differences (as determined with DESeq2) between BF and BF+ biopsies, between BF and areas without biofilm from BF+ patients (Distal-Bx), stool from BF+ and BF patients, in each disease cohort. Additional comparison between UC inflamed areas of BF+ (inflamed BF+) and BF patients. Size of dots represent fold-change, full dots represent up-regulation in biofilm setting, empty dots represent down-regulation. Dots are colored based on bacterial phylum, bacterial taxonomies (genera and species) have been assigned to each ASV based on the SILVA reference database. Only significant findings (P < .05 after correction for multiple comparisons) are shown. n = 35 BF+, n = 38 BF, n = 30 Distal-Bx, n = 5 inflamed BF+, n = 6 inflamed BF, n = 51 BF+ stool samples, n = 54 BF stool samples.

Comment in

References

    1. Kaplan G.G. The global burden of IBD: from 2015 to 2025. Nat Rev Gastroenterol Hepatol. 2015;12:720–727. - PubMed
    1. Canavan C., West J., Card T. Review article: the economic impact of the irritable bowel syndrome. Aliment Pharmacol Ther. 2014;40:1023–1034. - PubMed
    1. Nguyen N.H., Khera R., Ohno-Machado L. Annual burden and costs of hospitalization for high-need, high-cost patients with chronic gastrointestinal and liver diseases. Clin Gastroenterol Hepatol. 2018;16:1284–1292.e30. - PMC - PubMed
    1. Halpert A. Irritable bowel syndrome: patient-provider interaction and patient education. J Clin Med. 2018;7:3. - PMC - PubMed
    1. Chassaing B., Koren O., Goodrich J.K. Dietary emulsifiers impact the mouse gut microbiota promoting colitis and metabolic syndrome. Nature. 2015;519:92–96. - PMC - PubMed

Supplementary References

    1. Lang M., Baumgartner M., Rozalska A. Crypt residing bacteria and proximal colonic carcinogenesis in a mouse model of Lynch syndrome. Int J Cancer. 2020;147:2316–2326. - PMC - PubMed
    1. Swidsinski A., Loening-Baucke V., Bengmark S. Bacterial Biofilm suppression with antibiotics for ulcerative and indeterminate colitis: consequences of aggressive treatment. Archives of Medical Research. 2008;39:198–204. - PubMed
    1. Brown M.R., Gilbert P. Sensitivity of biofilms to antimicrobial agents. J Appl Bacteriol. 1993;74(Suppl):87S–97S. - PubMed
    1. Falk T., Mai D., Bensch R. U-Net: deep learning for cell counting, detection, and morphometry. Nat Methods. 2019;16:67–70. - PubMed
    1. Herbold C.W., Pelikan C., Kuzyk O. A flexible and economical barcoding approach for highly multiplexed amplicon sequencing of diverse target genes. Front Microbiol. 2015;6:731. - PMC - PubMed

Publication types

MeSH terms