Comparative Study
. 2021 Nov:138:104205.
doi: 10.1016/j.mvr.2021.104205. Epub 2021 Jun 17.

Morphological characterization of Etv2 vascular explants using fractal analysis and atomic force microscopy

Affiliations
Comparative Study

Morphological characterization of Etv2 vascular explants using fractal analysis and atomic force microscopy

Robert P Adelson et al. Microvasc Res. 2021 Nov.

Abstract

The rapid engraftment of vascular networks is critical for functional incorporation of tissue explants. However, existing methods for inducing angiogenesis utilize approaches that yield vasculature with poor temporal stability or inadequate mechanical integrity, which reduce their robustness in vivo. The transcription factor Ets variant 2 (Etv2) specifies embryonic hematopoietic and vascular endothelial cell (EC) development, and is transiently reactivated during postnatal vascular regeneration and tumor angiogenesis. This study investigates the role for Etv2 upregulation in forming stable vascular beds both in vitro and in vivo. Control and Etv2+ prototypical fetal-derived human umbilical vein ECs (HUVECs) and adult ECs were angiogenically grown into vascular beds. These vessel beds were characterized using fractal dimension and lacunarity, to quantify their branching complexity and space-filling homogeneity, respectively. Atomic force microscopy (AFM) was used to explore whether greater complexity and homogeneity lead to more mechanically stable vessels. Additionally, markers of EC integrity were used to probe for mechanistic clues. Etv2+ HUVECs exhibit greater branching, vessel density, and structural homogeneity, and decreased stiffness in vitro and in vivo, indicating a greater propensity for stable vessel formation. When co-cultured with colon tumor organoid tissue, Etv2+ HUVECs had decreased fractal dimension and lacunarity compared to Etv2+ HUVECs cultured alone, indicating that vessel density and homogeneity of vessel spacing increased due to the presence of Etv2. This study sets forth the novel concept that fractal dimension, lacunarity, and AFM are as informative as conventional angiogenic measurements, including vessel branching and density, to assess vascular perfusion and stability.

Keywords: Adipose-derived endothelial cells; Angiogenesis; Atomic force microscopy; Ets variant 2; F-actin; Fractal dimension; HUVECs; Lacunarity; Vascular engraftment.


Figures

Figure 1.
Figure 1.. Illustration explaining fractal dimension, and the steps in computing fractal dimension from in vitro and in vivo vessel networks.
(a) Three steps in the construction of the Koch snowflake. Iteration 1 is an equilateral triangle, where each side is composed of three equal thirds. The fractal dimension (D) is 1. Iteration 2 is a hexagram, where each side is composed of four of the segments from iteration 1, making D 1.262. In iteration 3, the same process as in iteration 2 is repeated, with each of the four segments from iteration 2 elongated by 1/3; D remains 1.262. (b) High-resolution layer from a z-stack image file of a healthy Etv2+ vessel network in vitro, following removal of non-vessel pixels using ImageJ. (c) The in vitro image following binarization in ImageJ. (d) In the box-counting method for calculating D, a grid of a known r scale is overlaid on the in vitro image, and the number of boxes containing foreground pixels is counted. (e) From various grids as in (d), a log-log plot of r versus Nr is generated for the in vitro image, and D is the additive inverse of the slope of the linear regression line, in this case approximately 1.56. The lacunarity is approximately 0.62. (f) High-resolution layer from a z-stack image file of a healthy Etv2+ vessel network in vivo, following removal of non-vessel pixels using ImageJ. (g) The same in vivo image following binarization in ImageJ. (h) In the box-counting method for calculating D, a grid of a known r scale is overlaid on the in vivo image, and the number of boxes containing foreground pixels is counted. (i) From various grids as in (h), a log-log plot of r versus Nr is generated for the in vivo image, and D is the additive inverse of the slope of the linear regression line, in this case approximately 1.67. The lacunarity is approximately 0.40.
Figure 2.
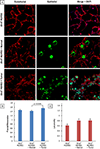
Figure 2.. Staining and calculation of fractal dimension and lacunarity in vitro.
(a) Stained ECs, epithelial cells, and composite images with DAPI staining, of vessels grown in vitro from Etv2+ HUVECs, Etv2+ HUVECs with normal colon tissue, and Etv2+ HUVECs with colon tumor organoids. (b) Fractal dimension, and (c) lacunarity, for transcriptionally modified (Etv2+) HUVECs grown in vitro. From left to right in each plot: Etv2 HUVECs (Etv2+ HUVECs cultured alone in vitro, n = 3 replicates); Etv2 HUVEC + Normal (the co-culture of normal colon tissue with Etv2+ HUVECs, n = 6); and Etv2 HUVEC + Tumor (the co-culture of colon tumor organoids with Etv2+ HUVECs, n = 6). In each plot, the values are expression as mean ± standard deviation, and statistical differences in fractal dimension and lacunarity were tested using a two-tailed t-test with a 99% confidence interval.
Figure 3.
Figure 3.. Staining and calculation of fractal dimension and lacunarity in vivo.
(a) Stained ECs and composite images with DAPI staining, of vessels grown in vivo from Etv2+ HUVECs, Etv2+ HUVECs with colon tumor organoids, and control HUVECs with colon tumor organoids. (b) Fractal dimension, and (c) lacunarity, for transcriptionally modified (Etv2+) HUVECs grown in vivo in a colon tissue plug, following 5 months of growth. From left to right in each plot: Etv2 HUVEC (Etv2+ HUVECs grown without co-culture in vivo, n = 6); Etv2+ HUVEC + Tumor (Etv2+ HUVECs grown with colon tumor organoids in vivo, n = 9); and Control HUVEC + Tumor (normal HUVECs grown with colon tumor organoids in vivo, n = 8). In each plot, the values are expression as mean ± standard deviation, and statistical differences in fractal dimension and lacunarity were tested using a two-tailed t-test with a 99% confidence interval.
Figure 4.
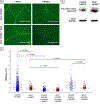
Figure 4.. Staining, fractal dimension, and lacunarity over time.
(a) Stained composite z-stack images (ECs and DAPI) of vessels grown in vivo from Etv2+ HUVECs at time points of 1 week, 1 month, 2 months, and 5 months, and from control HUVECs at the same time points. (b) Fractal dimension, and (c) lacunarity, for transcriptionally modified (Etv2+) and control HUVECs grown in vivo, at those four time points. For the Etv2+ HUVEC vessels, the time points were: 1 week (n = 18), 1 month (n = 14), 2 months (n = 13), and 5 months (n = 6). For the control HUVEC vessels, the time points were: 1 week (n = 9), 1 month (n = 15), 2 months (n = 13), and 5 months (n = 5). * = Significant at 99% confidence. In each plot, the values are expression as mean ± standard deviation.
Figure 5.
Figure 5.. Characterization of vessel networks with and without treatment with Rap1 inhibitor.
(a) Confocal microscopy images of Etv2+ vessel networks with and without Rap1 treatment, following 1 week and 1 month of growth following application of Rap1. There was substantial vessel thinning in the presence of Rap1 over time. (b) Relative expression levels of Rap1-GTP (the active form) and GAPDH in control (Etv2-) and Etv2+ HUVECs, as measured by western blot. The upregulation of Rap1-GEFs by Etv2 results in higher levels of Rap1 activity, demonstrated here by elevated levels of Rap1-GTP. GAPDH levels are essentially unchanged. (c) Stiffness values as measured by AFM testing of control and Etv2+ HUVECs, each cell type in the presence of a regulatory inhibitor (Rap1) dissolved in DMSO, and each cell type in the presence of DMSO only. Control HUVECs were significantly stiffer than Etv2+ HUVECs prior to treatment with Rap1. The difference in stiffness between control and Etv2+ HUVECs was insignificant following treatment with Rap1 in DMSO. The difference in stiffness was significant upon exposure to DMSO on its own, meaning the inhibitor solvent did not differentially affect the stiffness. The abbreviated box plots indicate the interquartile range and median for each condition. Statistical differences in fractal stiffness were tested using a two-tailed t-test with a 95% confidence interval.
Figure 6.
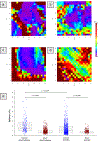
Figure 6.. Stiffness values measured by AFM.
The stiffnesses are mapped to position of the AFM probe for (a) a control HUVEC, (b) an Etv2+ HUVEC, (c) a control adult adipose EC, and (d) an Etv2+ adult adipose EC. Stiffness values measured by AFM testing, (e) using a spherical probe of (left to right) adult adipose control ECs, adult adipose Etv2+ ECs, control HUVECs, and Etv2+ HUVECs. Control cells were significantly stiffer than Etv2+ cells for both cell types, demonstrating that Etv2 resets the stiffness of the HUVECs to a younger phenotype. The abbreviated box plots indicate the interquartile range and median for each condition. Statistical differences in stiffness were tested using a two-tailed t-test with a 95% confidence interval.
Figure 7.
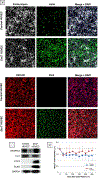
Figure 7.. Staining for markers of cell function and stability.
(a) Stained Etv2+ HUVECs and control HUVECs, exhibiting the relatively enhanced mechanical properties of Etv2+ HUVECS. Podocalyxin levels and distribution appear similar within the two groups. The level of F-actin is considerably higher in Etv2+ HUVECs, indicating a more robust network of microfilaments capable of supporting wider vessels with more branch points. Similarly, VE-cadherin (VECAD) levels are enhanced in Etv2+ HUVECs, due to the higher concentration of intercellular junctions in these vessel structures. Etv2 protein expression is definitively elevated in Etv2+ HUVECS compared to the controls. (b) Relative expression levels of five key proteins (VEGFR-2, FLI1, ETV2, FLAG, GAPDH) in control (Etv2-) and Etv2+ HUVECs, as measured by western blot. The presence of FLAG and Etv2 was expected in Etv2+ HUVECs. (c) Mean F-actin diameter in control HUVECs and Etv2+ HUVECs at 25-minute intervals after low-density cell plating. Compared to starting diameter, F-actin fibers decreased in diameter significantly less in Etv2+ HUVECs (about 7.28%) compared to in control HUVECs (about 28.37%). Additionally, Etv2+ HUVEC F-actin diameter rebounded quickly (within 25 minutes) of the initial drop in diameter. In the plot, the values are expression as mean ± standard deviation.

References

    1. Baltrunaite K, et al., 2017. ETS transcription factors Etv2 and Fli1b are required for tumor angiogenesis. Angiogenesis. 20, 307–323. - PMC - PubMed
    1. Cait J, et al., 2019. Podocalyxin is required for maintaining blood-brain barrier function during acute inflammation. PNAS. 116, 4518–27. - PMC - PubMed
    1. Cao J, et al., 2017. Polarized actin and VE-cadherin dynamics regulate junctional remodelling and cell migration during sprouting angiogenesis. Nat Commun. 8, 2210. - PMC - PubMed
    1. Captur G, et al., 2013. Quantification of left ventricular trabeculae using fractal analysis. J Cardiovasc Magn Reson. 15, 36. - PMC - PubMed
    1. Cárdenas-Pérez, et al., 2018. Recent advances in atomic force microscopy for assessing the nanomechanical properties of food materials. Trends Food Sci Technol. 87, 59–72.

Publication types

MeSH terms

LinkOut - more resources