. 2021 Aug 19;184(17):4380-4391.e14.
doi: 10.1016/j.cell.2021.06.008. Epub 2021 Jun 9.

Identification of novel bat coronaviruses sheds light on the evolutionary origins of SARS-CoV-2 and related viruses

Affiliations

Identification of novel bat coronaviruses sheds light on the evolutionary origins of SARS-CoV-2 and related viruses

Hong Zhou et al. Cell. .

Abstract

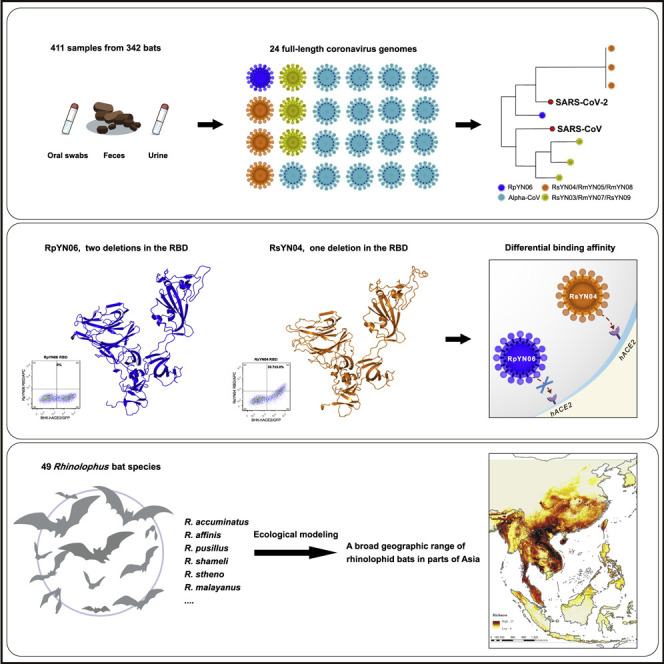
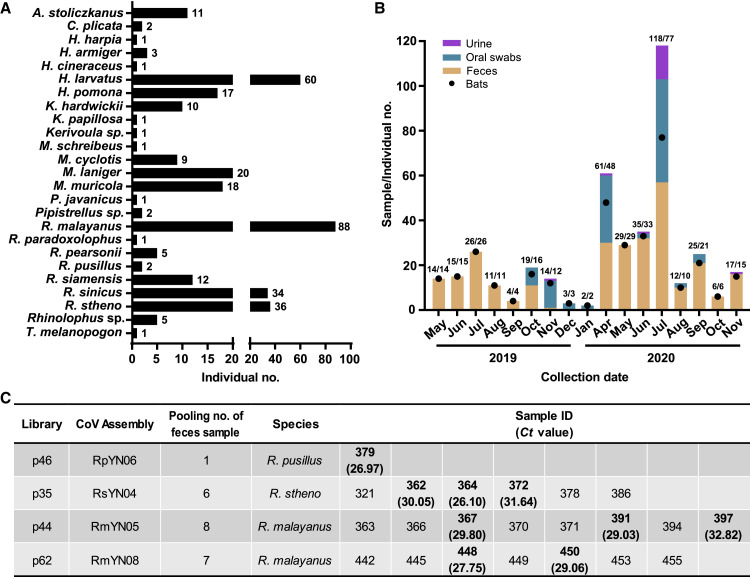
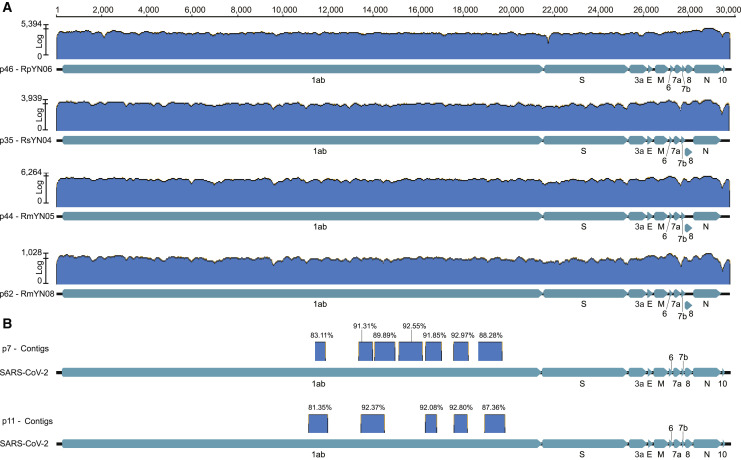
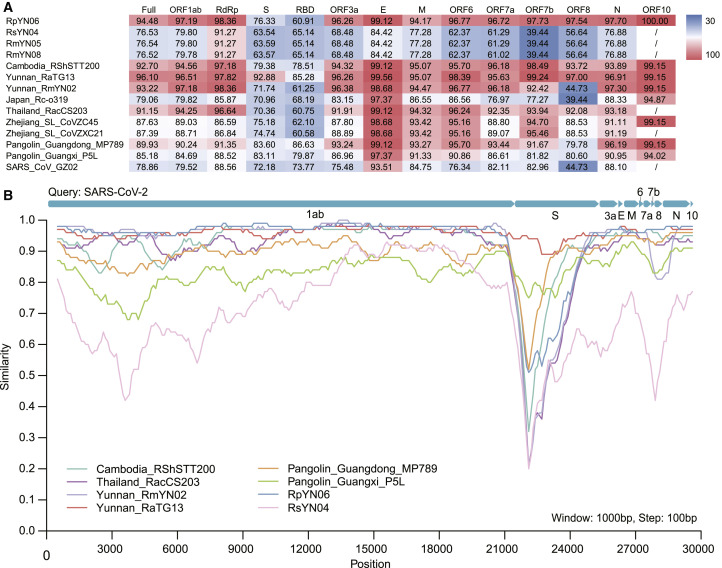
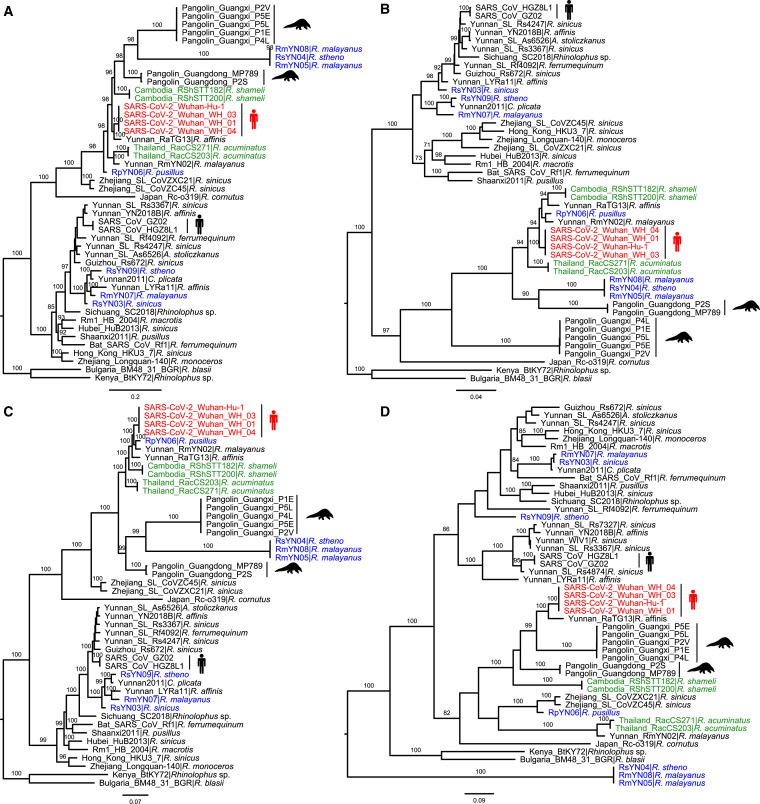
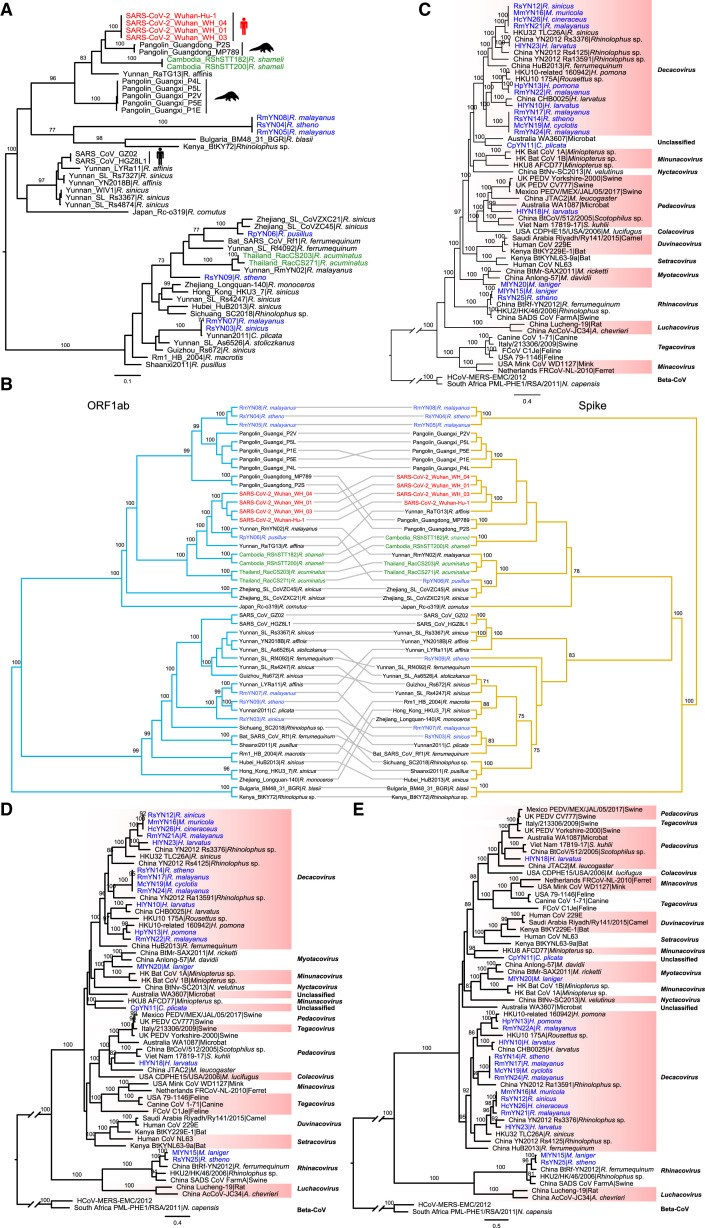
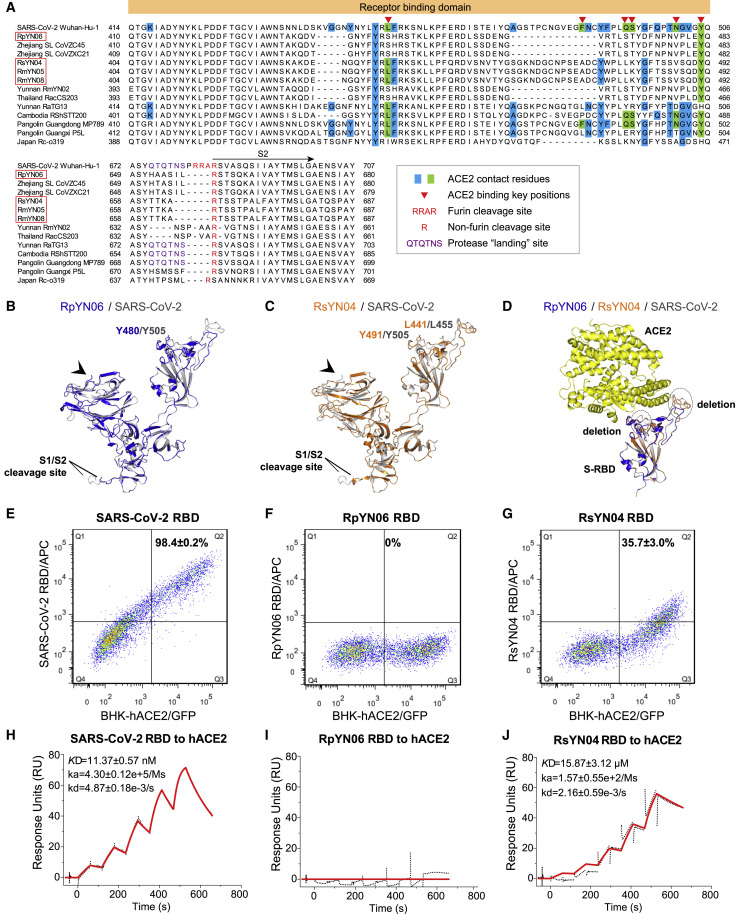
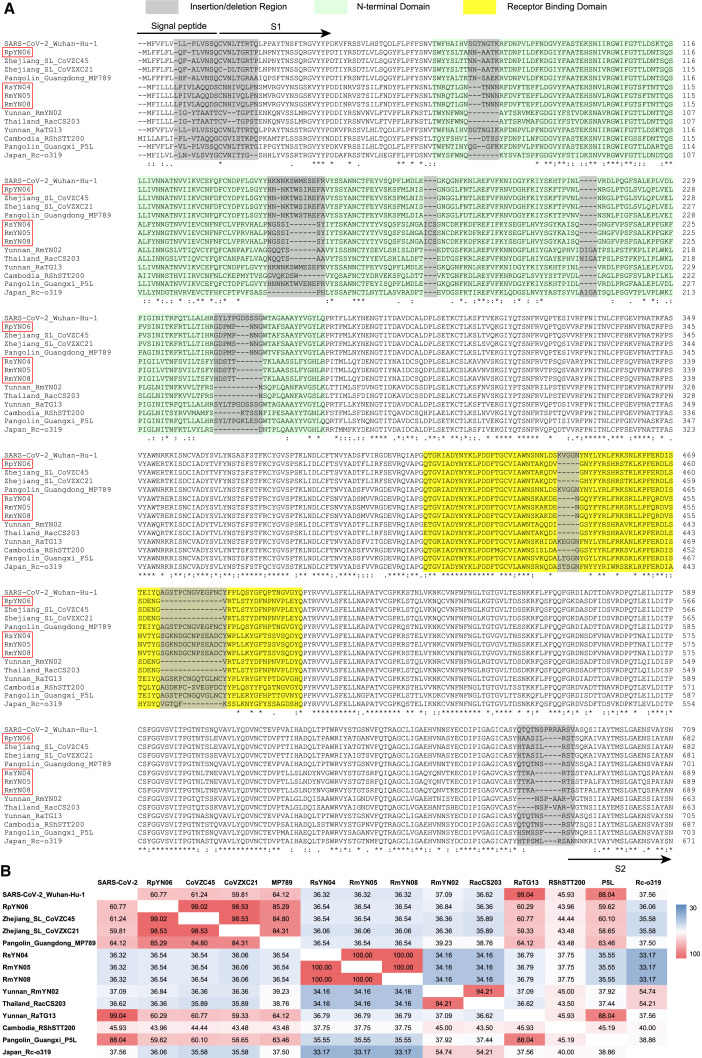
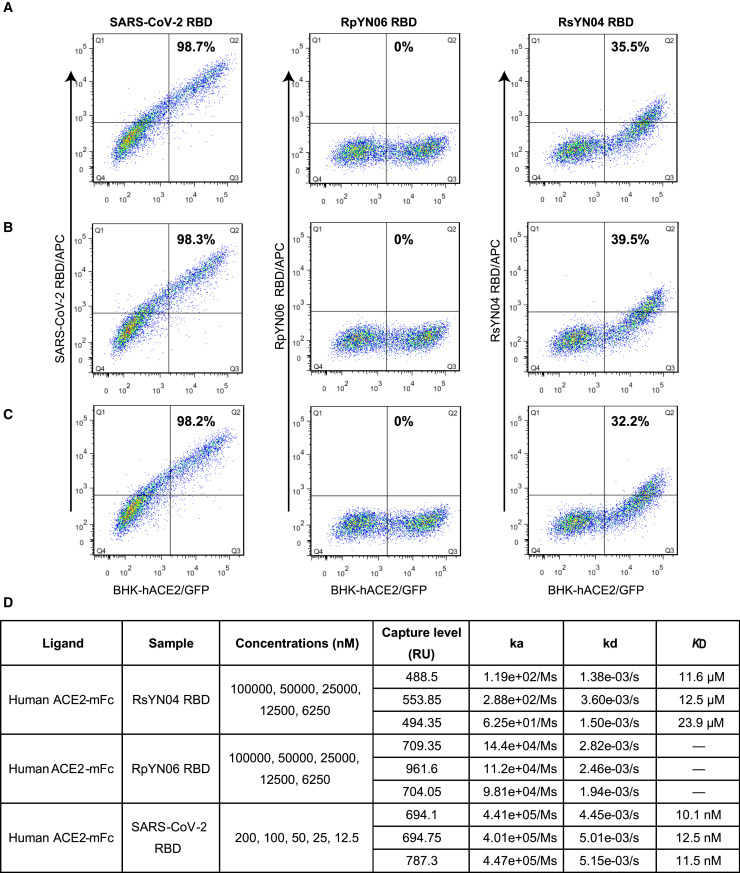
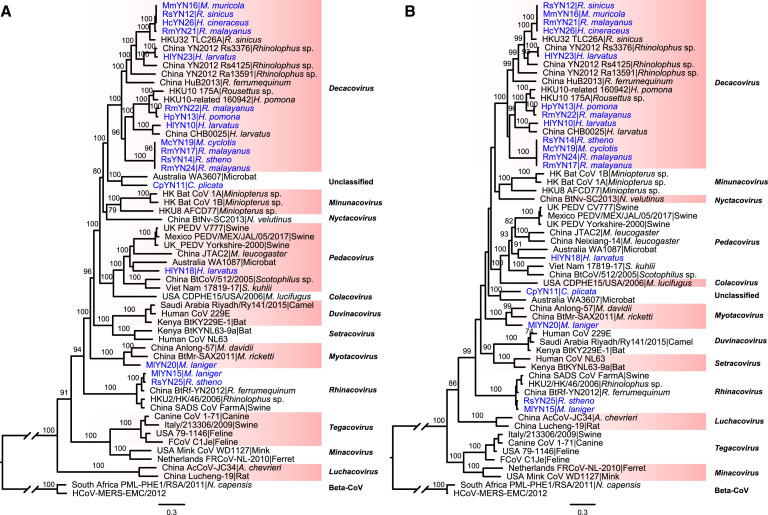
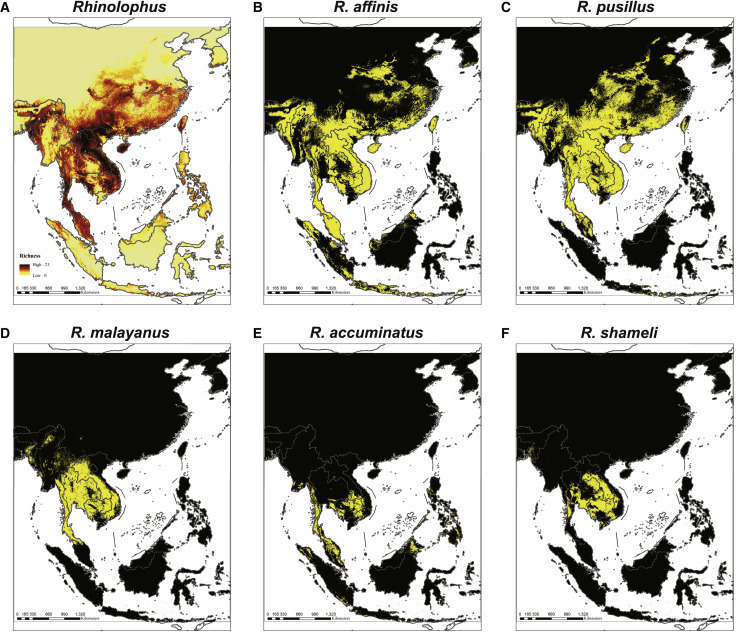
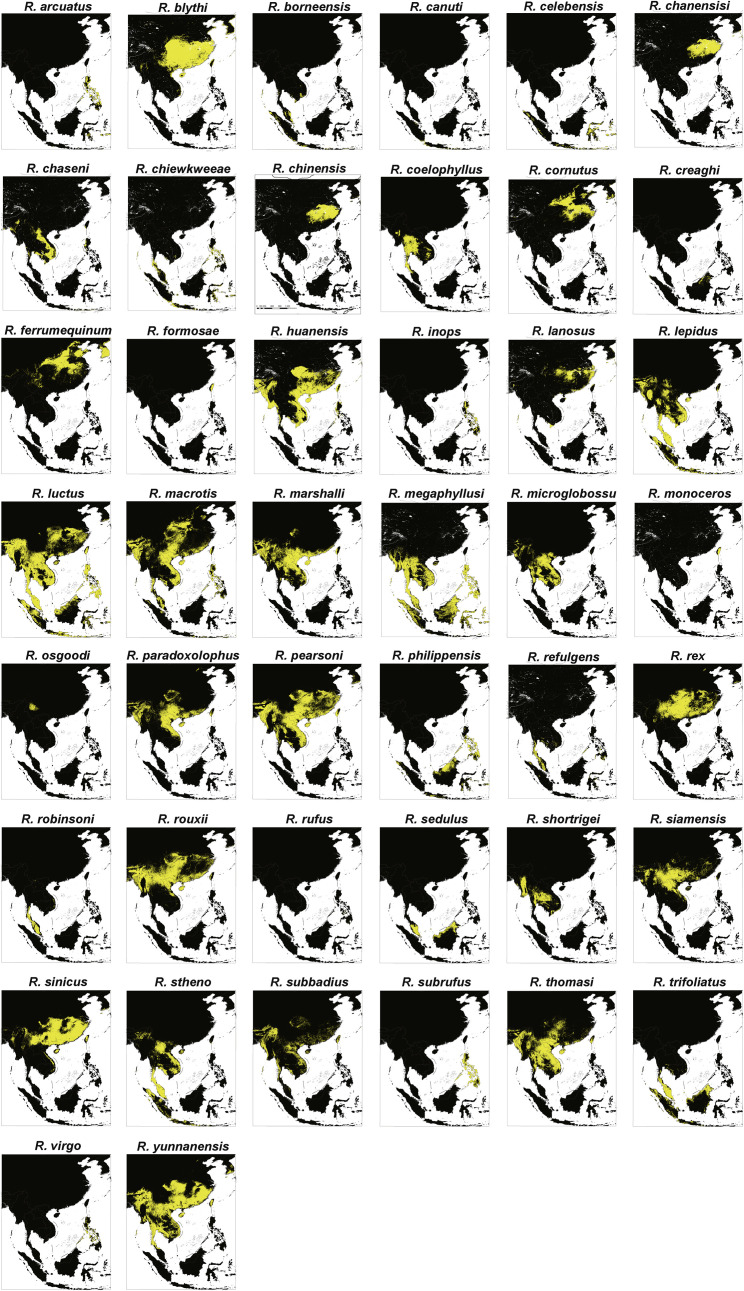
Despite the discovery of animal coronaviruses related to SARS-CoV-2, the evolutionary origins of this virus are elusive. We describe a meta-transcriptomic study of 411 bat samples collected from a small geographical region in Yunnan province, China, between May 2019 and November 2020. We identified 24 full-length coronavirus genomes, including four novel SARS-CoV-2-related and three SARS-CoV-related viruses. Rhinolophus pusillus virus RpYN06 was the closest relative of SARS-CoV-2 in most of the genome, although it possessed a more divergent spike gene. The other three SARS-CoV-2-related coronaviruses carried a genetically distinct spike gene that could weakly bind to the hACE2 receptor in vitro. Ecological modeling predicted the co-existence of up to 23 Rhinolophus bat species, with the largest contiguous hotspots extending from South Laos and Vietnam to southern China. Our study highlights the remarkable diversity of bat coronaviruses at the local scale, including close relatives of both SARS-CoV-2 and SARS-CoV.

Keywords: COVID-19; SARS-CoV-2; bats; coronavirus; evolution; phylogeny; porcine epidemic diarrhea virus; spike protein; swine acute diarrhea syndrome.


Conflict of interest statement

Declaration of interests The authors declare no competing interests.

Figures

None
Graphical abstract
Figure 1
Figure 1
Sampling information and detection of SARS-CoV-2-like viruses in individual bat fecal samples. (A) Sample numbers of different bat species captured live in Yunnan province from May 2019 to November 2020. (B) Numbers of samples collected from different time points (orange column - feces; green - oral swab; light purple - urine). The numbers of individual bats are shown with black dots and relate to the y axis. The associated numbers are in the form sample numbers/number of individual bats. (C) Identification of SARS-CoV-2-like virus positive samples using qPCR. See also Tables S1 and S4.
Figure S1
Figure S1
Detection of SARS-CoV-2 related reads and contigs from sequencing data. Related to Figure 2 and Table S2. (A) Reads mapping to the four different SARS-CoV-2 related coronaviruses for which full-length genomes were obtained. (B) The blue blocks represent SARS-CoV-2 related contigs in the two libraries. The percentage value shown is the sequence identity between the contigs and the SARS-CoV-2 reference genome (NC_045512).
Figure 2
Figure 2
Sequence identities between SARS-CoV-2 and representative sarbecoviruses. (A) Pairwise sequence identities between SARS-CoV-2 (reference genome: NC_045512) and SARS-CoV-2 related coronaviruses. The degree of sequence similarity is highlighted by the shading, with cells shaded red denoting the highest identities. (B) Whole genome sequence similarity plot of nine SARS-CoV-2 related coronaviruses using SARS-CoV-2 as a query. The analysis was performed using Simplot, with a window size of 1,000 bp and a step size of 100 bp. See also Tables S3 and S5.
Figure 3
Figure 3
Phylogenetic analysis of SARS-CoV-2 and representative sarbecoviruses. Nucleotide sequence phylogenetic trees of (A) the full-length virus genome, (B) the RdRp gene, (C) the ORF1ab, and (D) the spike gene. The phylogenetic trees in panels A-C were rooted using the bat viruses Kenya_BtKY72 (KY352407) and Bulgaria_BM48_31_BGR (GU190215) as outgroups, whereas the tree in panel D was midpoint rooted. Phylogenetic analysis was performed using RAxML (Stamatakis 2014) with 1,000 bootstrap replicates, employing the GTR nucleotide substitution model. Branch lengths are scaled according to the number of nucleotide substitutions per site. Viruses are color-coded as follows: red - SARS-CoV-2; blue - new genomes generated in this study; green - recently published sequences from Thailand and Cambodia. See also Table S5.
Figure S2
Figure S2
Phylogenetic analysis of the representative betacoronaviruses and alphacoronaviruses. Related to Figures 3 and 5. (A) Phylogenetic analysis of the RBD regions of SARS-CoV-2 and representative betacoronaviruses (the tree is midpoint rooted for clarity only). (B) Tanglegram connecting the ORF1ab and Spike gene phylogenies of representative sarbecoviruses. TreeMap3 was used to visualize the tanglegram, displaying topological similarities and incongruences between the ORF1ab and Spike gene (employing the ‘untangle’ function). (C, D) Phylogenetic analysis of the ORF1ab and Spike gene sequences of representative alphacoronaviruses from different subgenera. Phylogenetic analysis was performed with the RAxML program employing 1,000 bootstrap replicates, employing the GTR model of nucleotide substitution. Branch lengths are scaled according to the number of nucleotide substitutions per site and the tree is rooted using two betacoronaviruses as outgroups; South_Africa_PML-PHE1/RSA/2011 (KC869678.4) and HCoV-MERS-EMC (NC_019843). (E) The Spike protein (amino acid) tree. Phylogenetic analysis was performed using RAxML with 1,000 bootstrap replicates, employing the PROTGAMMAJTT model of amino acid substitution. Branch lengths are scaled according to the number of substitutions per site and both trees were rooted using two betacoronaviruses as outgroups; South_Africa_PML-PHE1/RSA/2011 (KC869678.4) and HCoV-MERS-EMC (NC_019843).
Figure 4
Figure 4
Molecular characterizations of the RBD and homology modeling of the S1 subunit of the novel sarbecoviruses. (A) Sequence alignment of the RBD region of SARS-CoV-2 and representative betacoronavirus genomes (annotated following Holmes et al., 2021). The QTQTNS motif is adjacent to the furin cleavage site, and this concentration of polar amino acids may provide a favorable landing site for furin and other proteases. (B-C) Homology modeling and structural comparison of the S1 subunit between (B) RpYN06 and SARS-CoV-2, and (C) RsYN04 and SARS-CoV-2. (D) Structural similarity between the RpYN06:hACE2, RsYN04:hACE2 and SARS-CoV-2-RBD:hACE2 complexes. The three-dimensional structures of the S1 from RpYN06, RsYN04 and SARS-CoV-2 were modeled using the Swiss-Model program (Waterhouse et al., 2018) employing PDB: 7A94.1 as the template. The S1 domains of RpYN06, RsYN04 and SARS-CoV-2 are colored blue, orange and gray, respectively. The hACE2 are colored yellow. The deletions in RpYN06 and/or RsYN04 are highlighted. The NTD (black arrow heads) is marked. (E-G) BHK-21 cells transfected with hACE2 (BHK-hACE2/GFP) were stained with SARS-CoV-2 RBD (E), RpYN06 RBD (F) and RsYN04 RBD (G), respectively. All experiments were performed three times; one representative of each experiment was shown. (H-J) The supernatant of HEK293T cells containing hACE2-mFc was flowed through a CM5 chip, which was pre-immobilized with anti-mFc antibody, and then a gradient concentration of the indicated RBD was flowed through the chip. The RUs were recorded. (H) hACE2 binding to the SARS-CoV-2 RBD. (I) hACE2 binding to the RpYN06 RBD. (J) hACE2 binding to the RsYN04 RBD. The values shown are the mean ± SD of three independent experiments. See also Figures S3 and S4.
Figure S3
Figure S3
Molecular characterization and pairwise comparison of SARS-CoV-2 and related coronaviruses. Related to Figures 2 and 4. (A) Molecular characterization of the spike gene of SARS-CoV-2 and related coronavirus. The viruses in the red box denote the SARS-CoV-2 related coronaviruses identified in this study. The amino acid sites in the gray boxes represent regions with insertion or deletion events (following Holmes et al., 2021). The pale green region represents the N-terminal domain. The yellow box denotes the Receptor Binding Domain (RBD). (B) Pairwise sequence identities of the N-terminal domains between SARS-CoV-2 (reference genome: NC_045512) and SARS-CoV-2 related coronaviruses. The degree of sequence similarity is highlighted by the shading, with cells shaded red denoting the highest identities.
Figure S4
Figure S4
FACS and SPR results of the binding between hACE2 and the RBDs of SARS-CoV-2, RsYN04, RpYN06. Related to Figure 4. (A-C) BHK-21 cells transfected with hACE2 (BHK-hACE2/GFP) were stained with SARS-CoV-2 RBD (left), RpYN06 RBD (middle) and RsYN04 RBD (right) at a final concentration of 30 μg/mL. A, B and C indicate the results from three experiments. The proportion displayed in the upper right of each panel was calculated from the formulation Q2/(Q2+Q3). The three results were applied to calculate the value of mean ± SD that displayed in Figure 4E-G. (D) The supernatant of HEK293T cells containing hACE2-mFc was passed through a CM5 chip, which was pre-immobilized with anti-mFc antibody, and then a gradient concentration of the indicated RBD was flowed through the chip. The RUs were recorded. The gradient concentration of the samples used in each experiment and calculated ka, kd, and KD were listed. The results were applied to calculate the value of mean ± SD that displayed in Figure 4H-J.
Figure 5
Figure 5
Phylogenetic analysis of 17 novel alphacoronaviruses and representative viruses from different subgenera. Phylogenetic trees of (A) the full-length virus genome and (B) the RdRp gene of alphacoronaviruses. Phylogenetic analysis was performed using RAxML(Stamatakis 2014) with 1,000 bootstrap replicates, employing the GTR nucleotide substitution model. The two trees were rooted using two betacoronaviruses as outgroups - South_Africa_PML-PHE1/RSA/2011 (KC869678.4) and HCoV-MERS-EMC (NC_019843). Branch lengths are scaled according to the number of substitutions per site. See also Figure S2.
Figure 6
Figure 6
Ecological modeling the geographical distribution of 49 rhinolophid bat species. (A) Models of 49 Rhinolophus bat species that predict their diversity in five regions covering mainland Southeast Asia, Philippines, Java-Sumatra, Borneo and Sulawesi-Moluccas. The map color represents species richness, with up to 23 species projected to co-exist. (B-F) Location distribution of (B) the RaTG13 host species R. affinis, (C) the RpYN06 host species R. pusillus, (D) the RmYN02 host species R. malayanus, (E) the RacCS203 host species R. accuminatus, and (F) the STT182 and STT200 host species R. shameli. The yellow region represents the predicted range of each species. See also Figure S5.
Figure S5
Figure S5
Distribution maps of 44 additional Rhinolophus species in Southeast Asia regions. Related to Figure 6.

Comment in

References

    1. Allen T., Murray K.A., Zambrana-Torrelio C., Morse S.S., Rondinini C., Di Marco M., Breit N., Olival K.J., Daszak P. Global hotspots and correlates of emerging zoonotic diseases. Nat. Commun. 2017;8:1124–1133. - PMC - PubMed
    1. Anthony S.J., Johnson C.K., Greig D.J., Kramer S., Che X., Wells H., Hicks A.L., Joly D.O., Wolfe N.D., Daszak P., et al. PREDICT Consortium Global patterns in coronavirus diversity. Virus Evol. 2017;3:vex012. - PMC - PubMed
    1. Camacho C., Coulouris G., Avagyan V., Ma N., Papadopoulos J., Bealer K., Madden T.L. BLAST+: architecture and applications. BMC Bioinformatics. 2009;10:421–429. - PMC - PubMed
    1. Chan J.F., To K.K., Tse H., Jin D.Y., Yuen K.Y. Interspecies transmission and emergence of novel viruses: lessons from bats and birds. Trends Microbiol. 2013;21:544–555. - PMC - PubMed
    1. Charleston M.A. 2011. TreeMap 3b.http://sites.google.com/ site/cophylogeny accessed 14 Jul 2019.

Publication types

MeSH terms

Substances