. 2021 Jun 18;13(12):16445-16470.
doi: 10.18632/aging.203166. Epub 2021 Jun 18.

Identification and validation of inferior prognostic genes associated with immune signatures and chemotherapy outcome in acute myeloid leukemia

Affiliations

Identification and validation of inferior prognostic genes associated with immune signatures and chemotherapy outcome in acute myeloid leukemia

Jie Wang et al. Aging (Albany NY). .

Abstract

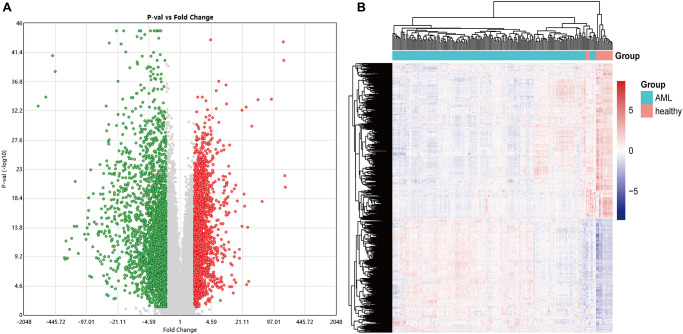
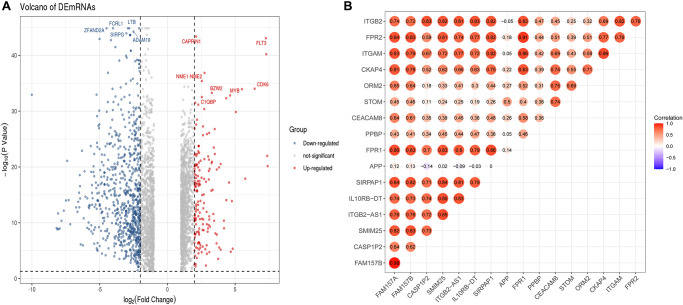
Acute myeloid leukemia (AML) is a group of heterogeneous hematological malignancies. We identified key genes as ITGAM and lncRNA ITGB2-AS1 through different bioinformatics tools. Furthermore, qPCR was performed to verify the expression level of essential genes in clinical samples. Retrospective research on 179 AML cases was used to investigate the relationship between the expression of ITGAM and the characteristics of AML. The critical gene relationship with immune infiltration in AML was estimated. The clinical validation and prognostic investigation showed that ITGAM, PPBP, and ITGB2-AS1 are highly expressed in AML (P < 0.001) and significantly associated with the overall survival in AML. Moreover, the retrospective research on 179 clinical cases showed that positive expression of ITGAM is substantially related to AML classification (P < 0.001), higher count of white blood cells (P < 0.01), and poor chemotherapy outcome (P < 0.05). Furthermore, based on grouping ITGAM as the high and low expression in TCGA-LAML profile, we found that genes in the highly expressed ITGAM group are mainly involved in immune infiltration and inflammation-related signaling pathways. Finally, we discovered that the expression level of ITGAM and lncRNA ITGB2-AS1 are not just closely related to the immune score and stromal score (P < 0.001) but also significantly positively correlated with various Immune signatures in AML (P < 0.001), indicating the association of these genes with immunosuppression in AML. The prediction of candidate drugs indicated that certain immunosuppressive drugs have potential therapeutic effects for AML. The critical genes could be used as potential biomarkers to evaluate the survival and prognosis of AML.

Keywords: acute myeloid leukaemia; immune infiltration; key genes; survival prognosis; weighted gene co-expression network analysis.


Conflict of interest statement

CONFLICTS OF INTEREST: The authors declare no conflicts of interest related to this study.

Figures

Figure 1
Figure 1
The overall analysis process of the present study.
Figure 2
Figure 2
The volcano and heatmap of the differentially expressed genes. (A) In the DEGs' volcano plot, red dots are up-regulated genes, blue is down-regulated, and grey is no different; (B) DEGs clustering heatmap, pink indicates healthy, and blue indicates AML. DEGs: differentially expressed genes.
Figure 3
Figure 3
Identification of modules related to clinical features of acute myeloid leukemia. (A) Analysis of the soft threshold (β) through the scale-free fitting index and mean connectivity; (B) Clustering dendrogram of the DEGs through dissimilarity coefficient, which shows nine gene co-expression modules AML. Gray modules indicate no co-expression between genes; (C) The correlation heat map of WGCNA adjacent modules. The rectangles in each row and each column represent a module characteristic gene. Light blue represents low adjacency, and red represents high adjacency; (D) The TOM visualized the gene co-expression network's heat map in the module. In the TOM map, light colors indicate topological overlap. Dark colors indicate a higher degree of topological overlap. The gene tree diagram and corresponding modules are displayed on the upper left of the TOM diagram. The intersection of the two rectangles indicates the topological overlap in the Blue module. DEGs: differentially expressed genes; TOM: topological overlap matrix.
Figure 4
Figure 4
GO functional enrichment analysis and KEGG pathway analysis of characteristic genes in the Blue module. (A) Top 20 enriched biological process terms; (B) Top 20 enriched cell component enrichment; (C) The results of Molecular function enrichment analysis; (D) The results of the KEGG pathway enrichment analysis. Abbreviations: GO: gene ontology; KEGG: Kyoto Encyclopedia of Genes and Genomes.
Figure 5
Figure 5
The module driver genes identified in the PPI network. (A) The PPI network consists of 45 nodes and 66 edges, and 75 of the Blue module's co-expression of genes constructs a PPI network; (B) Clusters of driver genes in the Blue module, and the squares marked in yellow to red indicate the top 10 module driver genes in sub-function cluster 1, and the blue squares represented the other related genes in cluster 1. Abbreviation: PPI: protein-protein interaction.
Figure 6
Figure 6
The core DEmRNAs identified in the PPI network. (A) The darker the color (red) of the genes, the higher degree of contribution in the PPI network; (B) The darker color (red) of the DEmRNA represents the gene with a higher degree. Abbreviations: DEmRNAs, differentially expressed lncRNAs. PPI: protein-protein interaction.
Figure 7
Figure 7
Identification of DElncRNAs and the co-relationship of core DEmRNAs and DElncRNAs. (A) In the volcano plot of the DElncRNAs, red dots are up-regulated lncRNAs, blue is down-regulated, and grey is no different; (B) The expression relevance of DEmRNAs and DElncRNAs. The darker the color (red) of the circle, the stronger the correlation. Abbreviations: DEmRNAs: differentially expressed mRNAs; DElncRNAs: differentially expressed lncRNAs.
Figure 8
Figure 8
Prognostic analysis results of essential mRNAs and co-expressed DElncRNAs. (A) The result of univariate Cox regression analysis showed that the key genes such as S100A8 (HR:1.119, 95% CI:1.01–1.16), S100A9 (HR:1.08, 95% CI:1.00–1.16), NCF2 (HR:1.19, 95% CI:1.05–1.35), ITGAM (HR:1.19, 95% CI:1.05–1.36), HK3 (HR:1.09, 95% CI:1.01–1.08), VNN2 (HR:1.12, 95% CI:1.01–1.24), PPBP (HR:1.10, 95% CI:1.02–1.19), and ITGB2 (HR:1.33, 95% CI:1.14–1.56) both have significant impact on the prognosis of AML patients (P < 0.05). (B) The development of the research showed that the expression of DElnRNAs as ITGB2-AS1 (HR:1.24, 95% CI:1.10–1.41) has a significant impact on the prognosis of AML patients (P < 0.05). (C) The results of K–M survival analysis showed that AML patients with high expression of ITGAM, PPBP, and ITGB2-AS1 had a poor prognosis (P < 0.05). (D) The Nomogram was established based on the clinical information of TCGA-LAML. The points for 11 factors (gender, cytogenetics risk category, age, leukocyte, hemoglobin, monocyte, platelet, FAB classification, and the expression level of ITGAM, PPBP, or ITGB2-AS1) were listed in the Nomogram. The score for each factor in the Nomogram was read out by drawing a straight line from the predictor to the point axis, and then the survival rates of 1, 3, and 5 years could be estimated by adding the points corresponding to each factor in the bottom scale. Abbreviations: DElncRNAs: differentially expressed lncRNAs; HR: hazard ratio; CI: confidence interval.
Figure 9
Figure 9
The differential expression of critical genes in clinical samples between AML and healthy individuals. The result of clinical validation showed that ITGB2-AS, ITGAM, and PPBP are significantly higher in the initial diagnosed AML. ***P < 0.001; *P < 0.05.
Figure 10
Figure 10
Weights of the key mRNAs and co-expressed DElncRNAs were determined by the AUC values of the ROC curves in AML. (A) ROC analysis revealed that the AUC for 18 mRNAs was ≥ 0.7; (B) ROC curve analysis shows that the AUC for 7 co-expressed DElncRNAs was also ≥ 0.7. Abbreviations: ROC: receiver operating characteristic; AUC: area under the curve; DElncRNAs: differentially expressed lncRNAs.
Figure 11
Figure 11
The pathway enrichment in the high versus low ITGAM expression group is based on the TCGA-LAML expression profiles. The significant enriched KEGG pathways were confirmed as an enrichment when FDR < 0.05.
Figure 12
Figure 12
Association of prognostic genes expression levels with the tumor microenvironment (TME). (A) Strong positive correlation between ITGAM expression (log2 transformation) and immune score. (B) A moderate correlation between ITGAM expression (log2 transformation) and stroma score. (C) Strong positive correlation between LncRNA ITGB2-AS1 expression (log2 transformation) and immune score. (D) A moderate correlation between LncRNA ITGB2-AS1 expression (log2 transformation) and stroma score. R, Spearman’s correlation coefficient; ***P < 0.001.
Figure 13
Figure 13
Association of ITGAM and LncRNA ITGB2-AS1 expression level with immune signature in AML. (A) The expression of ITGAM exhibit a significant positive correlation with six immune cells (M2 Macrophages, Macrophages, Treg, MDSC, TAM, and Thr17). The Spearman's correlation test P values are shown; (B) The expression of LncRNA ITGB2-AS1 exhibit a significant positive correlation with five immune cells (M2 Macrophages, Macrophages, MDSC, TAM, and CD4 regulatory T cells). The Spearman's correlation test P values are shown; (C) High infiltration levels (ssGSEA scores) of M2 macrophages associated with shorter survival time in LAML patients. (D) the ratios of pro-/anti-inflammatory cytokines are significantly lower in AML with highly expressing of ITGAM and LncRNA ITGB2-AS1 (expression levels > median) than in those lowly expressing of ITGAM and LncRNA ITGB2-AS1 (expression levels < median). The mean expression (log2 transformed) ratio of the marker genes levels was defined as pro-inflammatory cytokines representing immune-stimulatory signature with marker genes as IFN-γ, IL-1, and IL-2. The anti-inflammatory cytokines represent with immune-inhibitory signature with marker genes as TGFB1, IL-10, IL-4, and IL-11. Abbreviations: Treg: The regulatory T cells, TAM: Tumour-associated macrophages, MDSC: Myeloid-derived suppressor cells, TGFB: transforming growth factor–β1. ***P < 0.001.

Similar articles

Cited by

References

    1. Short NJ, Rytting ME, Cortes JE. Acute myeloid leukaemia. Lancet. 2018; 392:593–606. 10.1016/S0140-6736(18)31041-9 - DOI - PMC - PubMed
    1. Estey E. Acute Myeloid Leukemia - Many Diseases, Many Treatments. N Engl J Med. 2016; 375:2094–95. 10.1056/NEJMe1611424 - DOI - PubMed
    1. Lemonnier F, Inoue S, Mak TW. Genomic Classification in Acute Myeloid Leukemia. N Engl J Med. 2016; 375:900. 10.1056/NEJMc1608739 - DOI - PubMed
    1. Yan H, Qu J, Cao W, Liu Y, Zheng G, Zhang E, Cai Z. Identification of prognostic genes in the acute myeloid leukemia immune microenvironment based on TCGA data analysis. Cancer Immunol Immunother. 2019; 68:1971–78. 10.1007/s00262-019-02408-7 - DOI - PMC - PubMed
    1. Zhao W, Langfelder P, Fuller T, Dong J, Li A, Hovarth S. Weighted gene coexpression network analysis: state of the art. J Biopharm Stat. 2010; 20:281–300. 10.1080/10543400903572753 - DOI - PubMed

Publication types

MeSH terms