

Chest Computed Tomography (CT) as a Predictor of Clinical Course in Coronavirus Disease
- PMID: 34149047
- PMCID: PMC8186270
- DOI: 10.12659/MSM.931285
Chest Computed Tomography (CT) as a Predictor of Clinical Course in Coronavirus Disease
Abstract
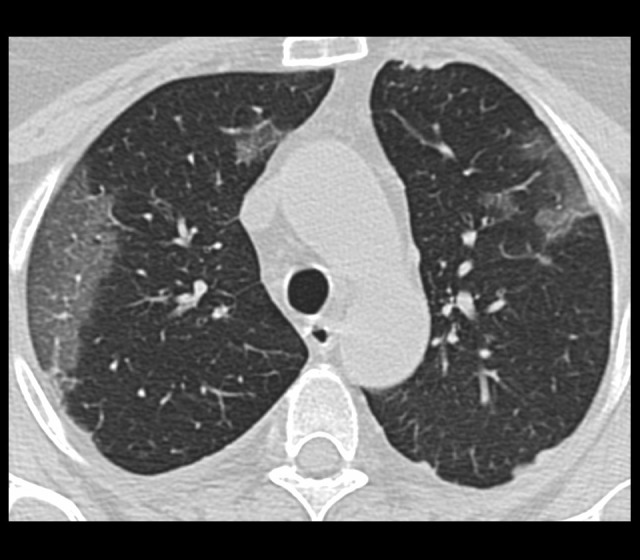
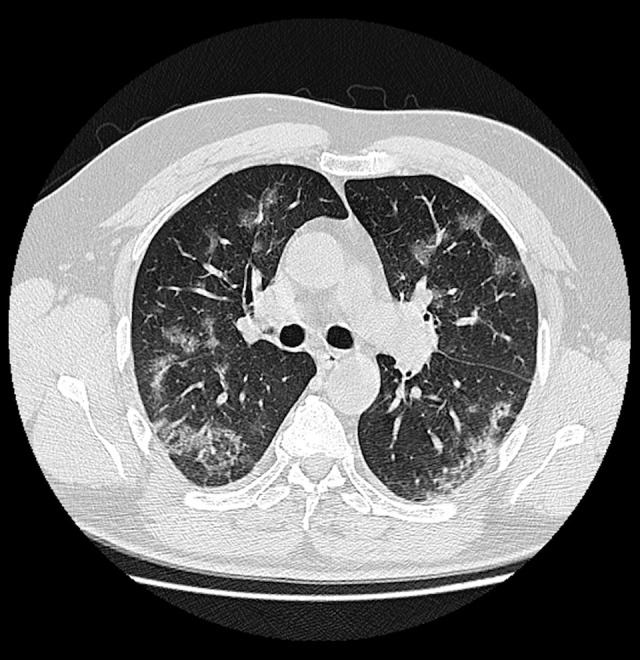
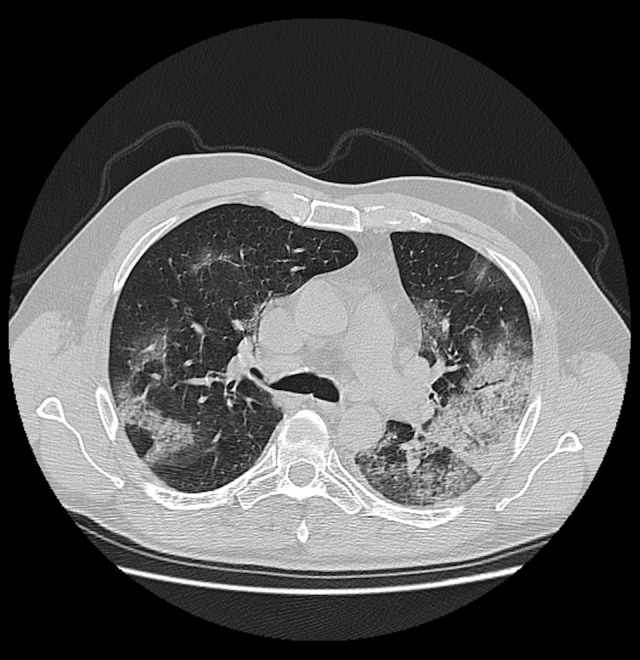
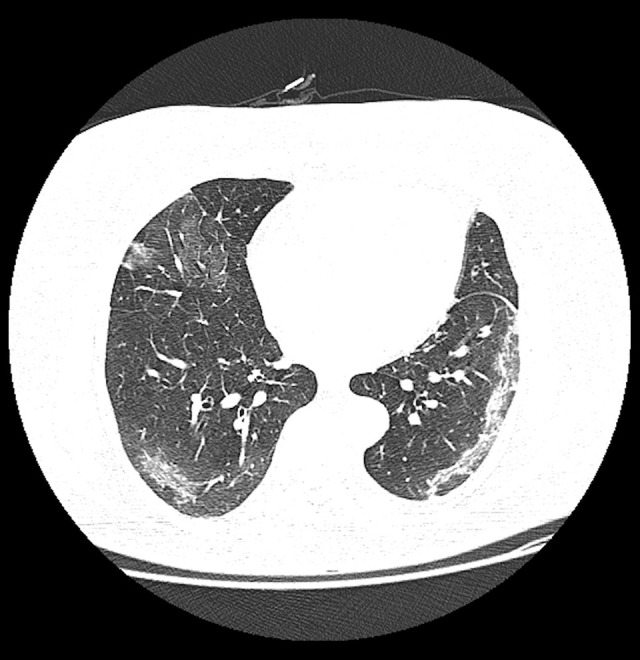
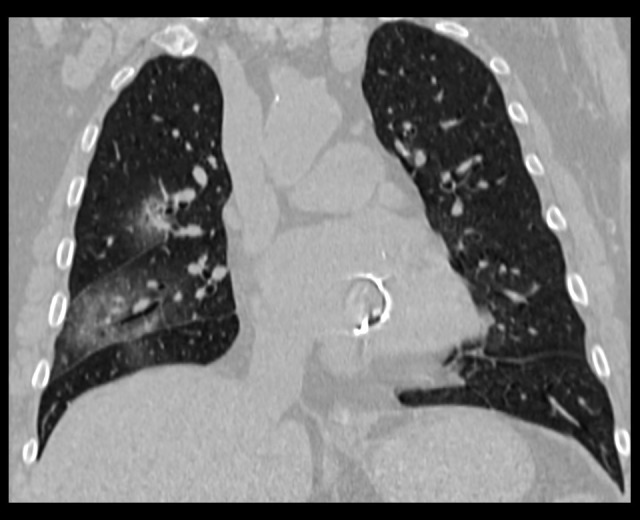
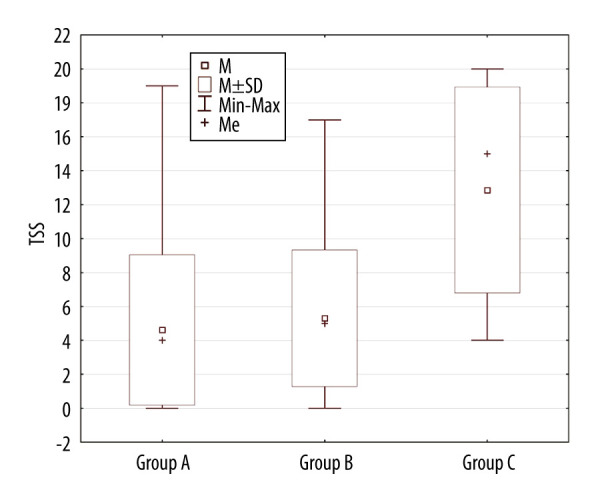
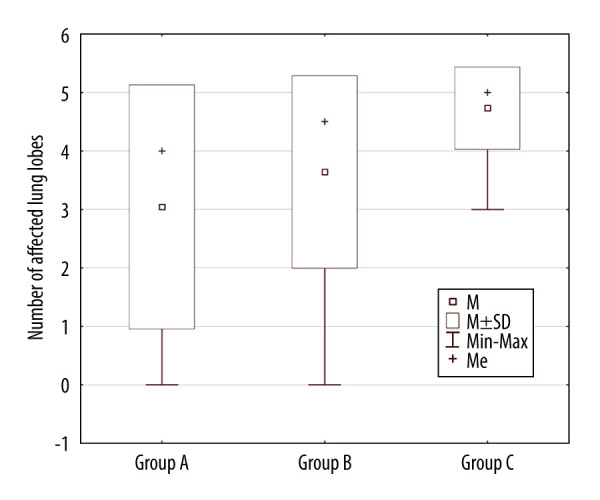
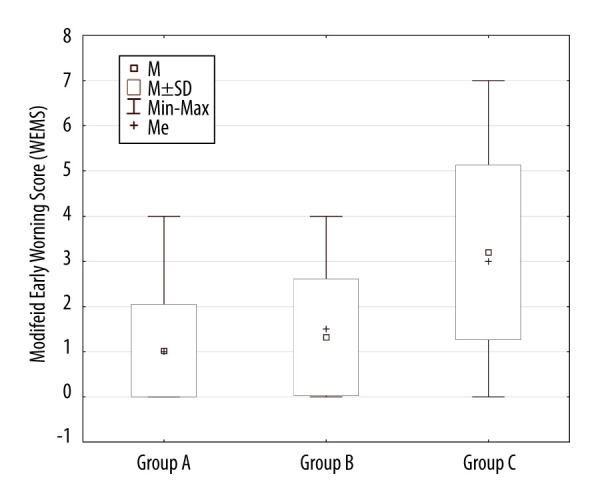
BACKGROUND Chest imaging may be taken into consideration in detecting viral lung infections, especially if there are no tests available or there is a need for a prompt diagnosis. Imaging modalities enable evaluation of the character and extent of pulmonary lesions and monitoring of the disease course. The aim of this study was to verify the prognostic value of chest CT in COVID-19 patients. MATERIAL AND METHODS We conducted a retrospective review of clinical data and CT scans of 156 patients with SARS-CoV-2 infection confirmed by real-time reverse-transcription polymerase-chain-reaction (rRT-PCR) assay hospitalized in the Central Clinical Hospital of the Ministry of the Interior in Warsaw and in the Medical Centre in Łańcut, Poland. The total severity score (TSS) was used to quantify the extent of lung opacification in CT scans. RESULTS The dominant pattern in discharged patients was ground-glass opacities, whereas in the non-survivors, the dominant pulmonary changes were consolidations. The non-survivors were more likely to have pleural effusion, pleural thickening, lymphadenopathy, air bronchogram, and bronchiolectasis. There were no statistically significant differences among the 3 analyzed groups (non-survivors, discharged patients, and patients who underwent prolonged hospitalization) in the presence of fibrotic lesions, segmental or subsegmental pulmonary vessel enlargement, subpleural lines, air bubble sign, and halo sign. CONCLUSIONS Lung CT is a diagnostic tool with prognostic utility in COVID-19 patients. The correlation of the available clinical data with semi-quantitative radiological features enables evaluation of disease severity. The occurrence of specific radiomics shows a positive correlation with prognosis.
Conflict of interest statement
None.
Figures
Similar articles
-
CT imaging features of COVID-19 pneumonia: initial experience from Turkey.Diagn Interv Radiol. 2020 Jul;26(4):308-314. doi: 10.5152/dir.2020.20307. Diagn Interv Radiol. 2020. PMID: 32558645 Free PMC article.
-
Computed tomography features of COVID-19 in children: A systematic review and meta-analysis.Medicine (Baltimore). 2021 Sep 24;100(38):e22571. doi: 10.1097/MD.0000000000022571. Medicine (Baltimore). 2021. PMID: 34559092 Free PMC article.
-
Imaging and clinical features of patients with 2019 novel coronavirus SARS-CoV-2.Eur J Nucl Med Mol Imaging. 2020 May;47(5):1275-1280. doi: 10.1007/s00259-020-04735-9. Epub 2020 Feb 28. Eur J Nucl Med Mol Imaging. 2020. PMID: 32107577 Free PMC article.
-
Clinical and laboratory data, radiological structured report findings and quantitative evaluation of lung involvement on baseline chest CT in COVID-19 patients to predict prognosis.Radiol Med. 2021 Jan;126(1):29-39. doi: 10.1007/s11547-020-01293-w. Epub 2020 Oct 12. Radiol Med. 2021. PMID: 33047295 Free PMC article.
-
Predictors of the chest CT score in COVID-19 patients: a cross-sectional study.Virol J. 2021 Nov 18;18(1):225. doi: 10.1186/s12985-021-01699-6. Virol J. 2021. PMID: 34794467 Free PMC article. Review.
References
-
- Lee N, Hui D, Wu A, et al. A major outbreak of severe acute respiratory syndrome in Hong Kong. N Engl J Med. 2003;348(20):1986–94. - PubMed
-
- (CDC) USCfDCaP. Symptoms of coronavirus
-
- Jędrusik P, Gaciong Z, Sklinda K, et al. Diagnostic role of chest computed tomography in coronavirus disease 2019. Pol Arch Intern Med. 2020;130(6):520–528. - PubMed
MeSH terms
LinkOut - more resources
Full Text Sources
Medical
Miscellaneous
