. 2021 May;52(3):477-494.
doi: 10.1111/agec.12629. Epub 2021 May 2.

Short-term impacts of COVID-19 on food security and nutrition in rural Guatemala: Phone-based farm household survey evidence

Affiliations

Short-term impacts of COVID-19 on food security and nutrition in rural Guatemala: Phone-based farm household survey evidence

Francisco Ceballos et al. Agric Econ. 2021 May.

Abstract

This article examines the short-term effects of the COVID-19 lockdown on food security and nutrition in rural Guatemala. We rely on a comprehensive panel dataset of 1,824 small agricultural households collected over two survey rounds, on November-December 2019 and May-June 2020. We place special emphasis on changes in agricultural and nonagricultural income sources, including remittances, and changes in dietary diversity, including consumption of animal source foods (ASF) and fruits and vegetables (F&V). We find that COVID-19 affected the incomes, food security, and dietary patterns of households, with a decrease in ASF diversity and an increase in F&V diversity, and an overall net decrease in dietary diversity across all food groups. Dietary diversity among women in reproductive age, however, remained unchanged, and increased among children under 2 years old. Interestingly, households with relatively higher incomes appear to have reduced their dietary diversity to a larger extent than lower income ones, as well as households located in communities with more severe access restrictions. The focus of the study in a region with a high prevalence of poverty and chronic malnutrition provides an important perspective into the consequences of the lockdown in complex rural contexts with vulnerable populations and contributes to inform eventual recovery measures.

Keywords: COVID‐19; agricultural households; dietary diversity; food security; income.


Figures

FIGURE 1
FIGURE 1
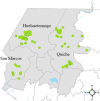
Sampled communities in the panel survey [Color figure can be viewed at wileyonlinelibrary.com] Note: This figure maps the average georeferenced point (green circle) of all interviewed households within each sampled community in the panel survey
FIGURE 2
FIGURE 2
Reported changes in income sources [Color figure can be viewed at wileyonlinelibrary.com] Note: This figure shows the percentage of interviewed households that reported decreases or increases to their agricultural, nonagricultural, and remittances income after the lockdown. Answer categories in the questionnaire were symmetric, with households being able to declare that their income had increased either a lot or a little; however, these are lumped together in a single “Increased” category for clarity of exposition. The percentages for agricultural and nonagricultural income are based on all 1,824 households, while the percentages for remittances are only based on the subsample of 578 households that reported receiving remittances at baseline (November–December 2019) and/or the follow‐up (May–June 2020) survey
FIGURE 3
FIGURE 3
Before and after food insecurity experiences [Color figure can be viewed at wileyonlinelibrary.com] Note: This figure shows the percentage of 1,824 interviewed households that reported having experienced the situations described above (over the months prior to the survey), before and after the lockdown. These situations are part of the eight Food Insecurity Experience Scale items proposed by Ballard et al. (2013) and are linked to a mild, moderate, and severe level of food insecurity. The white bars correspond to the period of November–December 2019 and the green bars to the period of May–June 2020
FIGURE 4
FIGURE 4
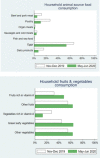
Before and after household consumption of ASF and fruits & vegetables [Color figure can be viewed at wileyonlinelibrary.com] Note: This figure shows the percentage of households reporting having consumed each of the food groups over the previous 24 h, before and after the lockdown. The total number of surveyed households is 1,824. The white bars correspond to the period of November–December 2019 and the green bars to the period of May–June 2020
FIGURE 5
FIGURE 5
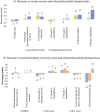
Partial regression coefficients between a decrease in income and dietary diversity and household characteristics. (a) Decrease in income sources and selected household characteristics. [Color figure can be viewed at wileyonlinelibrary.com] (b) Decrease in HDDS and selected household characteristics Note: This figure shows the partial correlations (in percentage points) of regressing if the income source or DDS decreased after the lockdown on a set of household characteristics at baseline, for selected variables. The vertical lines correspond to the 95% confidence intervals. The full estimation results are reported in Online Appendix Tables A.2 and A.3. The correlations in both panels are based on 1,824 surveyed households. The HDDS, ASF, and F&V scores measure the number of food groups that a member of the household consumed over the previous 24 h. (See the main text for the groups comprised in each of the scores.)

References

    1. Abate, G. , De Brauw, A. , & Hirvonen, K. (2020). Food and nutrition security in Addis Ababa, Ethiopia during COVID‐19 pandemic: June 2020 report [ESSP Working Paper 145]. International Food Policy Research Institute (IFPRI).
    1. Akter, S. , & Basher, S. A. (2014). The impacts of food price and income shocks on household food security and economic well‐being: Evidence from rural Bangladesh. Global Environmental Change, 24(25), 150–162.
    1. Allen, L. H. , & Gillespie, S. (2001). What works? A review of the efficacy and effectiveness of nutrition interventions. Asian Development Bank.
    1. Arimond, M. , & Ruel, M. T. (2004). Dietary diversity is associated with child nutritional status: Evidence from 11 demographic and health surveys. The Journal of Nutrition, 134(10), 2579–2585. - PubMed
    1. Ballard, T. J. , Kepple, A. W. , & Cafiero, C. (2013). The Food Insecurity Experience Scale: Development of global standard for monitoring hunger worldwide. FAO Technical Paper Version 1.1 FAO.

LinkOut - more resources