. 2021 Jun 3:15:655305.
doi: 10.3389/fncel.2021.655305. eCollection 2021.

Multimodal Optical Imaging to Investigate Spatiotemporal Changes in Cerebrovascular Function in AUDA Treatment of Acute Ischemic Stroke

Affiliations

Multimodal Optical Imaging to Investigate Spatiotemporal Changes in Cerebrovascular Function in AUDA Treatment of Acute Ischemic Stroke

Han-Lin Wang et al. Front Cell Neurosci. .

Abstract

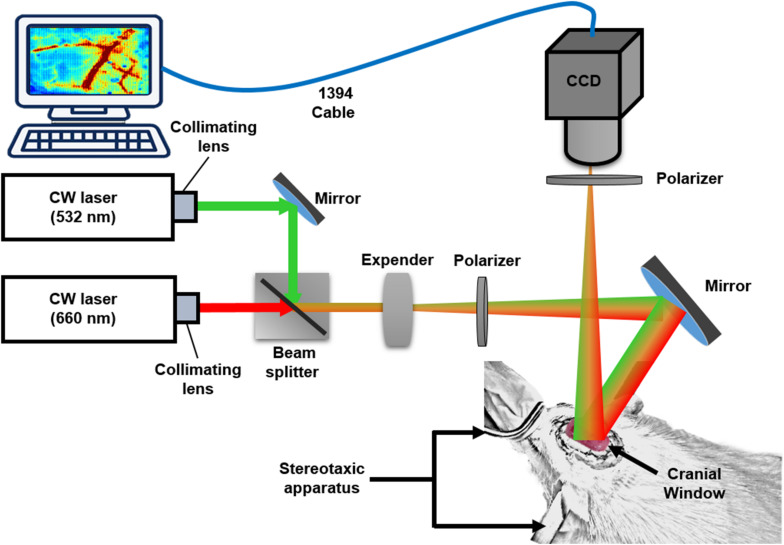
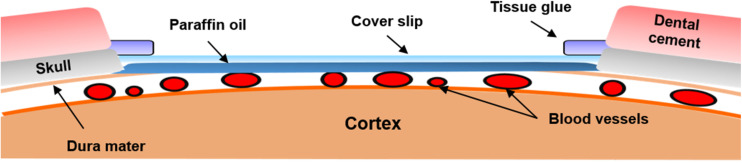
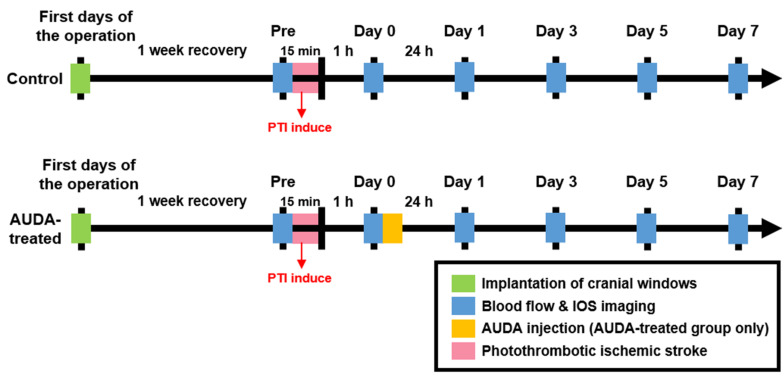
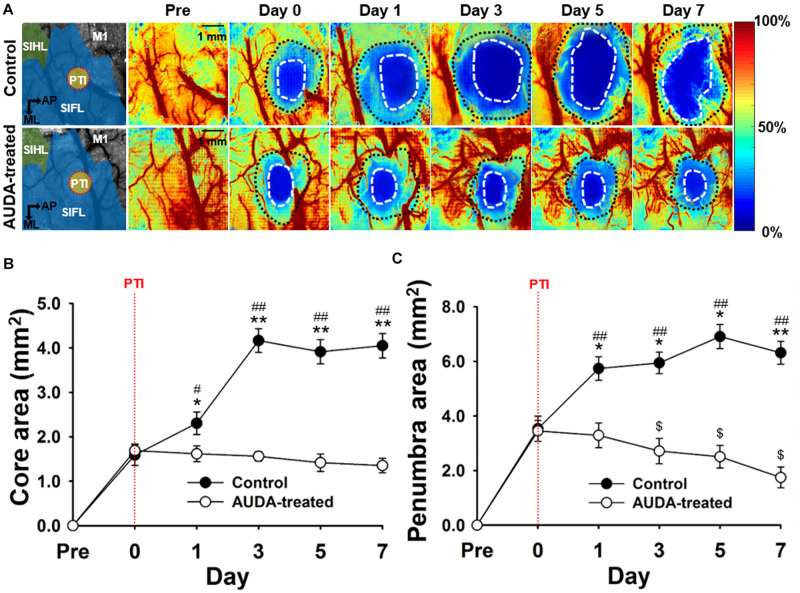
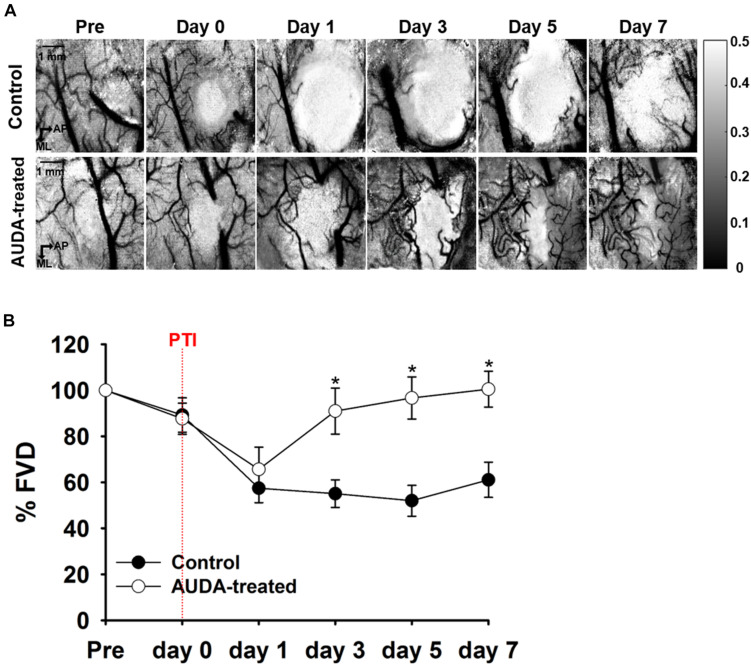
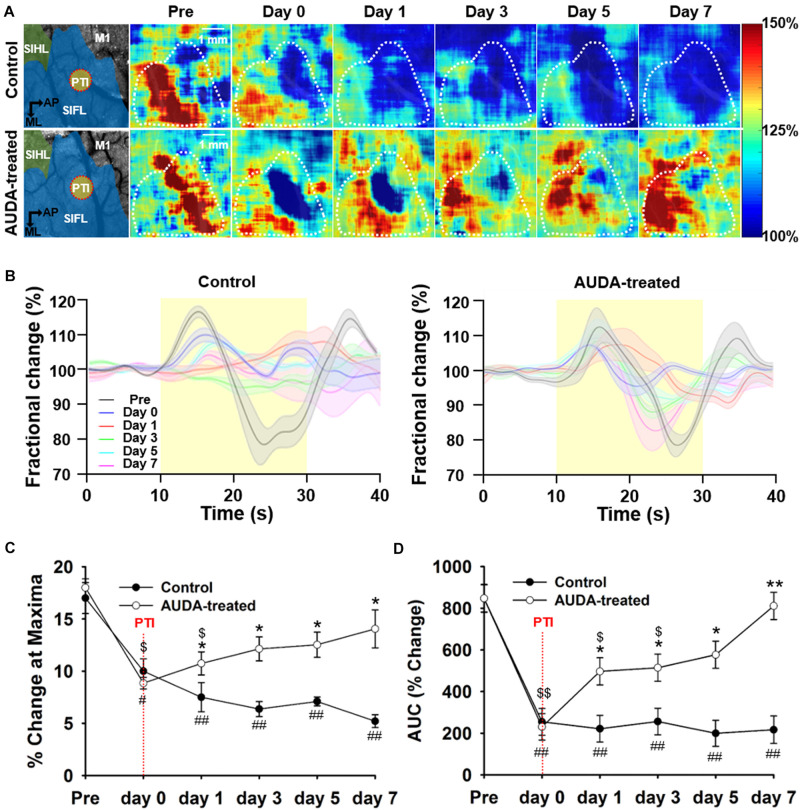
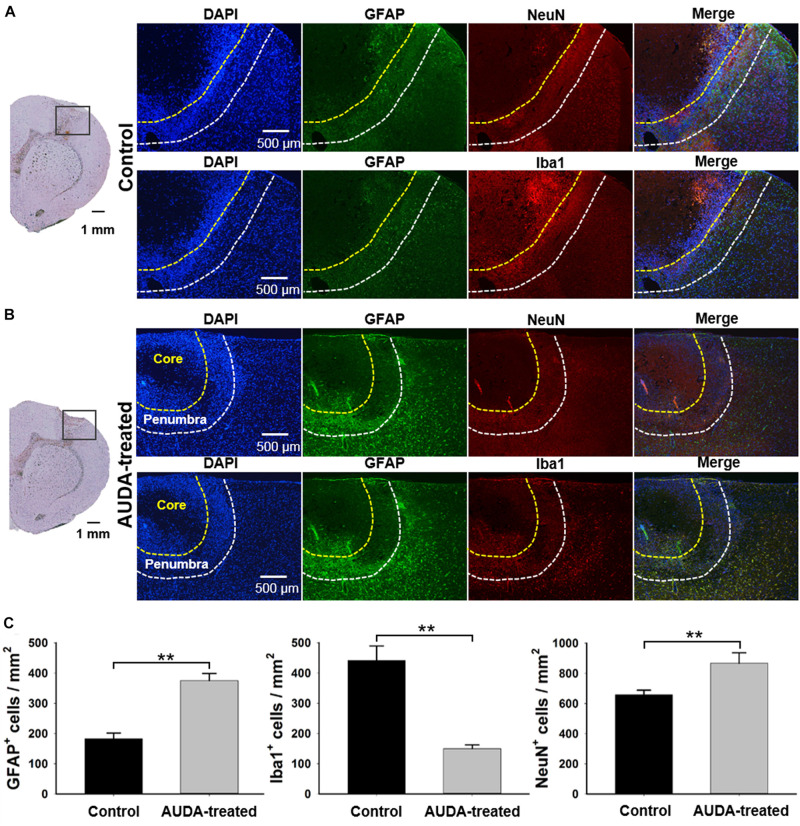
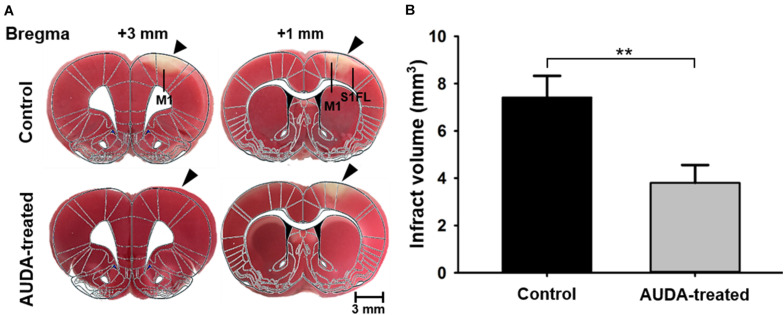
Administration of 12-(3-adamantan-1-yl-ureido)-dodecanoic acid (AUDA) has been demonstrated to alleviate infarction following ischemic stroke. Reportedly, the main effect of AUDA is exerting anti-inflammation and neovascularization via the inhibition of soluble epoxide hydrolase. However, the major contribution of this anti-inflammation and neovascularization effect in the acute phase of stroke is not completely elucidated. To investigate the neuroprotective effects of AUDA in acute ischemic stroke, we combined laser speckle contrast imaging and optical intrinsic signal imaging techniques with the implantation of a lab-designed cranial window. Forepaw stimulation was applied to assess the functional changes via measuring cerebral metabolic rate of oxygen (CMRO2) that accompany neural activity. The rats that received AUDA in the acute phase of photothrombotic ischemia stroke showed a 30.5 ± 8.1% reduction in the ischemic core, 42.3 ± 15.1% reduction in the ischemic penumbra (p < 0.05), and 42.1 ± 4.6% increase of CMRO2 in response to forepaw stimulation at post-stroke day 1 (p < 0.05) compared with the control group (N = 10 for each group). Moreover, at post-stroke day 3, increased functional vascular density was observed in AUDA-treated rats (35.9 ± 1.9% higher than that in the control group, p < 0.05). At post-stroke day 7, a 105.4% ± 16.4% increase of astrocytes (p < 0.01), 30.0 ± 10.9% increase of neurons (p < 0.01), and 65.5 ± 15.0% decrease of microglia (p < 0.01) were observed in the penumbra region in AUDA-treated rats (N = 5 for each group). These results suggested that AUDA affects the anti-inflammation at the beginning of ischemic injury and restores neuronal metabolic rate of O2 and tissue viability. The neovascularization triggered by AUDA restored CBF and may contribute to ischemic infarction reduction at post-stroke day 3. Moreover, for long-term neuroprotection, astrocytes in the penumbra region may play an important role in protecting neurons from apoptotic injury.

Keywords: AUDA; cranial window; ischemic stroke; multimodal optical imaging system; neovascularization; penumbra.


Conflict of interest statement

The authors declare that the research was conducted in the absence of any commercial or financial relationships that could be construed as a potential conflict of interest.

Figures

FIGURE 1
FIGURE 1
System setup. Multimodal optical imaging system consisting of two CW lasers (532 and 660 nm), a setup of lenses and the CCD camera. The CW 660-nm laser beam was reflected off moving red blood cells (RBCs) and produced speckle for LSCI analysis. The CW 532-nm laser beam was used to measure the absorbance difference by RBCs in vessels and surrounding tissues for OISI calculation. The optical setup was used to couple and expand the two laser beams and illuminate the rat cortex. Two polarizers were used to eliminate the noise reflected from the surface of the cortex. The CCD camera was positioned over the exposed area at an appropriate focal length, and the images were saved and transported to a personal computer via an IEEE 1394 interface for further data analysis. The rat was fixed in a custom-made stereotaxic frame with ear bars, and the surface of the rat brain was imaged through a lab-designed cranial window for LSCI and OISI analysis.
FIGURE 2
FIGURE 2
Illustration of the chronic cranial window. Schematics of the cranial window on the rat cortex. The cranial window was filled with paraffin oil and covered by a cover slip. To maintain the intracranial pressure, tissue glue was used to seal the gaps between the skull and cover slip. After the cranial window was set up, dental cement was placed around the cranial window to avoid damage to the cover slip.
FIGURE 3
FIGURE 3
Experimental timeline for monitoring the effect of AUDA after PTI stroke. To monitor the effect of AUDA, ischemic stroke was induced by PTI in both groups for 15 min (red bar). After 1 h from PTI stroke, the rats in the AUDA-treated group received a single AUDA injection (yellow bar). After 1-week of recovery from the cranial window implantation operation (green bar), the images for LSCI and OISI analysis were recorded pre-PTI stroke and post-PTI stroke for 7 days (blue bar) in both groups.
FIGURE 4
FIGURE 4
Comparison of ischemic core and penumbra region changes following PTI stroke. (A) Pseudo-color maps of the rCBF percentage change, based on the rCBF value before PTI stroke on day 0. The white dot circled area indicates the ischemic core with a threshold of 20% changes in rCBF. The area between the white dotted circle and black dotted circle contains the ischemic penumbra with a range of 20–50% changes in rCBF. The schematic diagrams of the brain area with S1HL, S1FL, and M1 area as well as the position of PTI induction are shown in the left panel. The scale bar is 1 mm. (B) The core size in the AUDA-treated group was significantly smaller than that of the control group from day 1 to day 7. Compared with the core size on day 0, the core size of the control group significantly increased on post-stroke day 1. The core size in the AUDA-treated group did not show significant changes following PTI stroke. Significant differences between groups are indicated by *p < 0.05 and **p < 0.01 and indicated by ##p < 0.01 compared with day 0 in both group (two-way ANOVA followed by Bonferroni post-hoc test). (C) The penumbra size in the AUDA-treated group was significantly reduced compared with that in the control group since post-stroke day 1. In addition, compared with day 0, a significant decrease in penumbra size was observed in the AUDA-treated group post-stroke day 3. Conversely, a significant increase in penumbra size was observed since post-PTI stroke day 0. Significant differences between groups are indicated by *p < 0.05 and **p < 0.01, by #p < 0.05 and ##p < 0.01, and by $p < 0.05 compared with day 0 in the control group (two-way ANOVA followed by Bonferroni post-hoc test). Data are presented as the mean ± SEM. N = 10 for each group. The red dotted line in both groups indicates the time of PTI stroke induction.
FIGURE 5
FIGURE 5
Comparison of %FVD in the observation window after PTI stroke. (A) In-vivo LSCI images over 7 days following stroke. The scale bar is 1 mm. (B) The %FVD was significantly higher in the AUDA-treated group than in the control group from post-PTI stroke day 3. Significant differences between groups are indicated by *p < 0.05 (Mann–Whitney U-test). Data are presented as the mean ± SEM. N = 10 for each group. The red dotted line indicates the time of PTI stroke induction.
FIGURE 6
FIGURE 6
Comparison of CMRO2 changes during forepaw stimulation after PTI stroke. (A) Pseudo-color maps of maximum CMRO2 during forepaw stimulation. The white dotted circle represented the ROI in the S1FL area and was averaged for time statistical analysis, presented in (C). The schematic diagrams of brain area with the S1HL, S1FL, and M1 areas, and the position of PTI induction are shown in the left panel. The scale bar is 1 mm. (B) The time series of fractional CMRO2 changes during forepaw stimulation and resting periods. The solid black line denotes the fractional CMRO2 changes pre-stroke; the blue, red, green, cyan, and magenta line indicate the fractional CMRO2 changes post-PTI stroke on days 0–7. The shadow error bar indicates the SEM across the subjects. (C) The maximum change of CMRO2 during forepaw stimulation was significantly higher in the AUDA-treated group than in the control group from post-PTI stroke day 1. In addition, the maximum response of CMRO2 was restored from day 3 in the AUDA-treat group compared with that observed pre-stroke. The restoration of maximum response of CMRO2 was not found in the control group post-PTI stroke. (D) The calculated area under the curve (AUC) indicates CMRO2 responses during forepaw stimulation. From day 1 to day 7, the calculated AUC in the AUDA-treated group was higher than that in the control group. Compared with pre-stroke, the calculated AUC was restored from day 5 in the AUDA-treated group. The restoration of CMRO2 responses was not observed in the control group post-PTI stroke. Significant differences between groups are indicated by *p < 0.05, **p < 0.01, indicated by #p < 0.05, ##p < 0.01 compared with pre-stroke in the control group, and indicated by $p < 0.05, $$p < 0.01 compared with pre-stroke in the AUDA-treated group (two-way ANOVA followed by Bonferroni post-hoc test). Data are presented as the mean ± SEM. N = 10 for each group. The red dotted line indicates the time of PTI stroke induction.
FIGURE 7
FIGURE 7
Comparison of NeuN+, GFAP+, and Iba1+ cell expression in ischemic core and penumbra at 7 days following PTI stroke. Representative images show double immunofluorescence staining of DAPI (blue), GFAP (green), NeuN (red), and Iba1 (red) in coronal sections under normal conditions at 7 days following PTI stroke. The observed region was selected within the boundary of the injury area under the bright field of the brain section, as shown in the left panel in the control group (A) and the AUDA-treated group (B). The area of the ischemic core and penumbra are indicated by yellow dotted line and white dotted line, respectively, as established according to the expression intensity of NeuN+ cells. The 2 rows in a group represented 2 adjacent brain sections, containing all 4 markers. (C) The comparison of cell counts of NeuN+, GFAP+, and Iba1+ cells in the ischemic penumbra region in both groups. The density of GFAP+ cells and NeuN+ cells in the AUDA-treated group was significantly higher than that in the control group in the penumbra region. The number of Iba1+ cells in the AUDA-treated group was significantly lower than that in the control group in the penumbra region. The scale bar represents 500 μm in immunofluorescence images and represents 1 mm in the bright field of the brain sections. The symbol “∗∗” indicates significant differences (**p < 0.01, Mann–Whitney U-test). Data are presented as the mean ± SEM. N = 5 for each group.
FIGURE 8
FIGURE 8
Comparison of infarct volume 7 days after PTI stroke. Analysis and quantification of infarct volume by TTC staining. (A) Coronal sections of ischemic rat brain at 1 and 3 mm anterior to the bregma. The red area is the normal area, and the light colored area is the infarct area, indicated by black arrowheads. (B) Statistical analysis of infarct volume. The infarct volume in the AUDA-treated group was significantly decreased compared with the control group on post-PTI stroke day 7. The scale bar is 3 mm. The symbol “∗∗” indicated significant differences (**p < 0.01, Mann–Whitney U-test, N = 5 for each group). Data are presented as the mean ± SEM.

Similar articles

Cited by

References

    1. Alexandrova M., Bochev P., Markova V., Bechev B., Popova M., Danovska M., et al. (2004). Dynamics of free radical processes in acute ischemic stroke: influence on neurological status and outcome. J. Clin. Neurosci. 11 501–506. 10.1016/j.jocn.2003.10.015 - DOI - PubMed
    1. Ambrus R., Strandby R. B., Svendsen L. B., Achiam M. P., Steffensen J. F., Sondergaard Svendsen M. B. (2016). Laser speckle contrast imaging for monitoring changes in microvascular blood flow. Eur. Surg. Res. 56 87–96. 10.1159/000442790 - DOI - PubMed
    1. Autio J., Kawaguchi H., Saito S., Aoki I., Obata T., Masamoto K., et al. (2011). Spatial frequency-based analysis of mean red blood cell speed in single microvessels: investigation of microvascular perfusion in rat cerebral cortex. PLoS One 6:e24056. 10.1371/journal.pone.0024056 - DOI - PMC - PubMed
    1. Banai S., Jaklitsch M. T., Shou M., Lazarous D. F., Scheinowitz M., Biro S., et al. (1994). Angiogenic-induced enhancement of collateral blood flow to ischemic myocardium by vascular endothelial growth factor in dogs. Circulation 89 2183–2189. 10.1161/01.cir.89.5.2183 - DOI - PubMed
    1. Barone F. C., Arvin B., White R. F., Miller A., Webb C. L., Willette R. N., et al. (1997). Tumor necrosis factor-alpha. A mediator of focal ischemic brain injury. Stroke 28 1233–1244. 10.1161/01.str.28.6.1233 - DOI - PubMed