Interictal Epileptiform Discharge Dynamics in Peri-sylvian Polymicrogyria Using EEG-fMRI
- PMID: 34149595
- PMCID: PMC8212705
- DOI: 10.3389/fneur.2021.658239
Interictal Epileptiform Discharge Dynamics in Peri-sylvian Polymicrogyria Using EEG-fMRI
Abstract
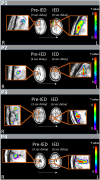
Polymicrogyria (PMG) is a common malformation of cortical development associated with a higher susceptibility to epileptic seizures. Seizures secondary to PMG are characterized by difficult-to-localize cerebral sources due to the complex and widespread lesion structure. Tracing the dynamics of interictal epileptiform discharges (IEDs) in patients with epilepsy has been shown to reveal the location of epileptic activity sources, crucial for successful treatment in cases of focal drug-resistant epilepsy. In this case series IED dynamics were evaluated with simultaneous EEG-fMRI recordings in four patients with unilateral peri-sylvian polymicrogyria (PSPMG) by tracking BOLD activations over time: before, during and following IED appearance on scalp EEG. In all cases, focal BOLD activations within the lesion itself preceded the activity associated with the time of IED appearance on EEG, which showed stronger and more widespread activations. We therefore propose that early hemodynamic activity corresponding to IEDs may hold important localizing information potentially leading to the cerebral sources of epileptic activity. IEDs are suggested to develop within a small area in the PSPMG lesion with structural properties obscuring the appearance of their electric field on the scalp and only later engage widespread structures which allow the production of large currents which are recognized as IEDs on EEG.
Keywords: EEG-fMRI; epilepsy; interictal dynamics; interictal epileptiform discharges; polymicrogyria.
Copyright © 2021 Cohen, Ebrahimi, Medvedovsky, Gurevitch, Aizenstein, Hendler, Fahoum and Gazit.
Conflict of interest statement
FF, TH, and MM are authors of patent: Device for use in electro-biological signal measurement in the presence of a magnetic field, WO2012046237, 12.04.2012. The remaining authors declare that the research was conducted in the absence of any commercial or financial relationships that could be construed as a potential conflict of interest.
Figures


Similar articles
-
Co-localization between the BOLD response and epileptiform discharges recorded by simultaneous intracranial EEG-fMRI at 3 T.Neuroimage Clin. 2015 Mar 7;7:755-63. doi: 10.1016/j.nicl.2015.03.002. eCollection 2015. Neuroimage Clin. 2015. PMID: 25844327 Free PMC article.
-
Mapping Epileptic Networks Using Simultaneous Intracranial EEG-fMRI.Front Neurol. 2021 Sep 21;12:693504. doi: 10.3389/fneur.2021.693504. eCollection 2021. Front Neurol. 2021. PMID: 34621233 Free PMC article.
-
Widespread interictal epileptic discharge more likely than focal discharges to unveil the seizure onset zone in EEG-fMRI.Clin Neurophysiol. 2019 Apr;130(4):429-438. doi: 10.1016/j.clinph.2018.12.014. Epub 2019 Jan 30. Clin Neurophysiol. 2019. PMID: 30769269
-
Localization of Epileptic Foci Based on Simultaneous EEG-fMRI Data.Front Neurol. 2021 Apr 27;12:645594. doi: 10.3389/fneur.2021.645594. eCollection 2021. Front Neurol. 2021. PMID: 33986718 Free PMC article. Review.
-
Multichannel continuous electroencephalography-functional near-infrared spectroscopy recording of focal seizures and interictal epileptiform discharges in human epilepsy: a review.Neurophotonics. 2016 Jul;3(3):031402. doi: 10.1117/1.NPh.3.3.031402. Epub 2016 Feb 11. Neurophotonics. 2016. PMID: 26958576 Free PMC article. Review.
References
LinkOut - more resources
Full Text Sources

