. 2021 Jun 4:12:660793.
doi: 10.3389/fendo.2021.660793. eCollection 2021.

Metformin Improves Autonomic Nervous System Imbalance and Metabolic Dysfunction in Monosodium L-Glutamate-Treated Rats

Affiliations

Metformin Improves Autonomic Nervous System Imbalance and Metabolic Dysfunction in Monosodium L-Glutamate-Treated Rats

Claudinéia Conationi da Silva Franco et al. Front Endocrinol (Lausanne). .

Abstract

Metformin is an antidiabetic drug used for the treatment of diabetes and metabolic diseases. Imbalance in the autonomic nervous system (ANS) is associated with metabolic diseases. This study aimed to test whether metformin could improve ANS function in obese rats. Obesity was induced by neonatal treatment with monosodium L-glutamate (MSG). During 21-100 days of age, MSG-rats were treated with metformin 250 mg/kg body weight/day or saline solution. Rats were euthanized to evaluate biometric and biochemical parameters. ANS electrical activity was recorded and analyzed. Metformin normalized the hypervagal response in MSG-rats. Glucose-stimulated insulin secretion in isolated pancreatic islets increased in MSG-rats, while the cholinergic response decreased. Metformin treatment normalized the cholinergic response, which involved mostly the M3 muscarinic acetylcholine receptor (M3 mAChR) in pancreatic beta-cells. Protein expression of M3 mAChRs increased in MSG-obesity rats, while metformin treatment decreased the protein expression by 25%. In conclusion, chronic metformin treatment was effective in normalizing ANS activity and alleviating obesity in MSG-rats.

Keywords: MSG-obese rats; acetylcholine; autonomic nervous system; insulin secretion; metformin.


Conflict of interest statement

The authors declare that the research was conducted in the absence of any commercial or financial relationships that could be construed as a potential conflict of interest.

Figures

Figure 1
Figure 1
Effects of muscarinic receptor agonist and antagonists on glycaemia throughout the intravenous glucose tolerance test (ivGTT). (A) Effect of metformin treatment on glycaemia during the ivGTT. (B–D) show the glucose load-induced area under the glycaemia curve during IVGTT after pretreatment with Ach, Atr and 4-DAMP, respectively. The bars represent the mean ± SEM from 8–12 rats for each treatment, and letters over the bars represent the statistically significant differences using a one-way ANOVA (p <0.0003 and p <0.0001) among the groups.
Figure 2
Figure 2
Effects of muscarinic receptor agonist and antagonists on insulinemia throughout the intravenous glucose tolerance test (ivGTT). (A) Effect of metformin treatment on insulinemia during the ivGTT. (B–D) show the area under the insulinemia curve during IVGTT induced by glucose load after pretreatment with Ach, Atr and 4-DAMP, respectively. The bars represent the mean ± SEM from 8–12 rats for each treatment, and letters over the bars represent the statistically significant differences using one-way ANOVA (p <0.0001) among the groups.
Figure 3
Figure 3
The in vitro effect of the muscarinic receptor agonist and antagonists on GIIS. Bars represent the mean ± SEM of insulin secretion from the pancreatic islets of eight rats that were obtained from four different litters. (A) Insulin secretion that was stimulated by 8.3 mmol l−1 Glu and potentiated by 10 mmol l−1 ACh. (B) The percentage of insulin release stimulated by 8.3 mmol l−1 Glu and 8.3 mmol l−1 Glu potentiated by 1, 10, 100 and 1,000 mmol l−1 ACh. (C) The bars above the 0 line representing (100% of 8.3 mmol 1−1 Glu-mediated insulin secretion throughout the 60 min of incubation in both groups islets) represent the percentage of the 10 μmol 1−1 Ach-mediated insulinotropic action. The line from 0 represents 100% of the 10 μmol 1−1 Ach-potentiated glucose-induced insulin release in both groups. The bars above or below the 0 line represent the agonist-provoked percentage increase or decrease [μmol/l: a nonselective antagonist (Atr, 10) or a selective M2mAChR (MTT, 1) or M3mAChR (4-DAMP, 100) antagonist) or (PZP, 100) in 10 μmol/l Ach-potentiated glucose-induced insulin release in both groups. *p<0.01, **p<0.002, ***p<0.0005, ****p<0.0001 indicated a significant difference between groups based on Student’s t-test.
Figure 4
Figure 4
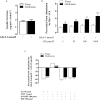
(A) Sympathetic and (B) parasympathetic electrical activity from the cervical superior nerves. The bars represent the mean ± SEM of the firing rates from sympathetic nerves and vagus nerves from 12 rats that were obtained from four different litters for each experimental group. Representative records of nerve discharges for each experimental group are in the lower panels. *p <0.02 and ****p <0.0001 by Student’s t-test.
Figure 5
Figure 5
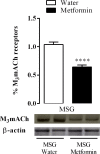
Effect of metformin treatment on M3AChR protein expression in the pancreatic islets from nine rats of three different litters per group for each experimental group. ****p <0.0001 by Student’s t-test. Representative western blotting images were originated from the same membrane.

References

    1. Hurt RT, Kulisek C, Buchanan LA, McClave SA. The Obesity Epidemic: Challenges, Health Initiatives, and Implications for Gastroenterologists. Gastroenterol Hepatol (N Y) (2010) 6:780–92. - PMC - PubMed
    1. Sommer I, Griebler U, Mahlknecht P, Thaler K, Bouskill K, Gartlehner G, et al. . Socioeconomic Inequalities in non-Communicable Diseases and Their Risk Factors: An Overview of Systematic Reviews. BMC Public Health (2015) 15:914. 10.1186/s12889-015-2227-y - DOI - PMC - PubMed
    1. Roberts CK, Hevener AL, Barnard RJ. Metabolic Syndrome and Insulin Resistance: Underlying Causes and Modification by Exercise Training. Compr Physiol (2013) 3:1–58. 10.1002/cphy.c110062 - DOI - PMC - PubMed
    1. Quinn BJ, Kitagawa H, Memmott RM, Gills JJ, Dennis PA. Repositioning Metformin for Cancer Prevention and Treatment. Trends Endocrinol Metab (2013) 24:469–80. 10.1016/j.tem.2013.05.004 - DOI - PubMed
    1. Ling He. Metformin and Systemic Metabolism. Trends Pharmacol Sci (2020) 41:11. 10.1016/j.tips.2020.09.001 - DOI - PMC - PubMed

Publication types

MeSH terms