

Investigation of Spaceflight Induced Changes to Astronaut Microbiomes
- PMID: 34149649
- PMCID: PMC8207296
- DOI: 10.3389/fmicb.2021.659179
Investigation of Spaceflight Induced Changes to Astronaut Microbiomes
Abstract
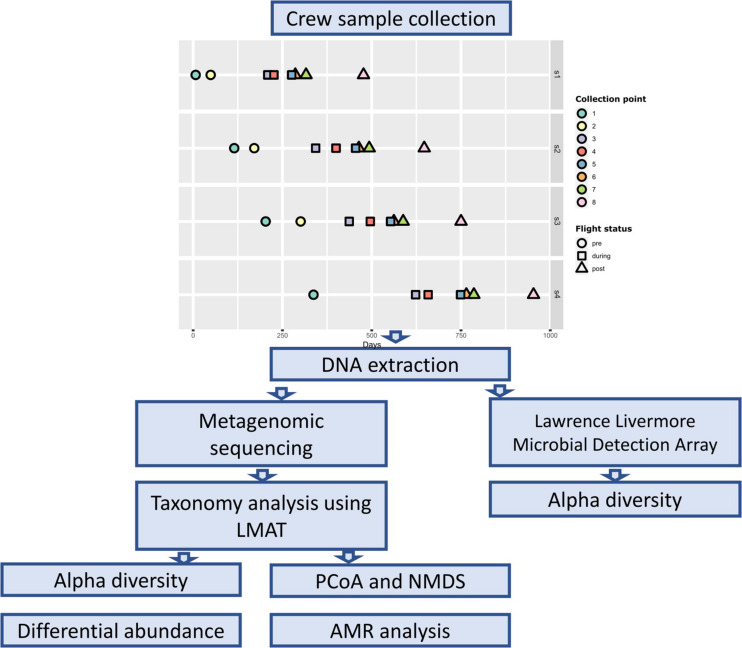
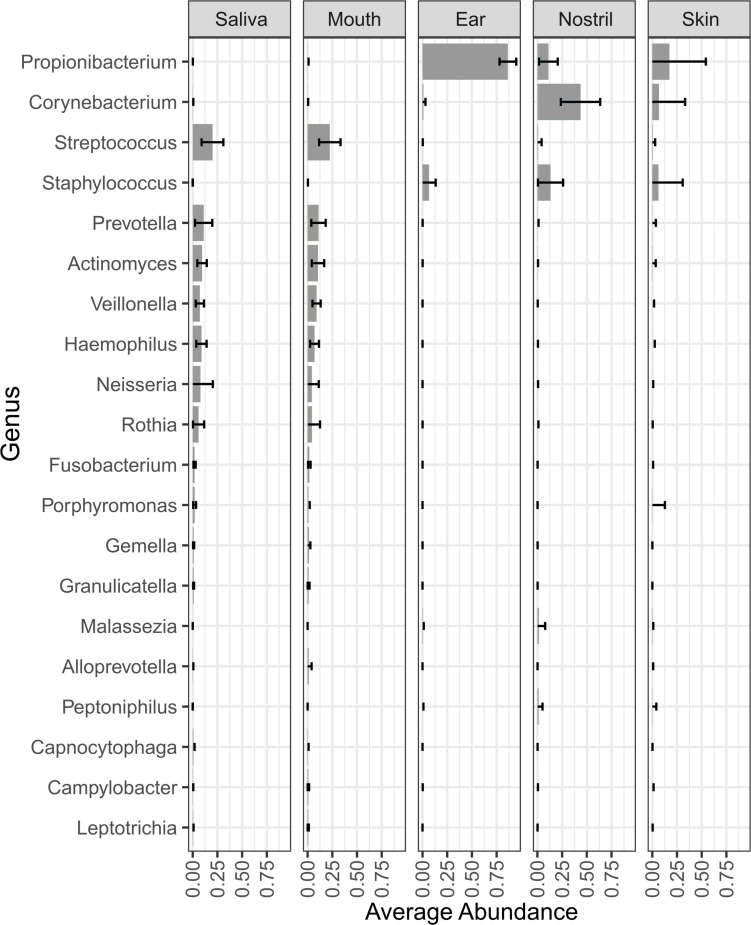
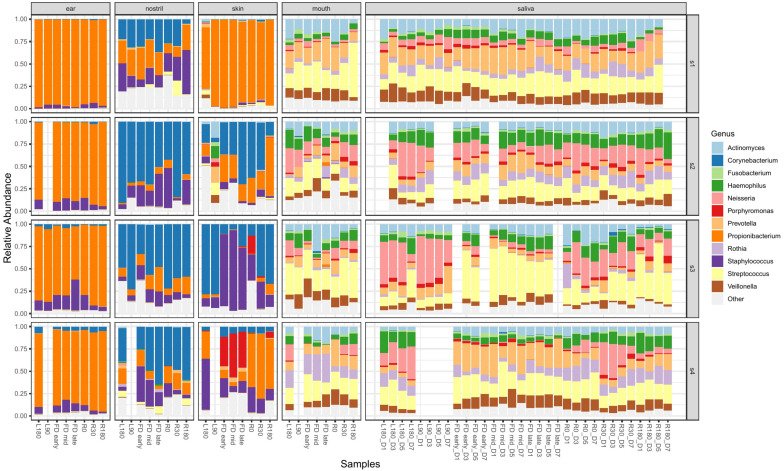
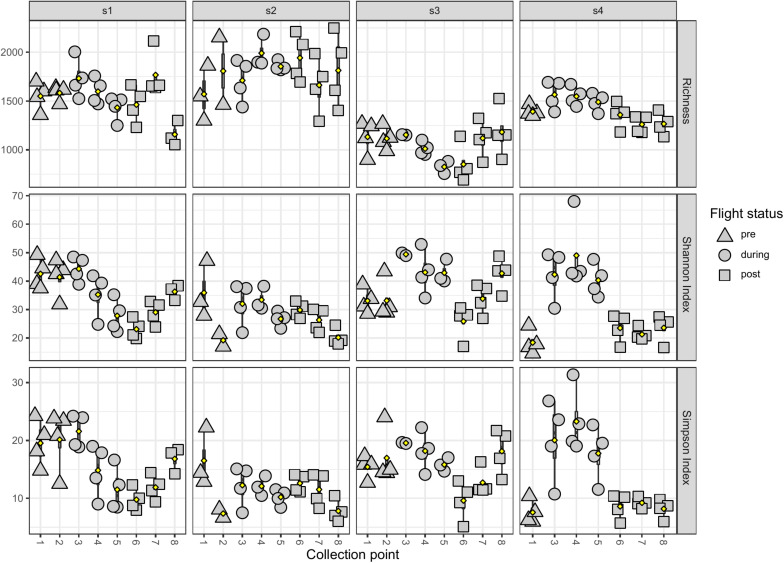
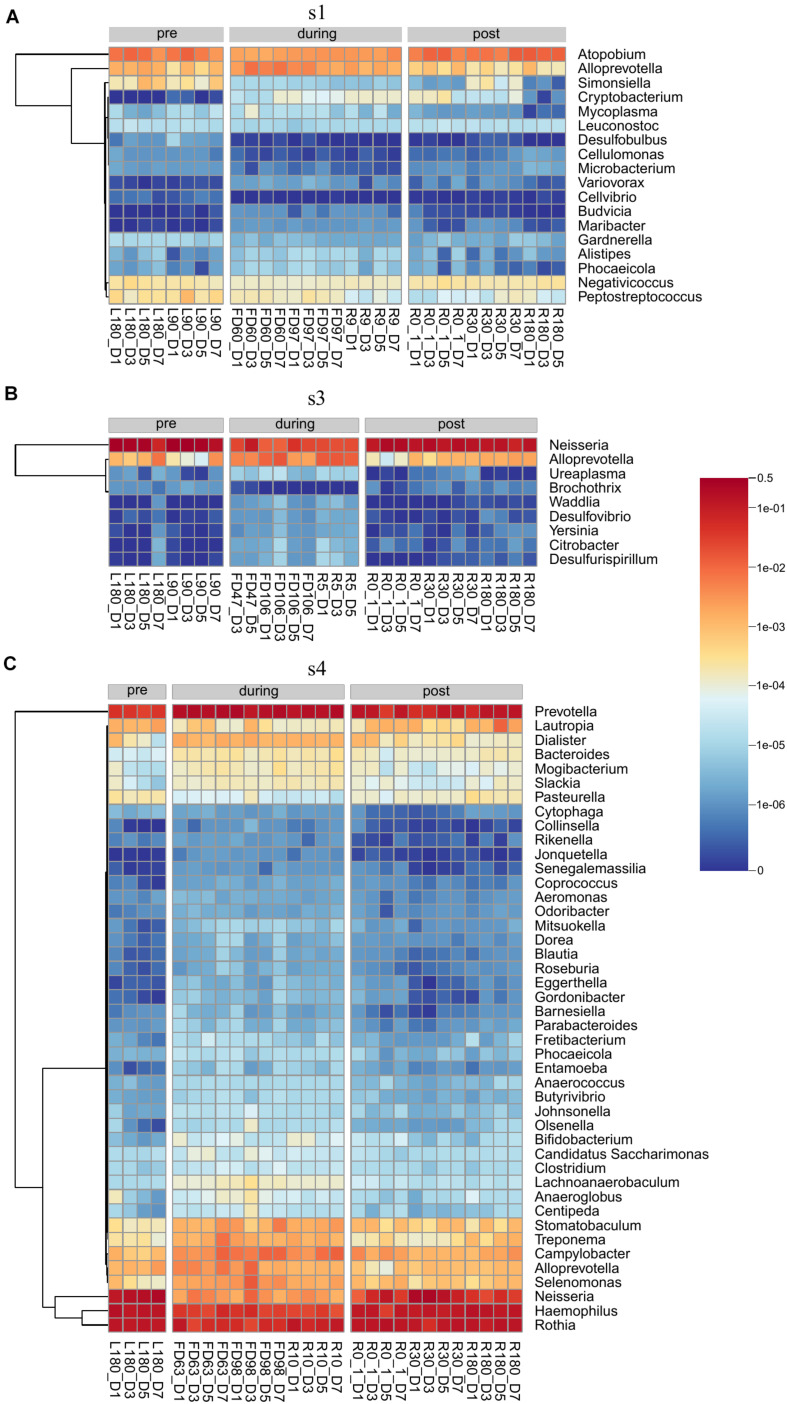
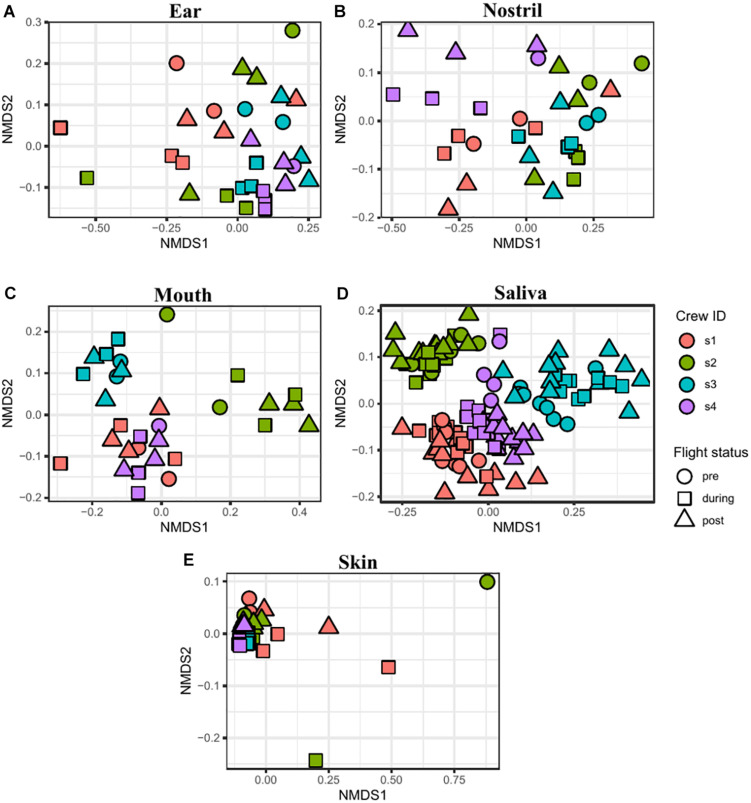
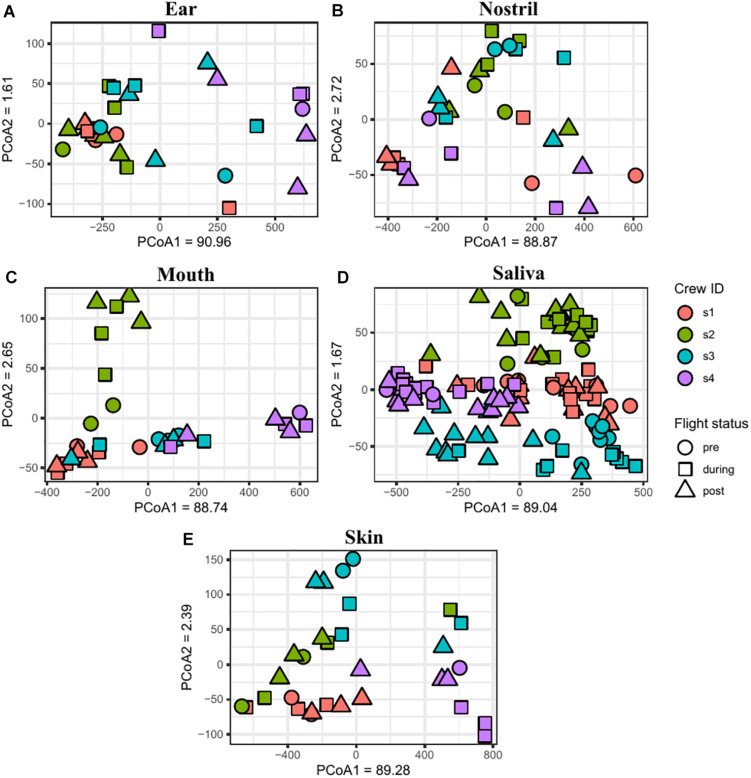
The International Space Station (ISS) is a uniquely enclosed environment that has been continuously occupied for the last two decades. Throughout its operation, protecting the health of the astronauts on-board has been a high priority. The human microbiome plays a significant role in maintaining human health, and disruptions in the microbiome have been linked to various diseases. To evaluate the effects of spaceflight on the human microbiome, body swabs and saliva samples were collected from four ISS astronauts on consecutive expeditions. Astronaut samples were analyzed using shotgun metagenomic sequencing and microarrays to characterize the microbial biodiversity before, during, and after the astronauts' time onboard the ISS. Samples were evaluated at an individual and population level to identify changes in microbial diversity and abundance. No significant changes in the number or relative abundance of taxa were observed between collection time points when samples from all four astronauts were analyzed together. When the astronauts' saliva samples were analyzed individually, the saliva samples of some astronauts showed significant changes in the relative abundance of taxa during and after spaceflight. The relative abundance of Prevotella in saliva samples increased during two astronauts' time onboard the ISS while the relative abundance of other commensal taxa such as Neisseria, Rothia, and Haemophilus decreased. The abundance of some antimicrobial resistance genes within the saliva samples also showed significant changes. Most notably, elfamycin resistance gene significantly increased in all four astronauts post-flight and a CfxA6 beta-lactam marker significantly increased during spaceflight but returned to normal levels post-flight. The combination of both shotgun metagenomic sequencing and microarrays showed the benefit of both technologies in monitoring microbes on board the ISS. There were some changes in each astronaut's microbiome during spaceflight, but these changes were not universal for all four astronauts. Two antimicrobial resistance gene markers did show a significant change in abundance in the saliva samples of all four astronauts across their collection times. These results provide insight for future ISS microbial monitoring studies and targets for antimicrobial resistance screenings.
Keywords: astronaut; international space station; metagenomics; microarray; microbiome; spaceflight.
Copyright © 2021 Morrison, Thissen, Karouia, Mehta, Urbaniak, Venkateswaran, Smith and Jaing.
Conflict of interest statement
The authors declare that the research was conducted in the absence of any commercial or financial relationships that could be construed as a potential conflict of interest.
Figures
References
-
- Aitchison J. (1982). The statistical analysis of compositional data. J. R. Stat. Soc. Ser. B 44 139–177.
-
- Anderson M. J. (2001). A new method for non-parametric multivariate analysis of variance: non-parametric manova for ecology. Austral Ecol. 26 32–46. 10.1111/j.1442-9993.2001.01070.pp.x - DOI
LinkOut - more resources
Full Text Sources