. 2021 Jun 3:12:666231.
doi: 10.3389/fimmu.2021.666231. eCollection 2021.

Optical Control of CD8+ T Cell Metabolism and Effector Functions

Affiliations

Optical Control of CD8+ T Cell Metabolism and Effector Functions

Andrea M Amitrano et al. Front Immunol. .

Abstract

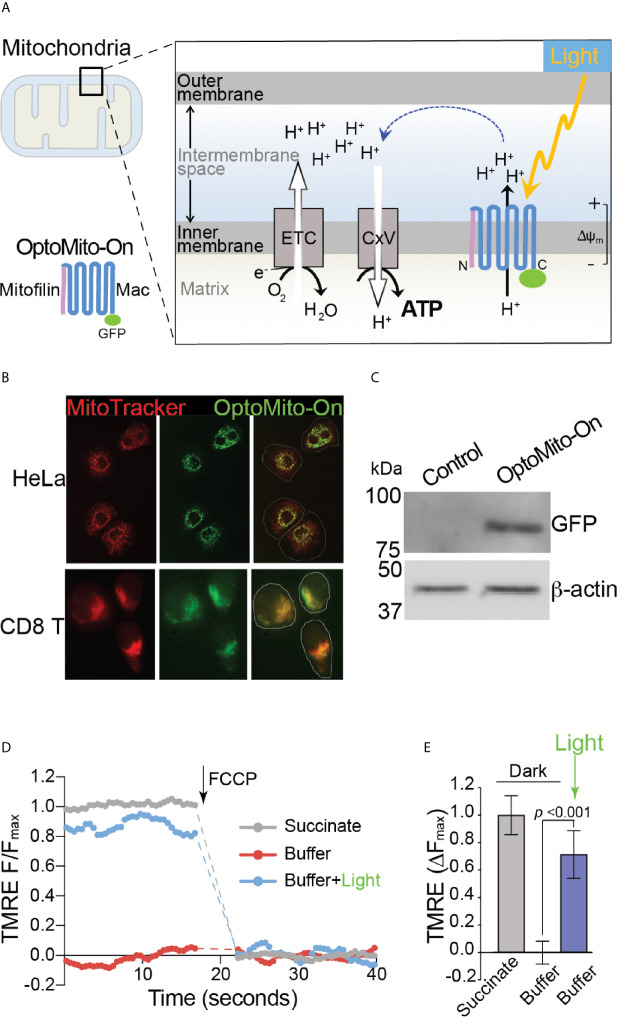
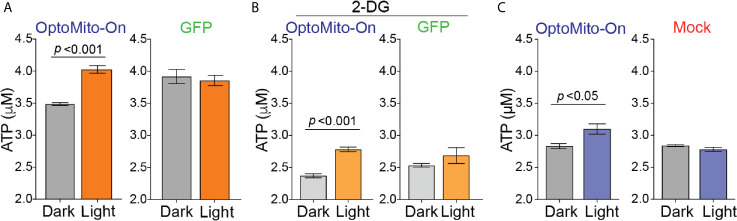
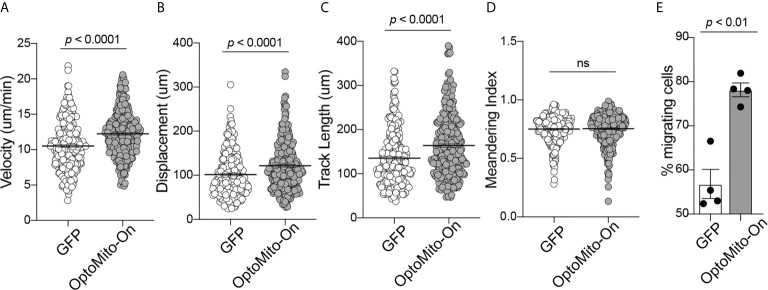
Although cancer immunotherapy is effective against hematological malignancies, it is less effective against solid tumors due in part to significant metabolic challenges present in the tumor microenvironment (TME), where infiltrated CD8+ T cells face fierce competition with cancer cells for limited nutrients. Strong metabolic suppression in the TME is often associated with impaired T cell recruitment to the tumor site and hyporesponsive effector function via T cell exhaustion. Increasing evidence suggests that mitochondria play a key role in CD8+ T cell activation, effector function, and persistence in tumors. In this study, we showed that there was an increase in overall mitochondrial function, including mitochondrial mass and membrane potential, during both mouse and human CD8+ T cell activation. CD8+ T cell mitochondrial membrane potential was closely correlated with granzyme B and IFN-γ production, demonstrating the significance of mitochondria in effector T cell function. Additionally, activated CD8+ T cells that migrate on ICAM-1 and CXCL12 consumed significantly more oxygen than stationary CD8+ T cells. Inhibition of mitochondrial respiration decreased the velocity of CD8+ T cell migration, indicating the importance of mitochondrial metabolism in CD8+ T cell migration. Remote optical stimulation of CD8+ T cells that express our newly developed "OptoMito-On" successfully enhanced mitochondrial ATP production and improved overall CD8+ T cell migration and effector function. Our study provides new insight into the effect of the mitochondrial membrane potential on CD8+ T cell effector function and demonstrates the development of a novel optogenetic technique to remotely control T cell metabolism and effector function at the target tumor site with outstanding specificity and temporospatial resolution.

Keywords: T cell migration; cancer immunotherapy; effector T cell; metabolism; optogenetics.


Conflict of interest statement

The authors declare that the research was conducted in the absence of any commercial or financial relationships that could be construed as a potential conflict of interest.

Figures

Figure 1
Figure 1
Mitochondrial function increases during CD8+ T cell activation. Flow cytometry analysis of (A) MitoTracker Green FM, reflecting mitochondrial mass, and (B) Tetramethylrhodamine (TMRM), reflecting mitochondrial membrane potential, displayed as mean fluorescence intensity (MFI) during human CD8+ T cell activation (n = 7 donors). Flow cytometry analysis of (C) MitoTracker Green FM and (D) TMRM shown in MFI during mouse CD8+ T cell activation (n = 5-7 mice). (E) The oxygen consumption rate (OCR), measured with the Seahorse MitoStress Test, of naïve (Day 0, PLL + CCL21 coated wells) and activated (Day 5, PLL + CXCL12 coated wells) CD8+ T cells, normalized to protein content with a BCA assay; data shown as mean ± SEM (Representative of two independent experiments, n = 10 wells per group, error bars fall within symbols). All data shown as mean ± SEM. (A, B) Repeated measures one-way ANOVA with Bonferroni’s post-test. (C, D) Ordinary one-way ANOVA with Bonferroni’s post-test. (E) 2way ANOVA with Bonferroni’s post-test.
Figure 2
Figure 2
Mitochondrial respiration is important for cytokine production and migration of CD8+ T cells. Flow cytometry MFI of (A) Granzyme B and (B) IFN-γ production throughout mouse CD8+ T cell activation, shown as a function of TMRM MFI (n = 6 mice). (C) The complete OCR trace and (D) the basal OCR measured with the Seahorse MitoStress Test, of activated CD8+ T cells on Poly-L-lysine ± CXCL12, or migrating on ICAM-1 with CXCL12 (Representative of three independent experiments). (E) The velocity of activated CD8+ T cells migrating on ICAM-1 + CXCL12. Treated cells (2 µM oligomycin or 2 µM FCCP) were incubated with the drug for 20 minutes before the start of the 20-minute movie (Representative of three experiments). Migration data analyzed with Volocity software. (A, B) Pearson’s correlation. (D, E) Data shown as mean ± SEM and analyzed by one-way ANOVA with a Bonferroni post-test.
Figure 3
Figure 3
Characterization of OptoMito-On. (A) Illustration of photoactivatable oxidative phosphorylation by OptoMito-On construct. (B) Images of HeLa cells and CD8+ T cells expressing OptoMito-On and stained with MitoTracker Red CMXRos. (C) Immunoblot comparing control HEK293T cell lysate and HEK293T OptoMito-On cell lysate. The full-length OptoMito-On construct is 82 kDa and probed for with an anti-GFP antibody. β-actin is used as loading control. Both images are from the same lanes on one membrane. (D) Representative TMRE fluorescence trace of isolated mitochondria from OptoMito-On expressing HEK293T cells before and after addition of FCCP. Dashed lines indicate where FCCP was added. (E) Quantification of change in TMRE fluorescence. Data shown as mean ± SEM and analyzed by One-Way ANOVA with a Bonferroni post-test (n = 4).
Figure 4
Figure 4
Activation of OptoMito-On increases ATP production. (A) HEK293T cells expressing OptoMito-On or GFP were illuminated with 590 nm light for 2 hours, followed by a luciferase-based ATP assay. (B) Same set-up as in (A), except HEK293T cells were treated with 10 mM 2-DG for 2 hours prior to illumination. (C) Activated CD8+ T cells were sorted based on GFP expression. GFP negative cells were used as the mock control. CD8+ T cells received 590 nm light for 30 minutes, followed by a luciferase-based ATP assay. All data shown as mean ± SEM and analyzed by an unpaired t-test (n = 4-7).
Figure 5
Figure 5
Activation of OptoMito-On increases CD8+ T cell migration. The velocity (A), displacement (B), track length (C), meandering index (D), and percent migrating cells (E) of Mock (or GFP) and OptoMito-On expressing Day 4 CD8+ T cells migrating on ICAM-1 + CXCL12. The percentage of migrating cells was calculated as the number of cells migrating 5-20 µm/min divided by the total number of cells in the field of view during the 20-minute movie. All movies received 500 nm illumination and were analyzed with Volocity software. All data shown as mean ± SEM and analyzed by a two-tailed unpaired t-test with Welch’s correction (A–D: includes four independent experiments, Mock: 271 cells, OptoMito-On: 312 cells; E : n = 4 movies on the same day). ns, not significant.
Figure 6
Figure 6
OptoMito-On activation increases cytoskeletal rearrangements. (A) Heat map showing the fold change in protein expression from the dark to light conditions of the Full Moon BioSystems Cytoskeleton Phospho antibody array (n = 3). (B) Representative antibody array images of a few proteins of interest, FAK, Src, and MEK1.
Figure 7
Figure 7
OptoMito-On activation increases CD8+ T cell effector functions. Flow cytometry results from an 18-hour light activation of GFP or OptoMito-On expressing CD8+ T cells looking at the percentage of Granzyme B+ cells (A) and Granzyme B MFI (B) (n = 3). (C) Flow cytometry results of a 3-hour co-culture of OVA pulsed EL-4 cells with GFP or OptoMito-On expressing OT-I T cells. The graph shows the percent change of Annexin-V MFI of EL-4 cells from the dark to light condition. OT-I T cells were either kept in the dark or received 16-17 hours of 530 nm light before the addition of EL-4 cells. All data shown as mean ± SEM, A-B analyzed by One-Way ANOVA with a Bonferroni post-test, C analyzed by one-tailed paired t test (A, B: representative of two experiments, C: four independent experiments). ns, not significant.

Similar articles

Cited by

References

    1. Restifo NP, Dudley ME, Rosenberg SA. Adoptive Immunotherapy for Cancer: Harnessing the T Cell Response. Nat Rev Immunol (2012) 12:269. 10.1038/nri3191 - DOI - PMC - PubMed
    1. Eshhar Z, Waks T, Gross G, Schindler DG. Specific Activation and Targeting of Cytotoxic Lymphocytes Through Chimeric Single Chains Consisting of Antibody-Binding Domains and the Gamma or Zeta Subunits of the Immunoglobulin and T-cell Receptors. Proc Natl Acad Sci (1993) 90:720–4. 10.1073/pnas.90.2.720 - DOI - PMC - PubMed
    1. Brentjens RJ, Davila ML, Riviere I, Park J, Wang X, Cowell LG, et al. . Cd19-Targeted T Cells Rapidly Induce Molecular Remissions in Adults With Chemotherapy-Refractory Acute Lymphoblastic Leukemia. Sci Trans Med (2013) 5:177ra138–177ra138. 10.1126/scitranslmed.3005930 - DOI - PMC - PubMed
    1. Srivastava S, Riddell SR. Chimeric Antigen Receptor T Cell Therapy: Challenges to Bench-to-Bedside Efficacy. J Immunol (2018) 200:459–68. 10.4049/jimmunol.1701155 - DOI - PMC - PubMed
    1. Scharping NE, Menk AV, Moreci RS, Whetstone RD, Dadey RE, Watkins SC, et al. . The Tumor Microenvironment Represses T Cell Mitochondrial Biogenesis to Drive Intratumoral T Cell Metabolic Insufficiency and Dysfunction. Immunity (2016) 45:374–88. 10.1016/j.immuni.2016.07.009 - DOI - PMC - PubMed

Publication types

MeSH terms