

Guide to Plant-PET Imaging Using 11CO2
- PMID: 34149742
- PMCID: PMC8206809
- DOI: 10.3389/fpls.2021.602550
Guide to Plant-PET Imaging Using 11CO2
Abstract
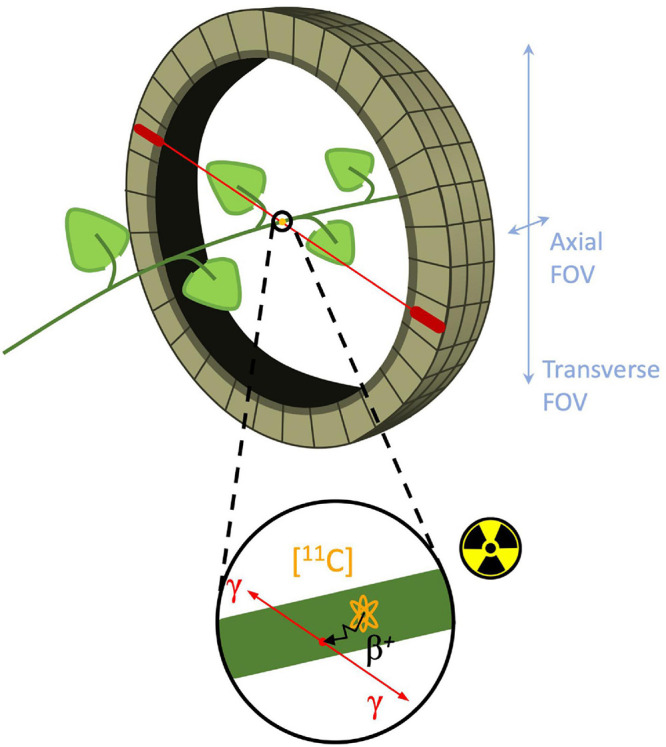
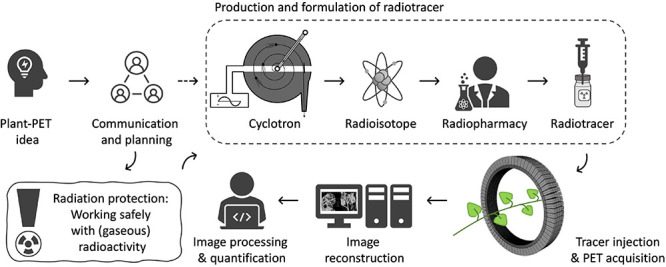
Due to its high sensitivity and specificity for tumor detection, positron emission tomography (PET) has become a standard and widely used molecular imaging technique. Given the popularity of PET, both clinically and preclinically, its use has been extended to study plants. However, only a limited number of research groups worldwide report PET-based studies, while we believe that this technique has much more potential and could contribute extensively to plant science. The limited application of PET may be related to the complexity of putting together methodological developments from multiple disciplines, such as radio-pharmacology, physics, mathematics and engineering, which may form an obstacle for some research groups. By means of this manuscript, we want to encourage researchers to study plants using PET. The main goal is to provide a clear description on how to design and execute PET scans, process the resulting data and fully explore its potential by quantification via compartmental modeling. The different steps that need to be taken will be discussed as well as the related challenges. Hereby, the main focus will be on, although not limited to, tracing 11CO2 to study plant carbon dynamics.
Keywords: 11CO2; carbon-11 (11C); guide; image analysis; image quantification; plant-PET; positron autoradiography; positron emission tomography (PET).
Copyright © 2021 Mincke, Courtyn, Vanhove, Vandenberghe and Steppe.
Conflict of interest statement
The authors declare that the research was conducted in the absence of any commercial or financial relationships that could be construed as a potential conflict of interest.
Figures
Similar articles
-
Studying in vivo dynamics of xylem-transported 11CO2 using positron emission tomography.Tree Physiol. 2020 Jul 30;40(8):1058-1070. doi: 10.1093/treephys/tpaa048. Tree Physiol. 2020. PMID: 32333788
-
More advantages in detecting bone and soft tissue metastases from prostate cancer using 18F-PSMA PET/CT.Hell J Nucl Med. 2019 Jan-Apr;22(1):6-9. doi: 10.1967/s002449910952. Epub 2019 Mar 7. Hell J Nucl Med. 2019. PMID: 30843003
-
Abass Alavi: A giant in Nuclear Medicine turns 80 and is still going strong!Hell J Nucl Med. 2018 Jan-Apr;21(1):85-87. doi: 10.1967/s002449910713. Epub 2018 Mar 20. Hell J Nucl Med. 2018. PMID: 29550853
-
Positron emission tomography instrumentation: an overview.Am J Physiol Imaging. 1988;3(3):142-53. Am J Physiol Imaging. 1988. PMID: 3056465 Review.
-
Positron Emission Tomography: Current Challenges and Opportunities for Technological Advances in Clinical and Preclinical Imaging Systems.Annu Rev Biomed Eng. 2015;17:385-414. doi: 10.1146/annurev-bioeng-071114-040723. Annu Rev Biomed Eng. 2015. PMID: 26643024 Free PMC article. Review.
Cited by
-
Crop/Plant Modeling Supports Plant Breeding: II. Guidance of Functional Plant Phenotyping for Trait Discovery.Plant Phenomics. 2023 Sep 28;5:0091. doi: 10.34133/plantphenomics.0091. eCollection 2023. Plant Phenomics. 2023. PMID: 37780969 Free PMC article. Review.
-
A Synthetic Review of Various Dimensions of Non-Destructive Plant Stress Phenotyping.Plants (Basel). 2023 Apr 18;12(8):1698. doi: 10.3390/plants12081698. Plants (Basel). 2023. PMID: 37111921 Free PMC article. Review.
-
Metabolization and sequestration of plant specialized metabolites in insect herbivores: Current and emerging approaches.Front Physiol. 2022 Sep 27;13:1001032. doi: 10.3389/fphys.2022.1001032. eCollection 2022. Front Physiol. 2022. PMID: 36237530 Free PMC article. Review.
-
Advances in Preclinical PET.Semin Nucl Med. 2022 May;52(3):382-402. doi: 10.1053/j.semnuclmed.2022.02.002. Epub 2022 Mar 18. Semin Nucl Med. 2022. PMID: 35307164 Free PMC article. Review.
-
Optimizing positron emission tomography for accurate plant imaging using Monte Carlo simulations to correct positron range effects.Sci Rep. 2025 Apr 22;15(1):13847. doi: 10.1038/s41598-025-95670-y. Sci Rep. 2025. PMID: 40263448 Free PMC article.
References
-
- Agtuca B., Rieger E., Hilger K., Song L., Robert C. A. M., Erb M., et al. (2014). Carbon-11 reveals opposing roles of auxin and salicylic acid in regulating leaf physiology, leaf metabolism, and resource allocation patterns that impact root growth in Zea mays. J. Plant Growth Regul. 33 328–339. 10.1007/s00344-013-9379-8 - DOI
-
- Alexoff D. L., Dewey S. L., Vaska P., Krishnamoorthy S., Ferrieri R., Schueller M., et al. (2011). PET imaging of thin objects: measuring the effects of positron range and partial-volume averaging in the leaf of Nicotiana tabacum. Nucl. Med. Biol. 38 191–200. 10.1016/j.nucmedbio.2010.08.004 - DOI - PubMed
LinkOut - more resources
Full Text Sources