The correlation between PLR-NLR and prognosis in acute myocardial infarction
- PMID: 34150072
- PMCID: PMC8205844
The correlation between PLR-NLR and prognosis in acute myocardial infarction
Abstract
Objective: To explore the correlation between the prognosis of acute myocardial infarction (AMI) and the platelet to lymphocyte ratio (PLR)-neutrophil to lymphocyte ratio (NLR).
Methods: A retrospective analysis was performed on the data of 300 patients with AMI admitted to our hospital between August 2016 and August 2019. The general data, data on the patients' major adverse cardiovascular and cerebrovascular events (MACCE), the global registry of acute coronary events (GRACE), and the different groups of patients' survival times were compared.
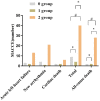
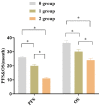
Results: The area under the curve (AUC) of PLR was 0.810 [95% CI (0.751, 0.869), P < 0.001]. The AUC value of NLR was 0.882 [95% CI (0.839, 0.925), P < 0.001]. In our study, 102 patients were placed in the high PLR group, 198 patients were placed in the low PLR group, 126 patients were placed in the high NLR group, 174 patients were placed in the low NLR group, 174 patients were placed in PLR-NLR group 0, 24 patients were placed in PLR-NLR group 1, and 102 patients were placed in PLR-NLR group 2. The heart rates (HR) and brain natriuretic peptide (BNP) levels in Group 0 were the lowest among the three groups (P < 0.05), and the cTnI levels were observably lower than they were in Group 2 (P < 0.05). The patients' HR and BNP ratios in Group 1 were notably lower than the HR and BNP ratios in Group 2 (P < 0.05). The lowest incidence of MACCE was found in PLR-NLR Group 0. The number of intermediate-risk of patients in Group 0 was the lowest among the three groups. The order of the overall survival (OS) and the progression-free survival (PFS) of the three PLR-NLR Groups 0 were Group 0 > Group 1 > Group 2 (P < 0.001). The survival rate (SR) of the patients in PLR-NLR Group 0 was 100% within 2 years, which was significantly greater than the survival rates in Group 1 and Group 2 (P < 0.05). The SR of the patients in Group 0 was 98.8% within five years, which was also significantly higher than the survival rates in Groups 1 and 2 (P < 0.05).
Conclusion: The PLR-NLR combination has an essential effect on the prognostic analysis of AMI. The incidence of MACCE increases with an increase in PLR-NLR.
Keywords: AMI; NLR; PLR; prognostic analysis.
AJTR Copyright © 2021.
Conflict of interest statement
None.
Figures


References
-
- Itzhaki Ben Zadok O, Hasdai D, Gottlieb S, Porter A, Beigel R, Shimony A, Cohen T, Shlomo N, Shohat T, Silverman B, Kornowski R, Iakobishvili Z. Characteristics and outcomes of patients with cancer presenting with acute myocardial infarction. Coron Artery Dis. 2019;30:332–338. - PubMed
-
- Çetinkal G, Koçaş C, Balaban Koçaş B, Arslan Ş, Abacı O, Karaca O, Dalgıç Y, Ser ÖS, Keskin K, Yıldız A, Doğan SM. Comparative performance of anticoagulation and risk factors in atrial fibrillation and global registry of acute coronary events risk scores in predicting long-term adverse events in patients with acute myocardial infarction. Anatol J Cardiol. 2018;20:77–84. - PMC - PubMed
-
- Singer AJ, Than MP, Smith S, McCullough P, Barrett TW, Birkhahn R, Reed M, Thode HC, Arnold WD, Daniels LB, de Filippi C, Headden G, Peacock WF. Missed myocardial infarctions in ED patients prospectively categorized as low risk by established risk scores. Am J Emerg Med. 2017;35:704–709. - PubMed
-
- Zuin M, Rigatelli G, Picariello C, dell’Avvocata F, Marcantoni L, Pastore G, Carraro M, Nanjundappa A, Faggian G, Roncon L. Correlation and prognostic role of neutrophil to lymphocyte ratio and SYNTAX score in patients with acute myocardial infarction treated with percutaneous coronary intervention: a six-year experience. Cardiovasc Revasc Med. 2017;18:565–571. - PubMed
LinkOut - more resources
Full Text Sources
Research Materials
