. 2014 Oct 23:1:19-28.
doi: 10.1016/j.meteno.2014.09.001. eCollection 2014 Dec.

Tailoring strain construction strategies for muconic acid production in S. cerevisiae and E. coli

Affiliations

Tailoring strain construction strategies for muconic acid production in S. cerevisiae and E. coli

Nils J H Averesch et al. Metab Eng Commun. .

Abstract

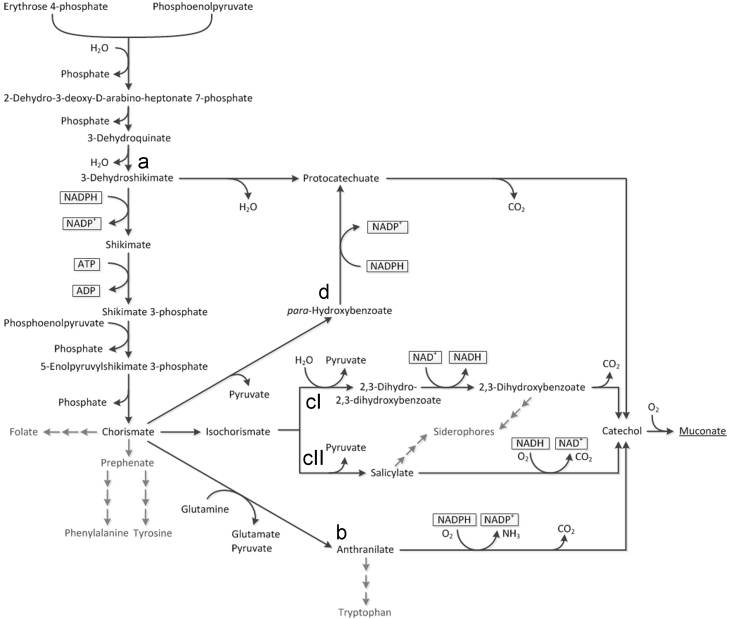
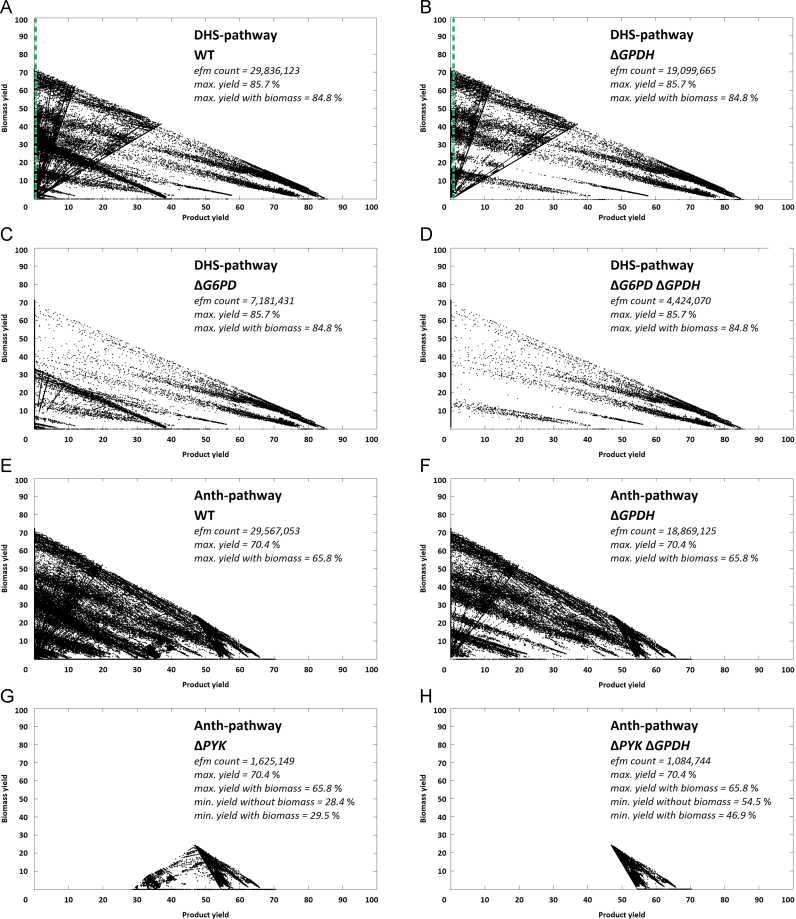
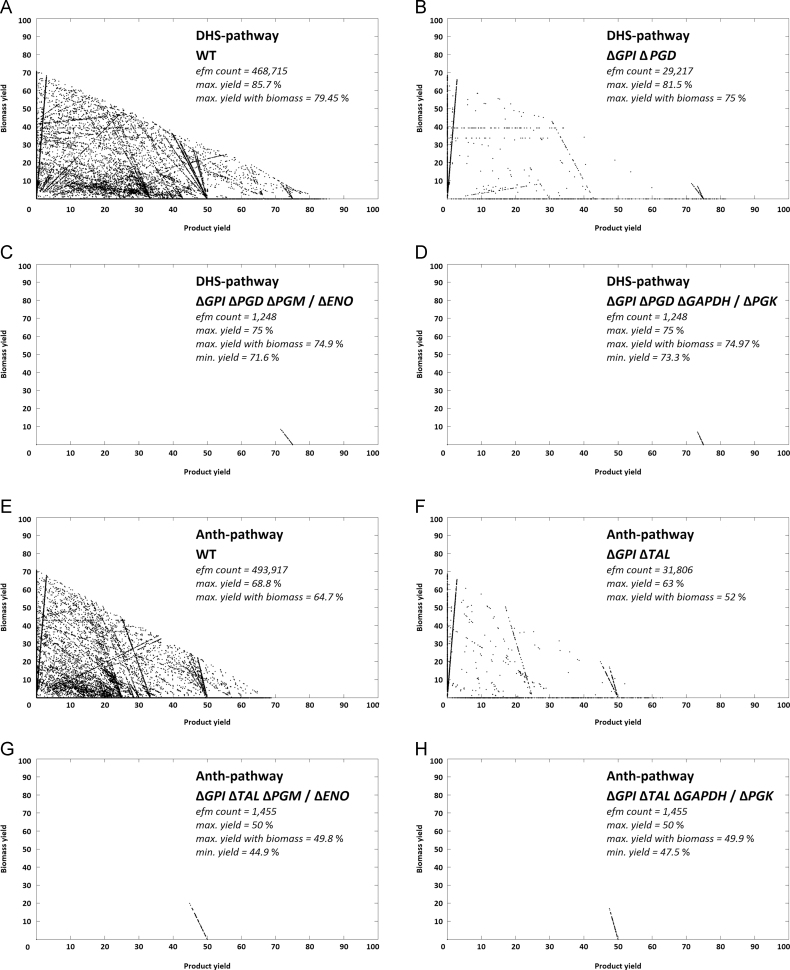
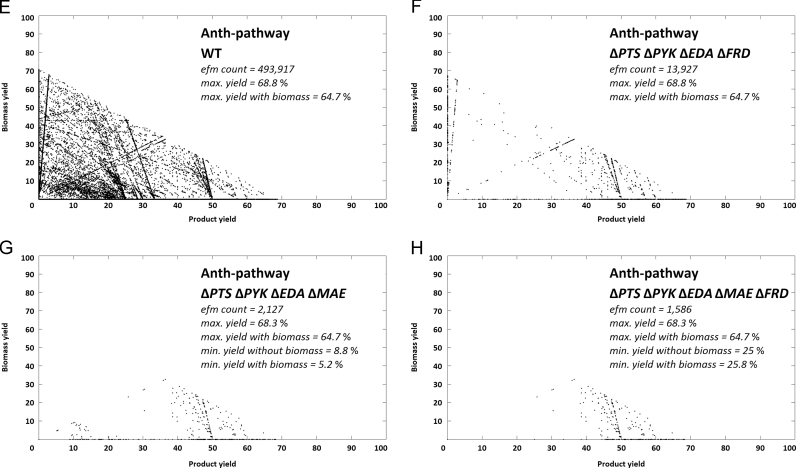
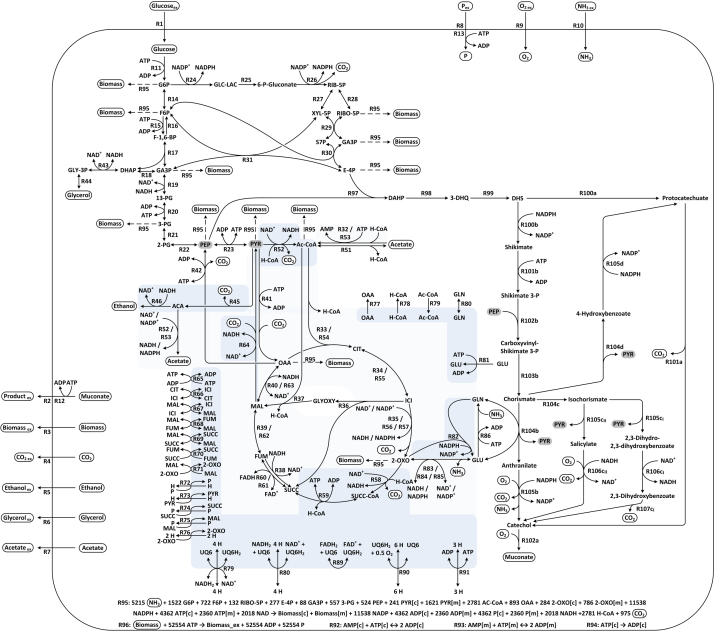
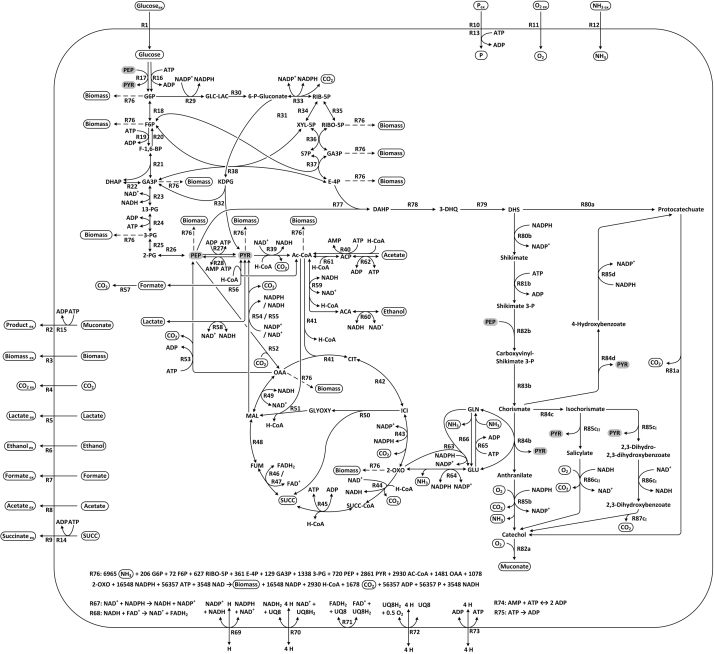
There is currently a strong interest to derive the biological precursor cis,cis-muconic acid from shikimate pathway-branches to develop a biological replacement for adipic acid. Pioneered by the Frost laboratory this concept has regained interest: Recent approaches (Boles, Alper, Yan) however suffer from low product titres. Here an in silico comparison of all strain construction strategies was conducted to highlight stoichiometric optimizations. Using elementary mode analysis new knock-out strategies were determined in Saccharomyces cerevisiae and Escherichia coli. The strain construction strategies are unique to each pathway-branch and organism, allowing significantly different maximum and minimum yields. The maximum theoretical product carbon yields on glucose ranged from 86% (dehydroshikimate-branch) to 69% (anthranilate-branch). In most cases a coupling of product formation to growth was possible. Especially in S. cerevisiae chorismate-routes a minimum yield constraint of 46.9% could be reached. The knock-out targets are non-obvious, and not-transferable, highlighting the importance of tailored strain construction strategies.

Keywords: ADH, acetaldehyde dehydrogenase; ANTH, anthranilate; Adipic; Carbon yield; DAHP, 3-deoxy-arabinoheptulosonate 7-phosphate; DHBA, 2,3-dihydroxybenzoate; DHS, 3-dehydroshikimate; E4P, erythrose 4-phosphate; EDA, 2-dehydro-3-deoxy-phosphogluconate aldolase; EDP, Entner–Doudoroff pathway; EFM, elementary flux modes; EMA, elementary mode analysis; EPSP, 5-enolpyruvylshikimate-3-phosphate; Elementary mode analysis; F6P, fructose-6-phosphate; FRD, fumarate reductase; G6PD, glucose-6-phosphate dehydrogenase; GPDH, glycerol-3-phosphate dehydrogenase; Knock-out strategies; LDH, lactate dehydrogenase; MAE, malic enzyme; Muconic; PCA, protocatechuate; PCK, phosphoenolpyruvate carboxykinase; PEP, phosphoenolpyruvate; PPP, pentose phosphate pathway; PPS, phosphoenolpyruvate synthase; PTS, phosphotransferase system; PYK, pyruvate kinase; SA, salicylate; WT, wild type; Ymax, maximum theoretical carbon yield; Ymin, minimum theoretical carbon yield; cMCs, constrained minimal cut sets; ccMA, cis,cis-muconic acid; pHBA, para-hydroxybenzoate.


Figures

Fig. 1
Fig. 1
Shikimate pathway with routes to muconic acid. Shikimate pathway outgoing from the precursors E4P and PEP with routes to ccMA including co-factors in each step. Adjacent pathways not involved in ccMA synthesis are greyed out. Triple arrows indicate multiple steps. The DHS-pathway (a) proceeds via protocatechuate outgoing from 3-dehydroshikimate, while the ANTH-pathway (b) branches off further downstream from chorismate via anthranilate. The DHBA-pathway (cI) and the SA-pathway (cII) both proceed via isochorismate. A route linking the chorismate derived routes with the DHS-pathway is the pHBA-pathway (d). Although all routes lead to formation of catechol prior to ring opening release of ccMA, the involved co-factors and metabolites to catechol formation are essentially different.
Fig. 2
Fig. 2
Yield vs. biomass plots of knock-out strategies for S. cerevisiae. Product vs. biomass yield plots of the EFM distribution of S. cerevisiae DHS- and ANTH-pathway networks. For each pathway four scenarios are shown, comparing the wild type with the determined knock-out metabolism, key data as well as respective knock-outs are indicated on the charts. Each point in a chart corresponds to the specific product and biomass yield of the respective elementary flux mode. Yields are carbon yields in %. A dashed vertical line indicates currently achieved product yields in the respective approaches.
Fig. 3
Fig. 3
Yield vs. biomass plots of knock-out strategies for E. coli. Product vs. biomass yield plots of the EFM distribution of E. coli networks. For each pathway four scenarios are shown, comparing the wild type with the determined knock-out metabolism, key data as well as respective knock-outs are indicated on the charts. Each point in a chart corresponds to the specific product and biomass yield of the respective elementary flux mode. Yields are carbon yields in %.
Fig. 4
Fig. 4
Yield vs. biomass plots of alternative knock-out strategy for E. coli ANTH-pathway. Product vs. biomass yield plots of the EFM distribution of E. coli networks. Four scenarios are shown, comparing the wild type with the determined knock-out metabolism, key data as well as respective knock-outs are indicated on the charts. Each point in a chart corresponds to the specific product and biomass yield of the respective elementary flux mode. Yields are carbon yields in %.
Supplementary file 2
Map of S. cerevisiae metabolic network. Graphical depiction of the metabolites interactions in the S. cerevisiae network. The reactions are identified by their number according to the network file (supplementary File 1). For better clarity “phosphate” (P) was left out from reactions in the figure unless involved in transport. Contribution to biomass formation (R95) is indicated with dashed arrows for the respective compounds. The two alternative routes to product formation are labelled with “a”–“d” according to Fig. 1. Mitochondrial processes are highlighted in blue (mitochondrial only) and light blue (reactions exist in mitochondria and cytosol).
Supplementary file 3
Map of E. coli metabolic network. Graphical depiction of the metabolites interactions in the E. coli network. The reactions are identified by their number according to the network file (supplementary File 1). For better clarity “phosphate” (P) was left out from reactions in the figure unless involved in transport. Contribution to biomass formation (R78) is indicated with dashed arrows for the respective compounds. The two alternative routes to product formation are labelled with “a” to “d” according to fig. 1. Key metabolites for the knock-out strategy are highlighted in grey.

References

    1. Alini S., Basile F., Blasioli S., Rinaldi C., Vaccari A. Development of new catalysts for N2O-decomposition from adipic acid plant. Appl. Catal. B Environ. 2007;70:323–329.
    1. Baba T., Ara T., Hasegawa M., Takai Y., Okumura Y., Baba M., Datsenko K.A., Tomita M., Wanner B.L., Mori H. Construction of Escherichia coli K-12 in-frame, single-gene knockout mutants: the Keio collection. Mol. Syst. Biol. 2006;2 (Article ID: 2006.0008) - PMC - PubMed
    1. Baneyx F. Recombinant protein expression in Escherichia coli. Curr. Opin. Biotechnol. 1999;10:411–421. - PubMed
    1. Bang S.-G., Choi C.Y. DO-stat fed-batch production of cis,cis-muconic acid from benzoic acid by Pseudomonas putida BM014. J. Ferment. Bioeng. 1995;79:381–383.
    1. Boles E., de Jong-Gubbels P., Pronk J.T. Identification and characterization of MAE1, the Saccharomyces cerevisiae structural gene encoding mitochondrial malic enzyme. J. Bacteriol. 1998;180:2875–2882. - PMC - PubMed