. 2021 Sep;6(3):135-143.
doi: 10.1016/j.synbio.2021.06.002. Epub 2021 Jun 14.

Association between the nasopharyngeal microbiome and metabolome in patients with COVID-19

Affiliations

Association between the nasopharyngeal microbiome and metabolome in patients with COVID-19

Jing Liu et al. Synth Syst Biotechnol. 2021 Sep.

Abstract

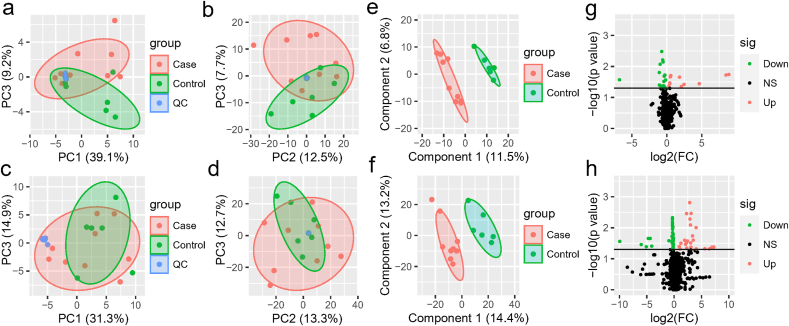
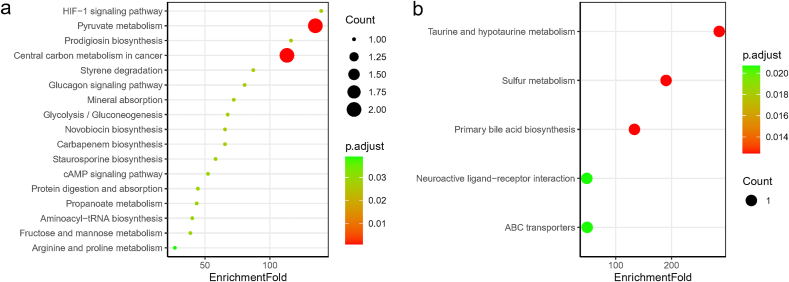
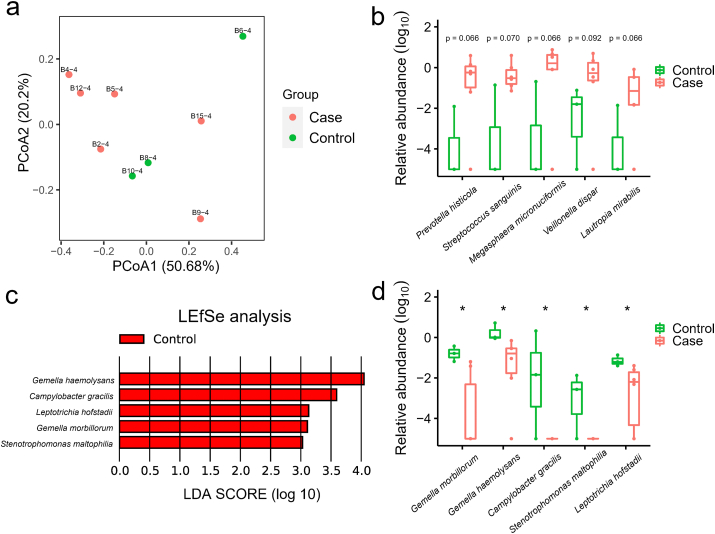
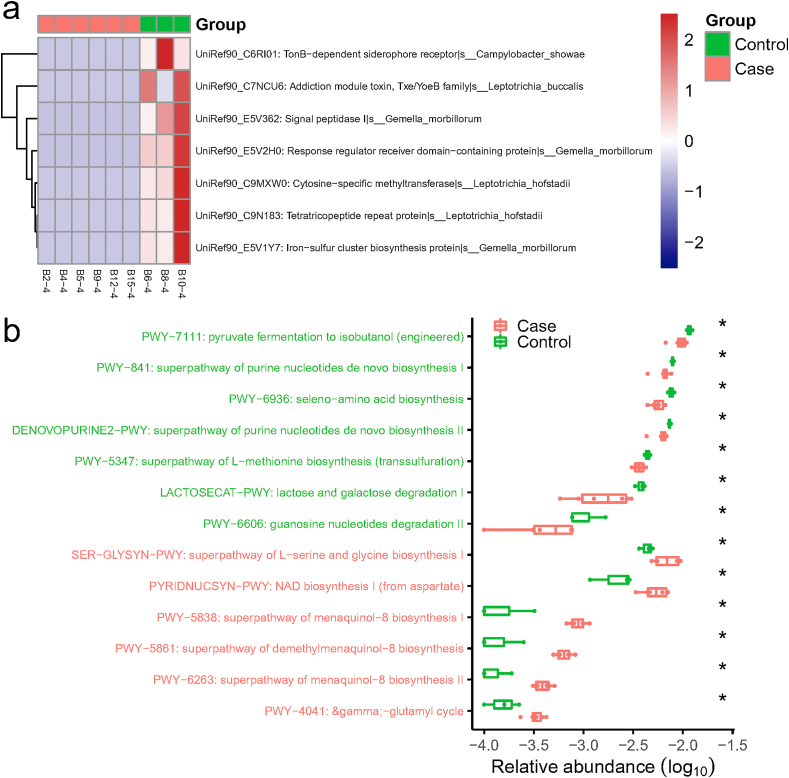
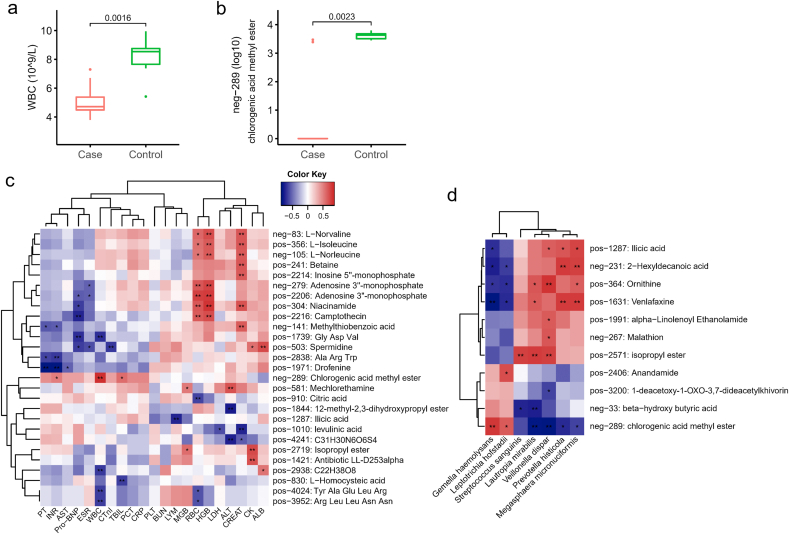
SARS-CoV-2, the causative agent for COVID-19, infect human mainly via respiratory tract, which is heavily inhabited by local microbiota. However, the interaction between SARS-CoV-2 and nasopharyngeal microbiota, and the association with metabolome has not been well characterized. Here, metabolomic analysis of blood, urine, and nasopharyngeal swabs from a group of COVID-19 and non-COVID-19 patients, and metagenomic analysis of pharyngeal samples were used to identify the key features of COVID-19. Results showed lactic acid, l-proline, and chlorogenic acid methyl ester (CME) were significantly reduced in the sera of COVID-19 patients compared with non-COVID-19 ones. Nasopharyngeal commensal bacteria including Gemella morbillorum, Gemella haemolysans and Leptotrichia hofstadii were notably depleted in the pharynges of COVID-19 patients, while Prevotella histicola, Streptococcus sanguinis, and Veillonella dispar were relatively increased. The abundance of G. haemolysans and L. hofstadii were significantly positively associated with serum CME, which might be an anti-SARS-CoV-2 bacterial metabolite. This study provides important information to explore the linkage between nasopharyngeal microbiota and disease susceptibility. The findings were based on a very limited number of patients enrolled in this study; a larger size of cohort will be appreciated for further investigation.

Keywords: COVID-19; Metabolome; Nasopharyngeal microbiome; SARS-CoV-2; Susceptibility.


Conflict of interest statement

The authors declare that they have no conflicts of interest.

Figures

Fig. 1
Fig. 1
The serum and urine metabolome. (a–b) The negative (a) and positive (b) ion modes of the serum metabolome between COVID-19 and non-COVID-19 patients. (c–d) The negative (c) and positive (d) ion modes of the urine metabolome between COVID-19 and non-COVID-19 pneumonia. Red indicates the COVID-19 samples, and green indicates the non-COVID-19 samples, while blue refers to quality-control (QC) samples. (e–f) PLS-DA score plot of all the 632 metabolites of serum (e) and 972 metabolites of urine (f). Case (red color) and control (green color) indicate the samples from COVID-19 and non-COVID-19, respectively. (g–h) Volcano plots (p-value ≤ 0.05 and fold change (FC) >1.2) identify statistically significant metabolites in serum (g) and urine (h) between COVID-19 and non-COVID-19 pneumonia. Red indicates up-regulated in COVID-19, while green indicates down-regulated in COVID-19.
Fig. 2
Fig. 2
Bubble plot of KEGG pathway enrichment for differential metabolites in serum (a), and differential metabolites in urine (b) of COVID-19 patients. 17 pathways were all down-regulated in serum (a) and they were contributed by lactate and l-Proline, while 5 pathways were all up-regulated in urine (b) that contributed by taurine. There were no up-regulated pathways in serum and down-regulated pathways in urine in COVID-19 patients compared to controls. The point size indicates the count of differential metabolites that involve in the corresponding pathways, and the color indicates the adjusted p value.
Fig. 3
Fig. 3
The metagenome analysis of the nasopharyngeal microbiome in COVID-19 and non- COVID-19 patients. (a) PCoA plot shows the composition of nasopharyngeal microbiota at the family level in COVID-19 (Case, n = 6) and non-COVID-19 (Control, n = 3) patients. (b) The species that were more abundant in the nasopharyngeal samples of COVID-19 patients with p value less than 0.1 (but not less than 0.05). The mean values and error bars were shown in the boxplots. P values, Wilcoxon rank-sum test, of each species were labelled above the boxplots. (c) The LDA Effect Size (LEfSe) analysis of the species in relative abundance between COVID-19 (Case) and non-COVID-19 (Control) patients. Five species were enriched in non-COVID-19 (Control) patients according to the LDA scores. (d) The significantly different species in relative abundance of nasopharyngeal microbiome between COVID-19 (Case) and non-COVID-19 (Control) patients. *, p value < 0.05.
Fig. 4
Fig. 4
The significantly different gene families and KEGG pathways between COVID-19 (Case) and non-COVID-19 (Control) patients. (a) Heat map of differential gene families (Wilcoxon rank-sum test, p < 0.01) in the nasopharyngeal samples. Specific species contributing to the abundance of these gene families were labelled in the figure. The horizontal color bar indicates the group of each sample. (b) Boxplots of significantly different KEGG pathways in two groups and the pathway names were colored according to direction of enrichment. Red indicated to be enriched in COVID-19 (Case), while green indicated to be enriched in non- COVID-19 (Control). *, p < 0.05.
Fig. 5
Fig. 5
The association of the serum metabolome and clinical phenotypes. (a) Boxplot of serum WBC between COVID-19 (Case) and non-COVID-19 (Control) patients. (b) The level of serum metabolite neg-289 in COVID-19 (Case) and non-COVID-19 (Control) patients. The metabolite's name of neg-289 is chlorogenic acid methyl ester (CME). P values were labelled above the boxplots (a, b). (c) Heat map showed the association of serum metabolome and clinical phenotypes in 15 patients. RBC, red blood cell; WBC, white blood cell; LYM, lymphocyte; HGB, haemoglobin; PLT, platelet count; AST, aspartate aminotransferase; ALT, alanine aminotransferase; ALB, albumin; TBIL, total bilirubin; BUN, blood urea nitrogen; CREAT, creatinine; CK, creatine kinase; LDH, Lactate dehydrogenase; MGB, myoglobin; Pro-BNP, pro B type natriuretic peptide; CTnI, cardiac troponin I; PT, prothrombin time; INR, international normalized ratio; PCT, procalcitonin level; CRP, C-reactive protein; ESR, erythrocyte sedimentation rate. (d) The significant association of several specific nasopharyngeal bacteria and serum metabolome. Red indicates the positive correlation and blue indicates the negative correlation (c–d). *, P < 0.05; **, P < 0.01.

References

    1. Zhou F. Clinical course and risk factors for mortality of adult inpatients with COVID-19 in Wuhan, China: a retrospective cohort study. Lancet. 2020;395(10229):1054–1062. - PMC - PubMed
    1. Wu Y. Relationship between ABO blood group distribution and clinical characteristics in patients with COVID-19. Clin Chim Acta. 2020;509:220–223. - PMC - PubMed
    1. Goker H. The effects of blood group types on the risk of COVID-19 infection and its clinical outcome. Turk J Med Sci. 2020;50(4):679–683. - PMC - PubMed
    1. Nguyen A. Human leukocyte antigen susceptibility map for severe acute respiratory Syndrome coronavirus 2. J Virol. 2020;94(13) - PMC - PubMed
    1. Ellinghaus D. Genomewide association study of severe covid-19 with respiratory failure. N Engl J Med. 2020;383(16):1522–1534. - PMC - PubMed

LinkOut - more resources