. 2021 Apr 8;4(3):1175-1187.
doi: 10.1021/acsptsci.1c00048. eCollection 2021 Jun 11.

Functional Selectivity of a Biased Cannabinoid-1 Receptor (CB1R) Antagonist

Affiliations

Functional Selectivity of a Biased Cannabinoid-1 Receptor (CB1R) Antagonist

Ziyi Liu et al. ACS Pharmacol Transl Sci. .

Abstract

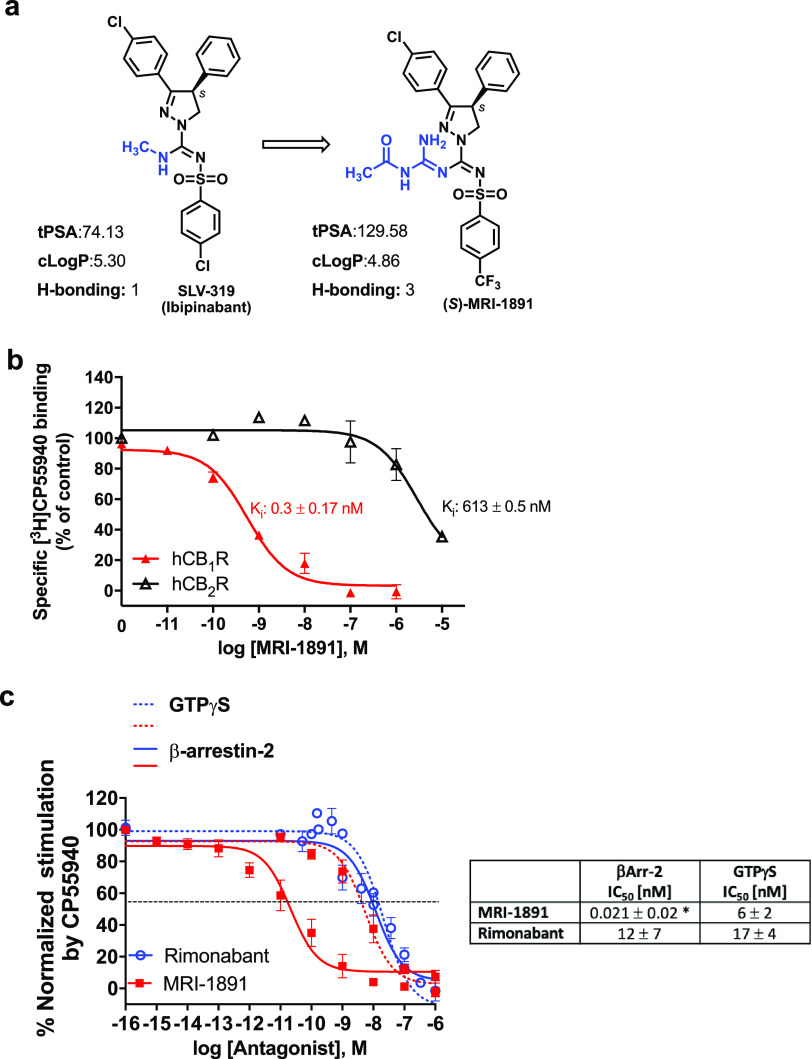
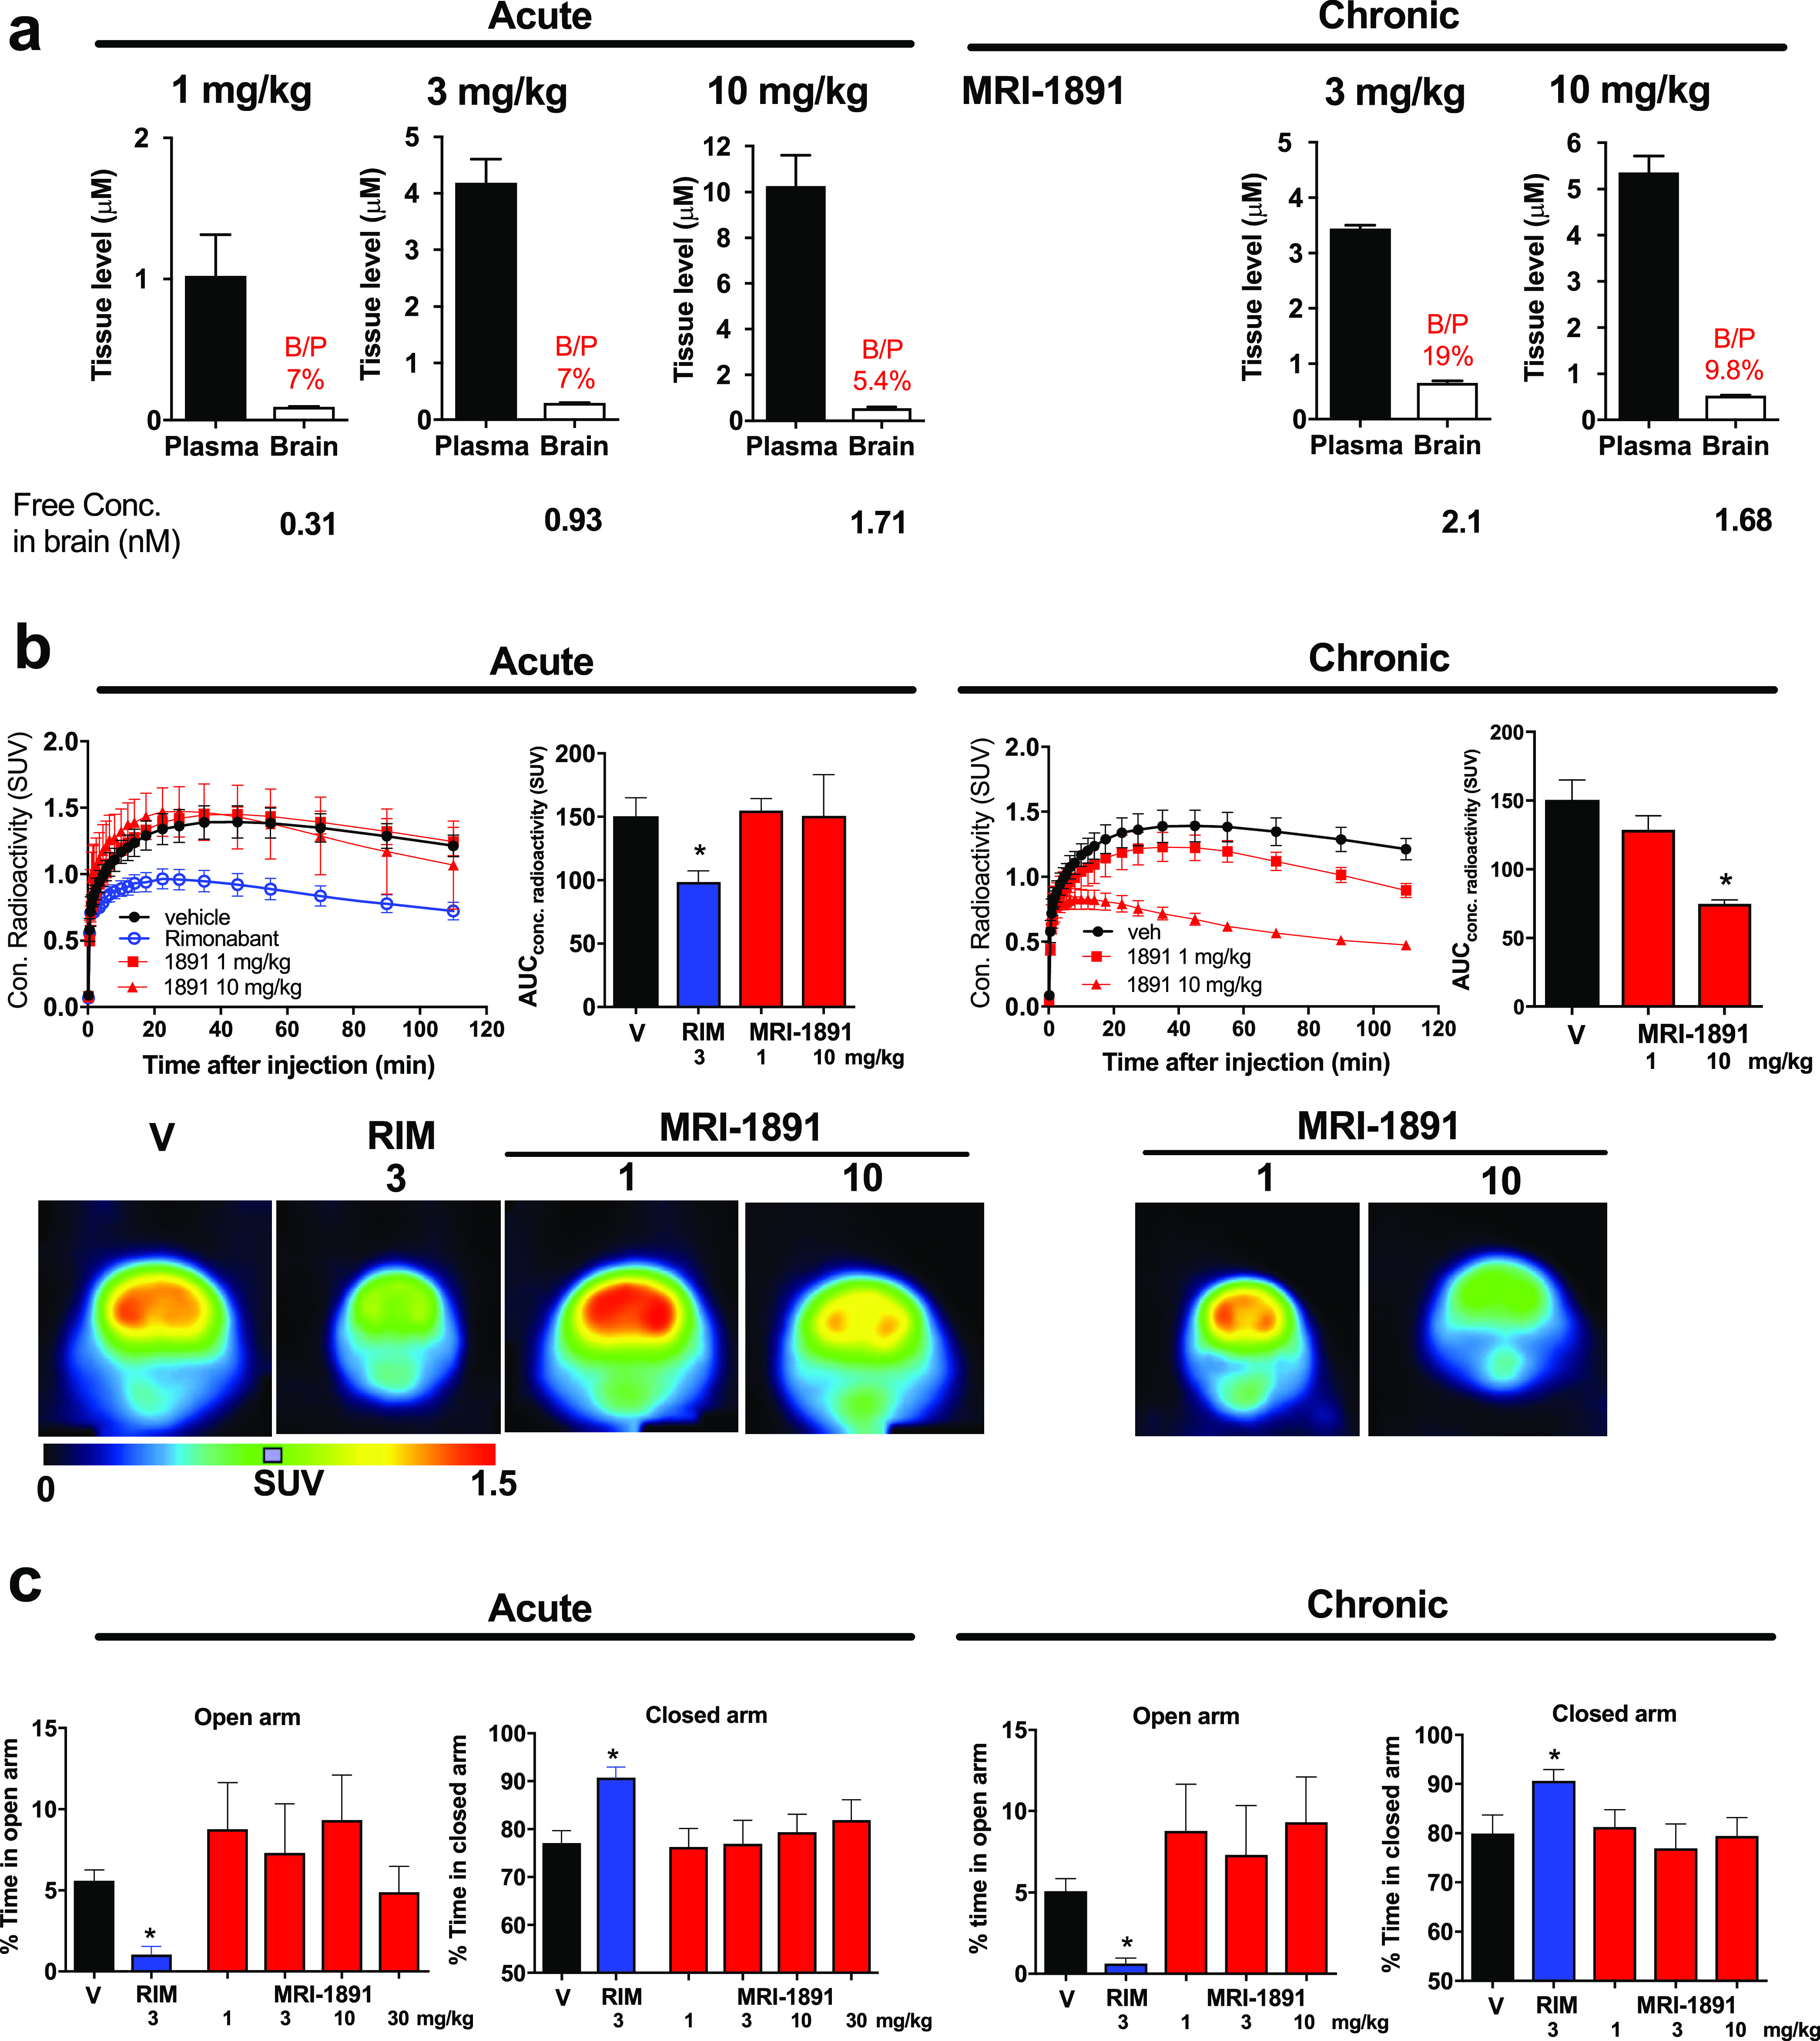
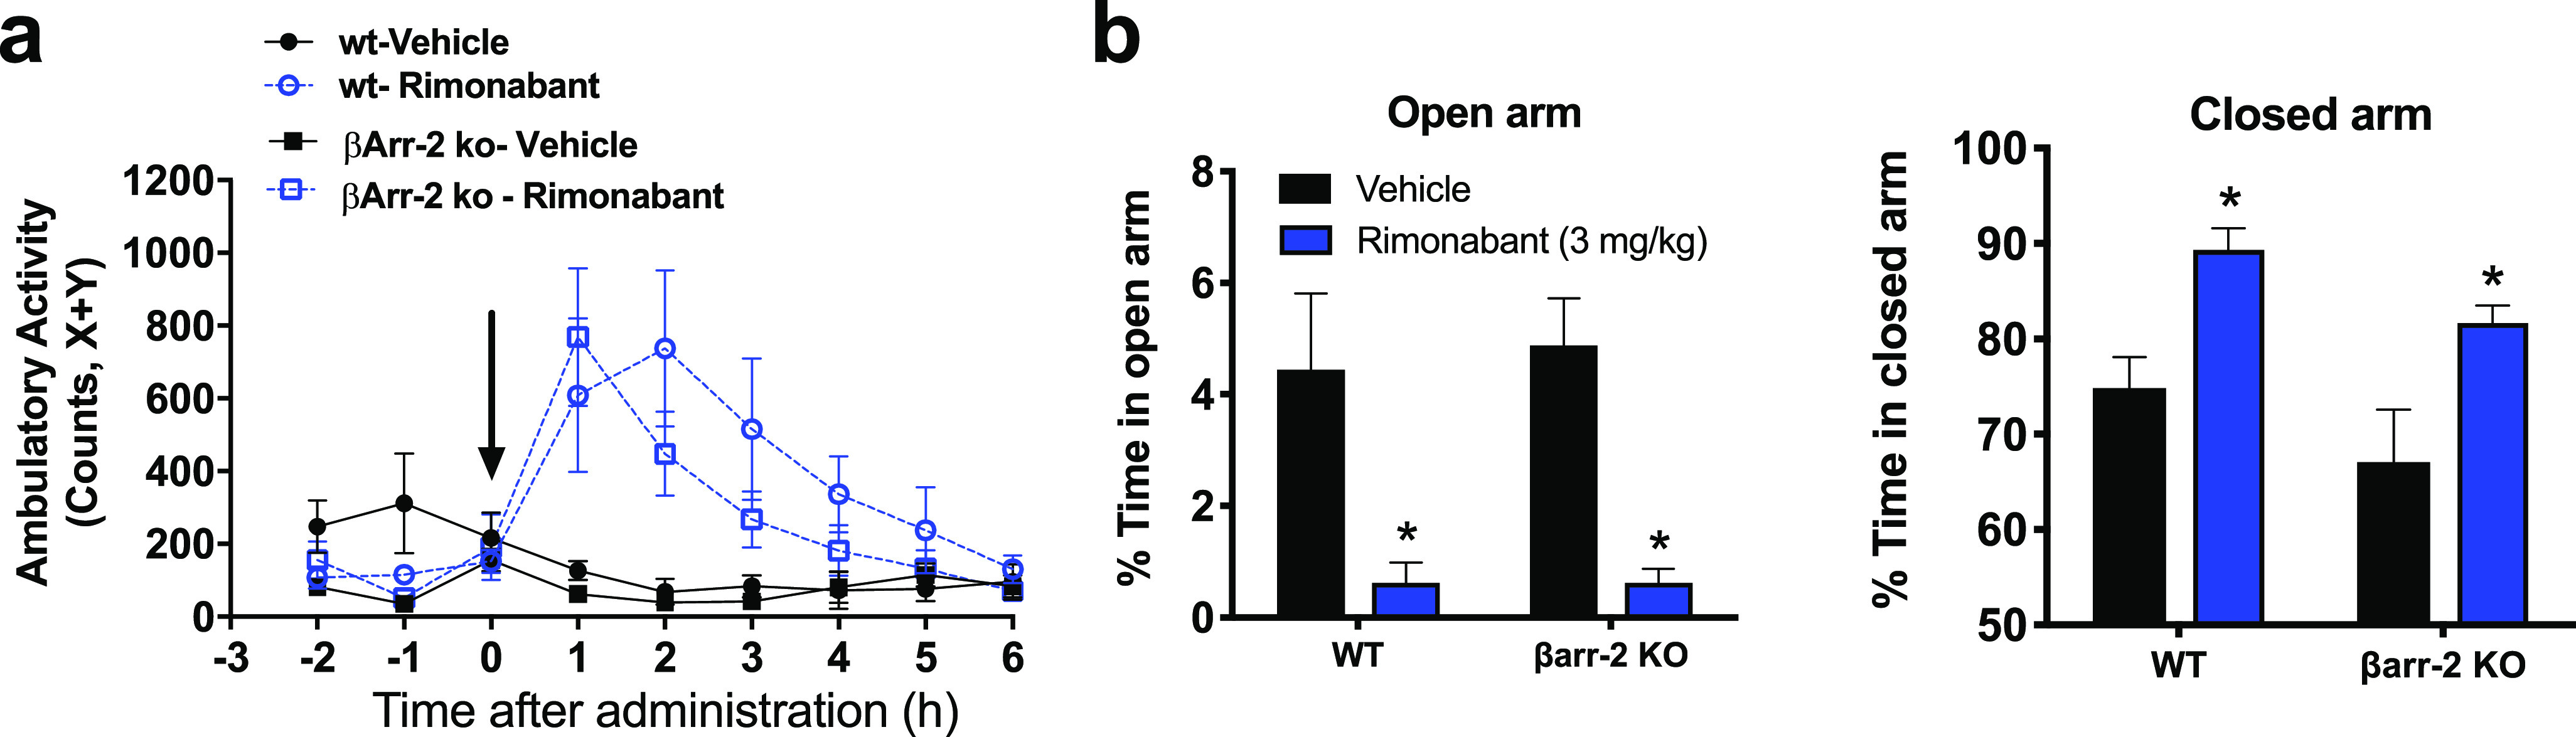
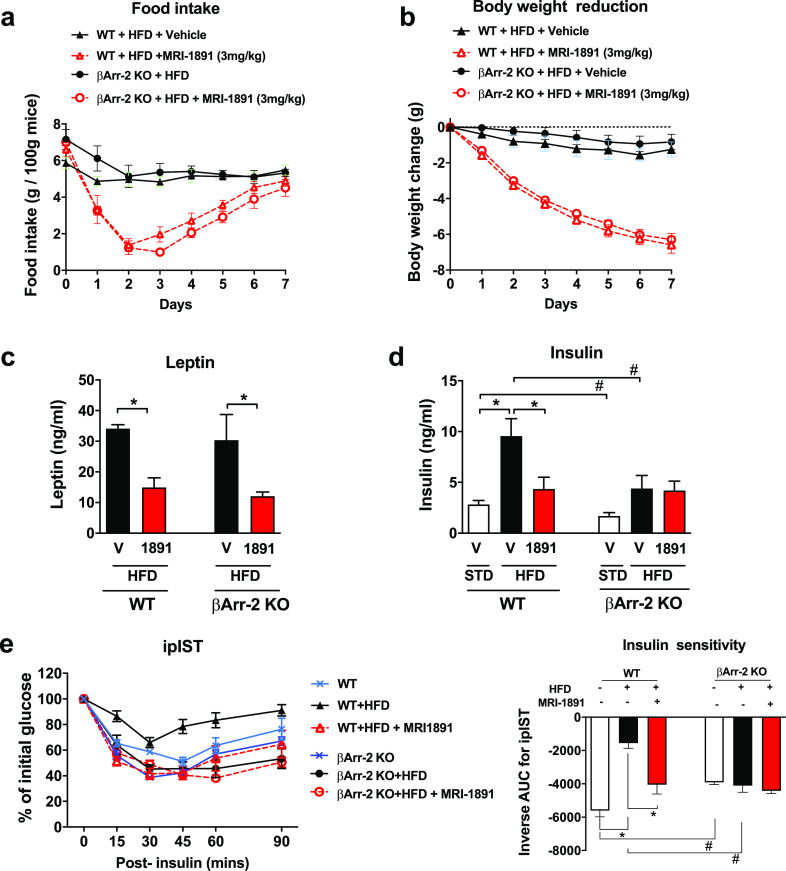
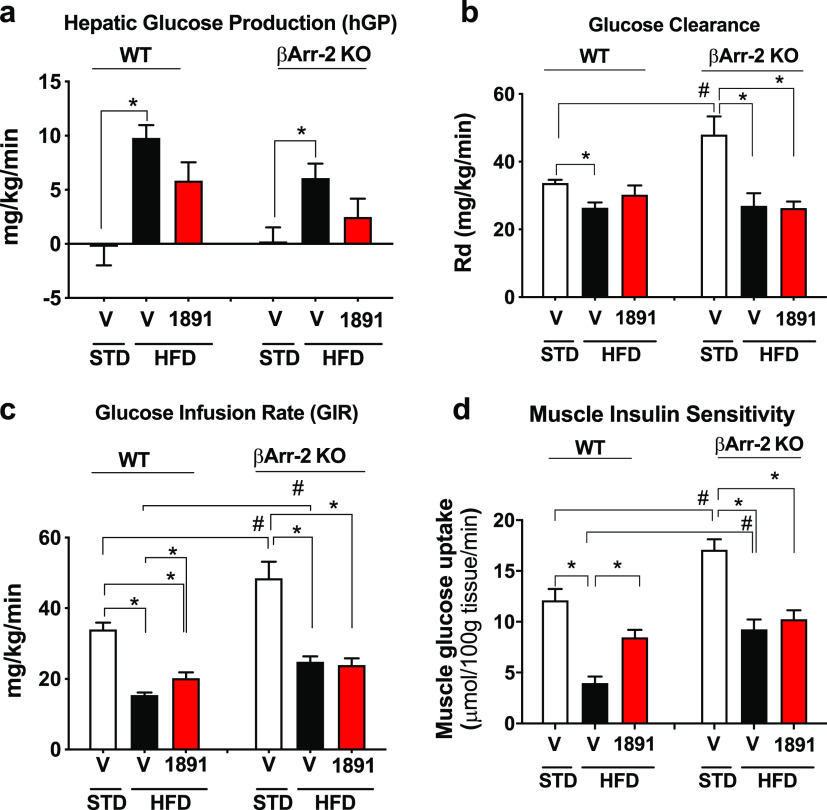
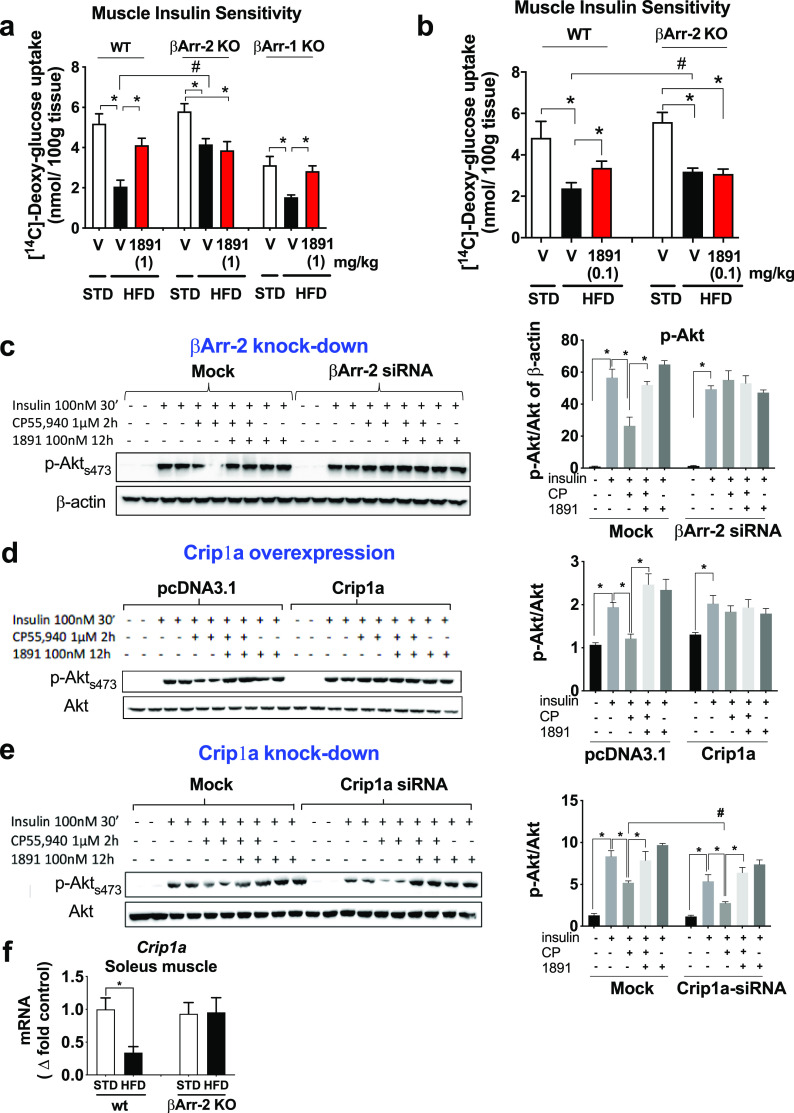
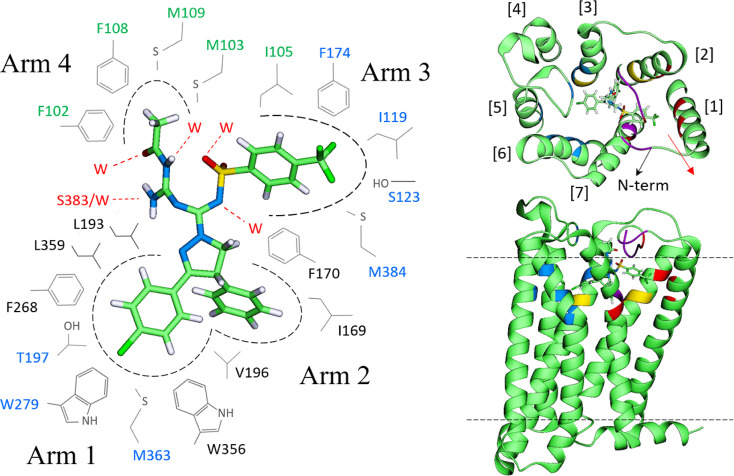
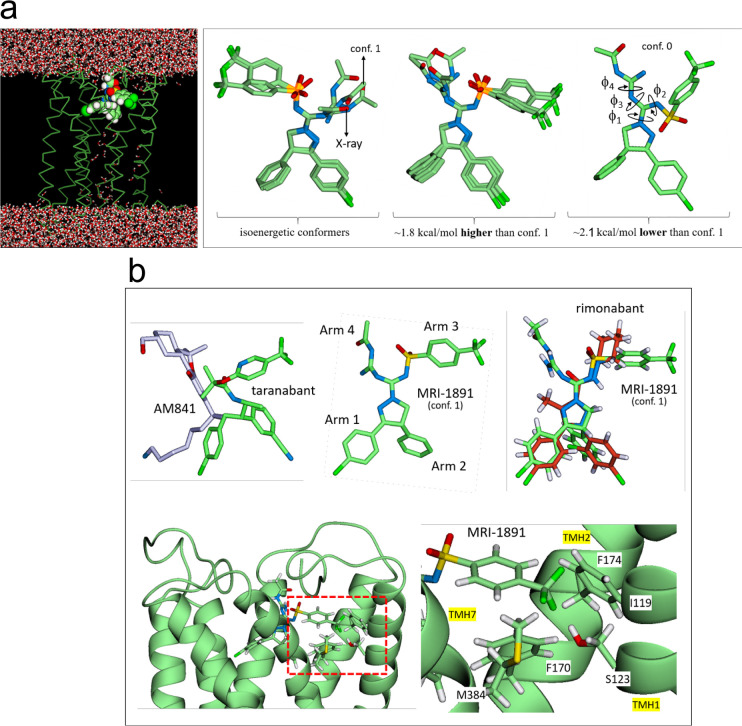
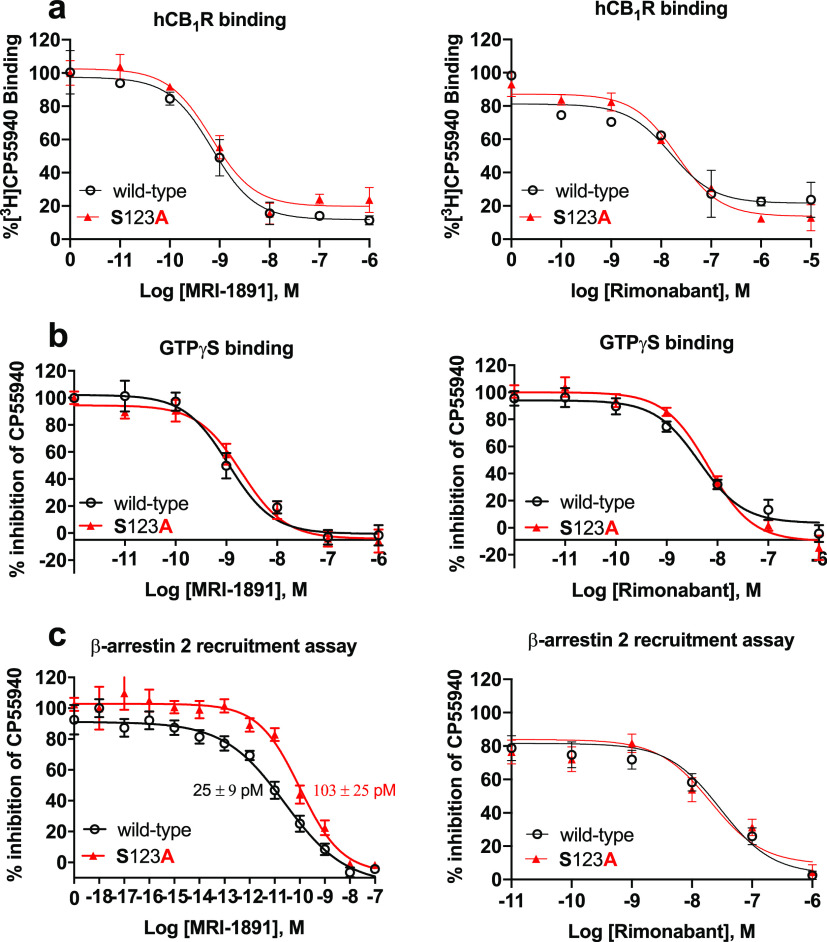
Seven-transmembrane receptors signal via G-protein- and β-arrestin-dependent pathways. We describe a peripheral CB1R antagonist (MRI-1891) highly biased toward inhibiting CB1R-induced β-arrestin-2 (βArr2) recruitment over G-protein activation. In obese wild-type and βArr2-knockout (KO) mice, MRI-1891 treatment reduces food intake and body weight without eliciting anxiety even at a high dose causing partial brain CB1R occupancy. By contrast, the unbiased global CB1R antagonist rimonabant elicits anxiety in both strains, indicating no βArr2 involvement. Interestingly, obesity-induced muscle insulin resistance is improved by MRI-1891 in wild-type but not in βArr2-KO mice. In C2C12 myoblasts, CB1R activation suppresses insulin-induced akt-2 phosphorylation, preventable by MRI-1891, βArr2 knockdown or overexpression of CB1R-interacting protein. MRI-1891, but not rimonabant, interacts with nonpolar residues on the N-terminal loop, including F108, and on transmembrane helix-1, including S123, a combination that facilitates βArr2 bias. Thus, CB1R promotes muscle insulin resistance via βArr2 signaling, selectively mitigated by a biased CB1R antagonist at reduced risk of central nervous system (CNS) side effects.


Conflict of interest statement

The authors declare the following competing financial interest(s): G.K., R.C., and M.R.I. are listed as co-inventors on two US Government patents covering (S)-MRI-1891. The remaining authors declare no competing interests.

Figures

Figure 1
Figure 1
(a) Chemical structure and physicochemical properties of (S)-MRI-1891 and its brain-penetrant parent compound SLV-319 (ibipinabant); (b) binding affinity of (S)-MRI-1891 to human CB1R and CB2R as determined by displacement of a radiolabeled cannabinoid agonist and crude membrane preparations from CHO-K1 cells stably transfected with hCB1R or hCB2R, as described in the Supporting Information, n = 3. (c) Inhibition of CB1R-agonist-induced GTPγS binding (dotted lines) and β-arrestin-2 recruitment (solid lines) by (S)-MRI-1891 (red) or rimonabant (blue), using hCB1R-CHO-K1 cell membrane (PerkinElmer, ES-110-M400UA) and PathHunter eXpress CNR1 CHO-K1 β-arrestin-2 assay, 93–0959E2CP0M, as described in the Supporting Information. Values represent mean ± SEM from 3–6 independent experiments. *, significant difference (P < 0.05) from IC50 values for inhibiting hCB1R-GTPγS signaling, as determined by t-test.
Figure 2
Figure 2
(a) Brain penetrance of (S)-MRI-1891 upon a single (acute) dose or 28 days of chronic oral dosing in lean control male C57Bl/6J mice. Drug levels in plasma and buffer-perfused brain were measured by LC/MS/MS 1 h after the last dose (plasma Cmax). Free concentration in brain was determined by equilibrium dialysis using crude membranes from the brain of CB1R-knockout (KO) mice as described and corresponded to 0.3% of total brain levels measured. (b) In vivo binding of (S)-MRI-1891 or rimonabant to mouse brain CB1R as assessed by displacement of a positron emission tomography (PET) radiotracer administered 1 h after acute dosing or 28 days of chronic oral administration of the CB1R antagonist, as described in the Supporting Information and in ref (7). Values represent mean ± SEM from 3 to 6 independent experiments. Scans from representative experiments are shown in the bottom. (c) Anxiogenic behavior induced by rimonabant, but not (S)-MRI-1891, as determined by the elevated plus maze test (see the Supporting Information). Columns and vertical bars represent mean ± SEM of 4–6 independent experiments.
Figure 3
Figure 3
Behavioral effects of rimonabant mediated by brain CB1R are similar in wild-type and βArr2-KO mice. (a) Hyperambulatory activity induced by 3 mg/kg rimonabant in drug-naïve mice, as quantified by beam disruption in an xy box; (b) anxiogenic effect of rimonabant as tested in the elevated plus maze. Points or columns and vertical bars represent mean ± SEM from 4–6 experiments; *, significant difference (P < 0.05) from corresponding vehicle-treated group, as determined by 2-way ANOVA followed by Dunnett’s multiple comparisons test.
Figure 4
Figure 4
Effects of (S)-MRI-1891 treatment on food intake (a), body weight (b), plasma leptin (c), nonfasting plasma insulin (d), and insulin sensitivity (e) of male wild-type and βArr2-KO mice with high-fat diet induced obesity. Body weight at the start of treatment was 45.6 ± 0.4 g. Points or columns and vertical lines represent mean ± SEM from 8–10 animals. Intraperitoneal insulin sensitivity test (ipIST) was conducted as described in the Supporting Information. *, significant difference (P < 0.05) within the indicated groups, as determined by 2-way ANOVA followed by Dunnett’s multiple comparisons test. #, significant difference (P < 0.05) between wild-type and βArr-2 KO groups, as determined by 2-way ANOVA followed by Sidaks’s multiple comparisons test.
Figure 5
Figure 5
Glycemic control of lean control mice and mice with high-fat diet induced obesity treated with vehicle or (S)-MRI-1891, as analyzed by hyperinsulinemic/euglycemic insulin clamps and described in the Supporting Information. Hepatic glucose production (a), glucose clearance or Rd (b), glucose infusion rate (c), and 2-deoxyglucose uptake into soleus muscle (d) were analyzed from data obtained from the clamp, as described in the Supporting Information. *, significant difference (P < 0.05) within the indicated groups, as determined by 2-way ANOVA followed by Dunnett’s multiple comparisons test. #, significant difference (P < 0.05) between wild-type and βArr-2 KO groups, as determined by 2-way ANOVA followed by Sidaks’s multiple comparisons test. Columns and vertical bars indicate mean ± SEM from 6–8 animals. For an explanation, see the text.
Figure 6
Figure 6
Analyses of the role of βArr2 in CB1R-induced, obesity-related muscle insulin resistance. (a) 2-Deoxyglucose was infused into anesthetized wild-type, βArr2-KO or βArr1-KO mice and its uptake measured in soleus muscle from lean mice or mice with diet-induced obesity 1 h following treatment with a single oral dose of 1 mg/kg (S)-MRI-1891 or vehicle. (b) 2-Deoxyglucose uptake measured as in panel (a), except that treatment with (S)-MRI-1891 was for 7 days at 0.1 mg/kg/day. (c) Insulin-induced Akt phosphorylation and its CB1R-mediated inhibition were analyzed in mock-transfected and βArr2-siRNA-transfected C2C12 myotubes. Each treatment was tested in duplicate aliquots of cells, analyzed by Western blot using β-actin as loading control, and quantified by densitometry. The level of βArr2 knockdown is illustrated by the bar graph on the right. Note that the inhibition of insulin-induced akt-phosphorylation by the CB1R agonist is inhibited by MRI-1891 and is absent in cells with βArr2 knockdown. (d) CB1R-mediated inhibition of insulin-induced Akt phosphorylation is absent in C2C12 myotubes with Crip1a overexpression and (e) is enhanced in myotubes with Crip1a knockdown. (f) High-fat diet-induced obesity results in downregulation of Crip1a expression in soleus muscle from wild-type but not from βArr2-KO mice. *, significant difference (P < 0.05) within the indicated groups, as determined by 2-way ANOVA followed by Dunnett’s multiple comparisons test. #, significant difference (P < 0.05) between the groups, as determined by 2-way ANOVA followed by Sidaks’s multiple comparisons test. Columns and vertical bars represent mean ± SEM from 8–10 animals.
Figure 7
Figure 7
Left: persistent, statistically significant MRI-1891/CB1R interactions in the most favorable binding mode (conf. 1; cf. Figure 8 and in the Supporting Information). Residues in blue indicate electrostatic interactions (through nonpolar H) with Cl or F of MRI-1891; in green, N-terminal residues engaged in hydrophobic interactions. black residues with hydrophobic or nonpolar interactions; those in red indicate hydrogen bond interactions (W denotes water). MRI-1891 atoms: O (red), N (blue), C (light green), S (yellow), Cl and F (dark green), and H (white). Right: location of the CB1R residues interacting with MRI-1891 in the context of the receptor (extracellular and side views); numbers in brackets indicate the TMHs. Most persistent interactions with Arm 1 are colored blue (mainly TMHs 3, 5, and 6), with Arm 2 in yellow (TMHs 2 and 3), with Arm 3 in red (TMHs 1–3), and with Arm 4 in purple (mainly the N-terminal loop). The interactions of CF3 of Arm 3 with TMH1 and CH3 of Arm 4 with the N-term affect the movement of TMH1 (red arrow).
Figure 8
Figure 8
(a) Left: general side view of the MRI-1891 binding mode (conf. 1; cf. Figure 7 and the Supporting Information) showing the positions of the four arms in the receptor. Right: all the conformers of MRI-1891 considered in this study; only conf. 1 in the binding mode of Figure 7 showed optimal and persistent interactions with the receptor throughout the simulations and is consistent with all the mutation studies. (b) Top: overlay of agonist AM841 and antagonist taranabant (left), as they appear in their relative positions in the crystal structures (5XR8 and 5U09, respectively); comparison with the structure of MRI-1891 (middle); the overlay of MRI-1891 (green) onto rimonabant (red) was done using the heavy atoms of the five-member ring as a common docking point (right). Each arm plays a distinct role and interacts with a different region of the receptor. MRI-1891 combines in a single scaffold the arms distribution of agonists and antagonists, a property that may be essential to impart biased property in general. Bottom: detail of the S123 (TMH1) position relative to the trifluoromethyl group of MRI-1891 and four nearby nonpolar residues on adjacent TMHs (snapshot of the simulation; I119 omitted for clarity).
Figure 9
Figure 9
S123A mutation of hCB1R results in a selective decrease in the inhibitory potency of MRI-1891 against CB1R-agonist-induced βArr2 recruitment (c) but not G protein activation (b), without causing a similar change in the effects of rimonabant (right panels) or affecting the binding affinity of either compound (a). GTPγS binding and βArr2 recruitment in CHO cells stably transfected with wild-type and S123A mutant hCB1R were conducted using human CB1 receptor cDNA (hCNR1, NM_016083) in the pCI vector (Promega) for GTPγS and radioligand binding assays, and in the pCMV-hCNR1-PK vector (Eurofins/DiscoverX) for β-arrestin-2 recruitment assays via the PathHunter system as described in the Supporting Information. Points and vertical bars represent mean ± SEM from 8 independent experiments. Numbers indicate Kd values calculated using computerized curve fitting and the Cheng–Prusoff equation.

References

    1. Pacher P.; Batkai S.; Kunos G. (2006) The endocannabinoid system as an emerging target of pharmacotherapy. Pharmacol. Rev. 58 (3), 389–462. 10.1124/pr.58.3.2. - DOI - PMC - PubMed
    1. Silvestri C.; Di Marzo V. (2013) The endocannabinoid system in energy homeostasis and the etiopathology of metabolic disorders. Cell Metab. 17 (4), 475–490. 10.1016/j.cmet.2013.03.001. - DOI - PubMed
    1. Van Gaal L. F.; Rissanen A. M.; Scheen A. J.; Ziegler O.; Rossner S. (2005) Effects of the cannabinoid-1 receptor blocker rimonabant on weight reduction and cardiovascular risk factors in overweight patients: 1-year experience from the RIO-Europe study. Lancet 365 (9468), 1389–1397. 10.1016/S0140-6736(05)66374-X. - DOI - PubMed
    1. Despres J. P.; Golay A.; Sjostrom L. (2005) Effects of rimonabant on metabolic risk factors in overweight patients with dyslipidemia. N. Engl. J. Med. 353 (20), 2121–2134. 10.1056/NEJMoa044537. - DOI - PubMed
    1. Le Foll B.; Gorelick D. A.; Goldberg S. R. (2009) The future of endocannabinoid-oriented clinical research after CB1 antagonists. Psychopharmacology (Berl) 205 (1), 171–174. 10.1007/s00213-009-1506-7. - DOI - PMC - PubMed