. 2021 Mar;2(3):284-299.
doi: 10.1038/s43018-020-00167-4. Epub 2021 Jan 21.

Network-based systems pharmacology reveals heterogeneity in LCK and BCL2 signaling and therapeutic sensitivity of T-cell acute lymphoblastic leukemia

Affiliations

Network-based systems pharmacology reveals heterogeneity in LCK and BCL2 signaling and therapeutic sensitivity of T-cell acute lymphoblastic leukemia

Yoshihiro Gocho et al. Nat Cancer. 2021 Mar.

Abstract

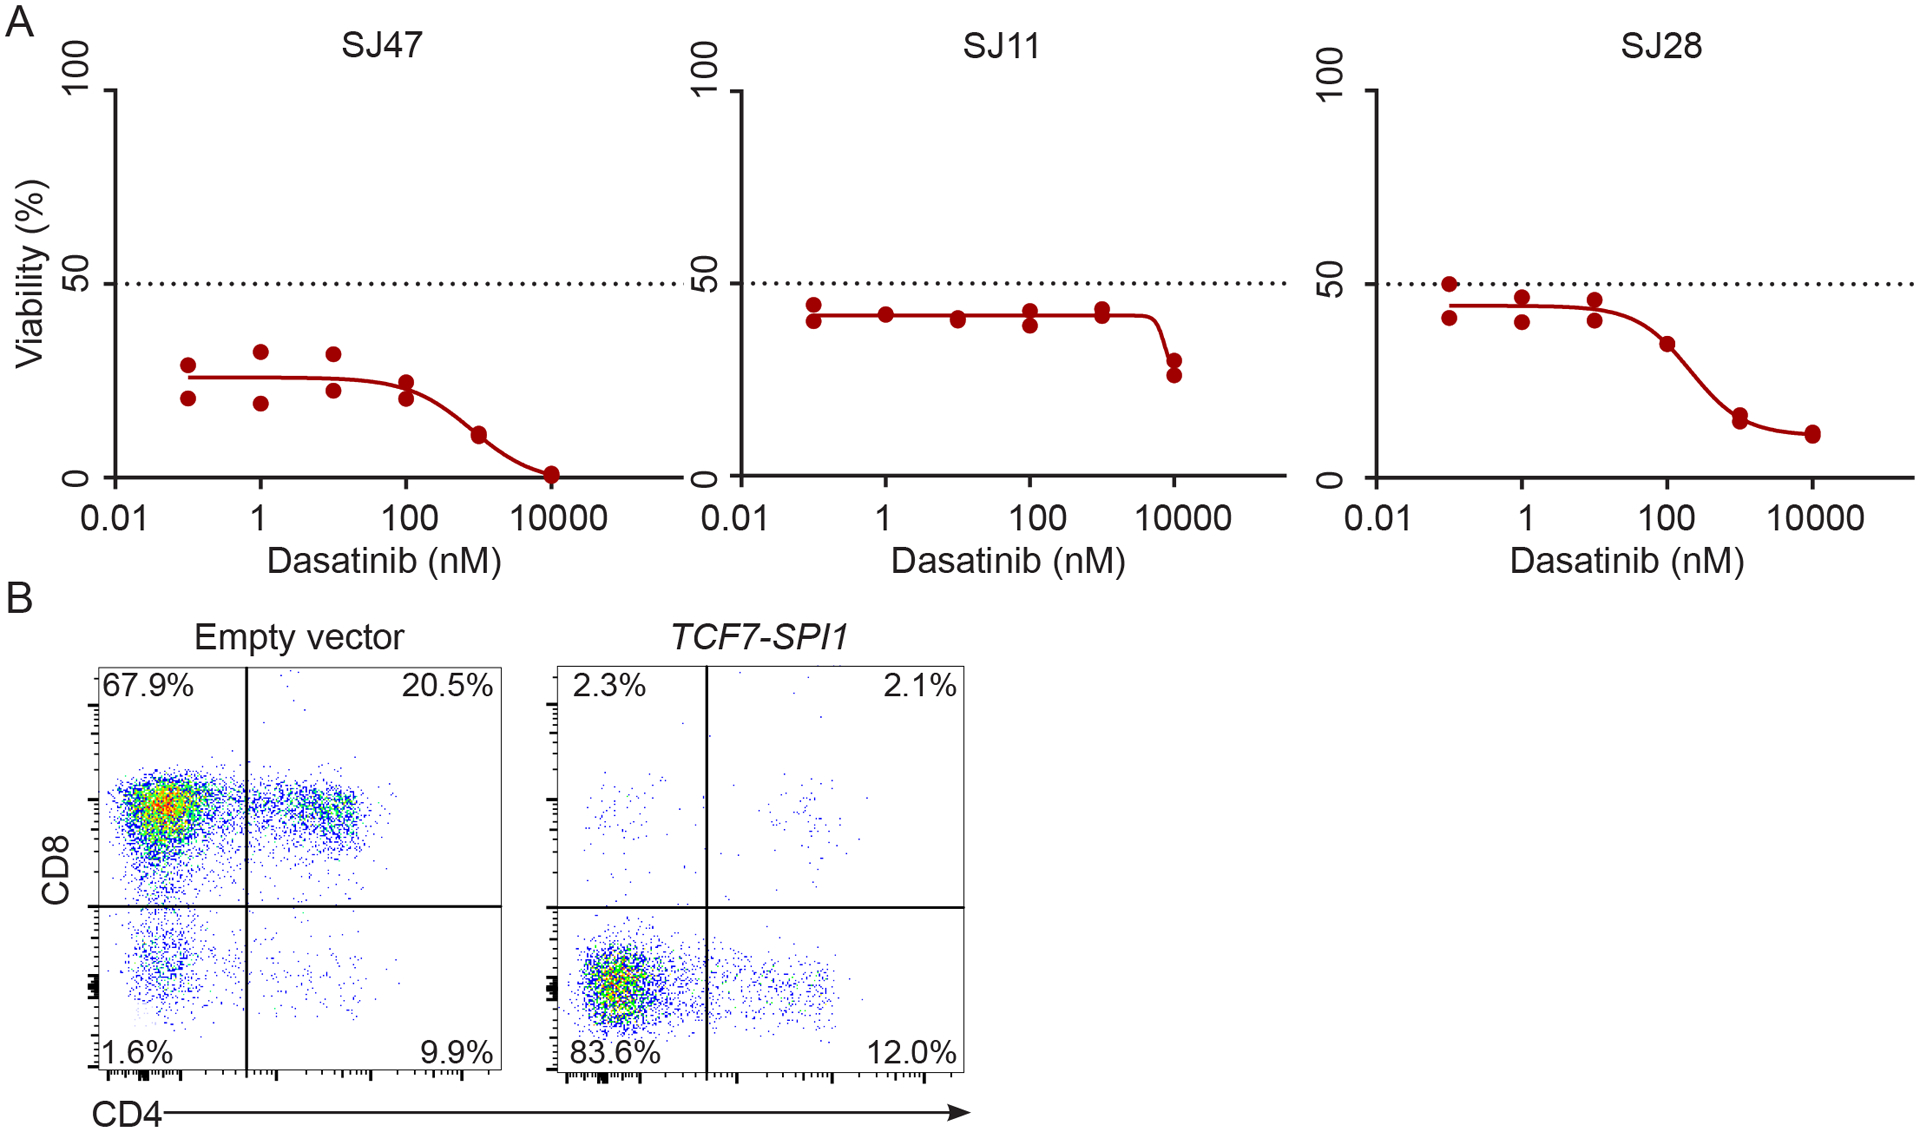
T-cell acute lymphoblastic leukemia (T-ALL) is an aggressive hematological malignancy, and novel therapeutics are much needed. Profiling patient leukemia' drug sensitivities ex vivo, we discovered that 44.4% of childhood and 16.7% of adult T-ALL cases exquisitely respond to dasatinib. Applying network-based systems pharmacology analyses to examine signal circuitry, we identified preTCR-LCK activation as the driver of dasatinib sensitivity, and T-ALL-specific LCK dependency was confirmed in genome-wide CRISPR-Cas9 screens. Dasatinib-sensitive T-ALLs exhibited high BCL-XL and low BCL2 activity and venetoclax resistance. Discordant sensitivity of T-ALL to dasatinib and venetoclax is strongly correlated with T-cell differentiation, particularly with the dynamic shift in LCK vs. BCL2 activation. Finally, single-cell analysis identified leukemia heterogeneity in LCK and BCL2 signaling and T-cell maturation stage, consistent with dasatinib response. In conclusion, our results indicate that developmental arrest in T-ALL drives differential activation of preTCR-LCK and BCL2 signaling in this leukemia, providing unique opportunities for targeted therapy.


Figures

Extended Data Fig. 1
Extended Data Fig. 1. ALL sensitivity to dasatinib and cytotoxic drugs.
A. Dasatinib LC50 distribution of all 352 ALL patient samples (including 307 B-ALL and 45 T-ALL samples). B. Of 86 pediatric B-ALL samples, 17.4% were sensitive to dasatinib, whereas 29.4% of 221 adult B-ALL samples were dasatinib-sensitive. C. Dasatinib LC50 reliably identified BCR-ABL1 B-ALL based on the receiving operating characteristic analysis. Dasatinib LC50 from 307 B-ALL (including 71 BCR-ABL B-ALL) was analyzed, and a LC50 cutoff at 80nM achieved the optimal balance in sensitivity and specificity that distinguishes BCR-ABL samples from other B-ALLs. D. Examples of dose-response curve of dasatinib-sensitive or -resistant B-ALL and T-ALL. Sensitive and resistant cases are shown in red and blue, respectively. The sensitive B-ALL sample is BCR-ABL1-positive. For each patient at each drug concentration, cells were tested in duplicates. E. Of drugs tested for at least 30 cases in the T-ALL cohorts, LC50 of prednisolone and asparaginase exhibited a bimodal distribution whereas 6-MP and daunorubicin did not. N=43, 38, 40, and 41 patients for prednisone, daunorubicin, 6-MP, and L-Asparaginase, respectively.
Extended Data Fig. 2
Extended Data Fig. 2. Comparison of T-ALL sensitivity to four ABL inhibitors.
A-B. PDX-derived leukemia cells were tested for sensitivity to each of the 4 inhibitors. A total of 11 cases were selected to represent dasatinib-sensitive vs resistant T-ALL and were xenografted in NSG mice to develop PDX. Mice were sacrificed once leukemia burden reached predefined endpoint, and human leukemia cells were harvested and subjected to drug sensitivity profiling ex vivo. Cells were incubated with increasing concentrations of each ABL inhibitor for 96 hours and cell viability was determined by flow cytometry as described in Methods. C. Dose-dependent cell death was determined for four ABL inhibitors in 8 T-ALL cell lines. HSB-2 (harbors TCR-LCK fusion), KOPT-K1 (harbors TCR-LMO2 fusion) and ALL-SIL (harbors ABL class fusion) were sensitive (LC50s are less than 0.05 nM) to both dasatinib and ponatinib but resistant to imatinib and nilotinib. For each leukemia case at each drug concentration, cells were tested in duplicates.
Extended Data Fig. 3
Extended Data Fig. 3. NetBID identified LCK and related genes for association with dasatinib sensitivity in T-ALL.
A. Activity of each gene was inferred using NetBID as described in Method and then compared between dasatinib-sensitive vs -resistant T-ALL with P value listed in the far right column. Top panel describes the expression ranking of all genes from the most highly expressed in dasatinib-sensitive cases on the left to the most highly expressed in resistant T-ALL on the right. Each gene in this pathway regulates a multitude of targets and their expression is indicated in two rows with positive-regulated target genes on the top and negatively regulated target genes at the bottom. In the case of LCK, it has 188 positive and 147 negative targets, each represented by a vertical line. Red lines indicate high expression in dasatinib sensitive T-ALL and blue lines indicate high expression in dasatinib-resistant cases. P-value was estimated using two-tailed t test. B. NetBID results for dasatinib target genes for association with dasatinib sensitivity in T-ALL. Dasatinib target gene list is derived from three databases Drug Bank, DGIdb, and chemical proteomic-based TKI target profiling, as shown in the Venn diagram in the left panel. Thirteen targets are commonly identified across three sources. NetBID analysis identified four of these 13 targets with a significantly higher activity (LCK, SRC, FYN and FGR) in dasatinib-sensitive samples compared to resistant cases, with P value for the differential gene activity listed in the right panel. P-value was estimated using two-tailed t test. C. PTCRA and LCK activity were compared between dasatinib-sensitive vs -resistant T-ALL samples with RNA-seq data in the pharmacotyping cohort (N=15 and 30, respectively), P-value was estimated using two-tailed t test. Boxplots show summary of data in terms of the minimum, maximum, sample median, and the first and third quartiles. D-E, Gene networks used to infer PTCRA (D) and LCK (E) activity in NetBID. Each spoke represents a target gene (positively-regulated as red and negatively-regulated as blue), with gene name indicated at the edge of each arrow. P-value was estimated using two-tailed t test. F. Running NetBID analysis using only pediatric cases in the discovery cohort (N=12 and 15 patients for dasatinib-sensitive and -resistant, respectively), we re-estimated Z score for each gene which were then correlated with those from NetBID analysis using all T-ALL cases. Genes in the 30 biomarker panel are labeled and P value was estimated using Pearson correlation test.
Extended Data Fig. 4
Extended Data Fig. 4. LCK signaling is essential for dasatinib sensitivity in T-ALL.
A. Phospho-flow of LCK, ZAP70 and CD247 in dasatinib-sensitive vs -resistant T-ALL cell lines. Cells were treated with increasing concentrations of dasatinib for 1 hour and then subjected to intracellular staining for phosphorylated LCK, ZAP70, and CD247, as described in Method. Phospho-protein was quantified by flow cytometry and normalized with samples not exposed to dasatinib as 100%. HSB-2 and KOPT-K1 (sensitive to dasatinib) is plotted in darker colors while CEM (resistant) is plotted in lighter colors. P-values were derived by ANOVA. B-D. LCK T316M mutation confers dasatinib resistance in KOPT-K1 cells. LCK T316M mutation was ectopically expressed in dasatinib-sensitive T-ALL KOPT-K1 cells. KOPT-K1 cells with wildtype LCK overexpression or empty vector control remained sensitive to dasatinib and ponatinib while overexpression of T316M LCK resulted in resistance to dasatinib (B) and ponatinib (C). Meanwhile, all three lines were resistant to ABL specific inhibitor imatinib (D). For each leukemia sample at each drug concentration, cells were tested in duplicates. E. In KOPT-K1 cells with expressing wildtype LCK or empty vector control, LCK phosphorylation was inhibited by dasatinib in a dose-dependent manner, whereas LCK phosphorylation was unablated by dasatinib in cells expressing the T136M mutant LCK. Standard deviation is derived from biologically independent samples (N=3) and is plotted as error bar. P value was estimated using Wilcoxon test. F-G. Genome-wide CRISPR screen identifies preTCR pathway genes as dependencies in T-ALL. F. LCK, ZAP70 and CD247 dependency score (x-axis) versus gene dependency probability (y-axis) demonstrates that a subset of T-ALL lines (blue, N=3) show dependency on these preTCR pathway genes compared to all other cell lines screened (hematologic cancer cell lines in black, N=73 and other cancer cell lines in gray, N=613). Gene dependency of greater than 0.5 indicates a high probability that a cell line is dependent and corresponds to an approximate dependency score of −0.5. More negative gene dependency scores indicate greater effect on cell line survival. G. Gene dependency score (x-axis) versus gene dependency probability (y-axis) demonstrates that none of the T-ALL lines (blue, N=3) show dependency on SRC kinase family genes (other than LCK show in Fig. 2J) compared to all other cell lines screened (hematologic cancer cell lines in black, N=73 and other cancer cell lines in gray, N=613). Gene dependency of greater than 0.5 indicates a high probability that a cell line is dependent and corresponds to an approximate dependency score of −0.5. More negative gene dependency scores indicate greater effect on cell line survival.
Extended Data Fig. 5
Extended Data Fig. 5. Comparison of T-ALL sensitivity to three LCK inhibitors.
A-B. A total of 11 cases were selected to represent dasatinib-sensitive vs resistant T-ALL (N=7 and 4 in Panels A and B, respectively) and were xenografted in NSG mice to develop PDX. Mice were sacrificed once leukemia burden reached predefined endpoint, and human leukemia cells were harvested and subjected to drug sensitivity profiling ex vivo. Cells were incubated with increasing concentrations of each LCK inhibitor for 96 hours and cell viability was determined by flow cytometry as described in Methods. C. Dose-dependent cell death was determined for two drugs in 8 T-ALL cell lines. For both drugs, HSB-2, (harbors TCR-LCK fusion) and KOPT-K1 (harbors TCR-LMO2 fusion) showed the highest sensitivity compared to ALL-SIL (harbors ABL class fusion) and other T-ALL cell lines. For each leukemia sample at each drug concentration, cells were tested in duplicates.
Extended Data Fig. 6
Extended Data Fig. 6. Biomarker model of dasatinib sensitivity in T-ALL.
A-B. A panel of 30 genes were selected as biomarkers from the top 461 driver genes in the NetBID analysis, as described in Methods. Dasatinib biomarker score was plotted for T-ALL cases, in the discovery cohort (A, N=45) and in the validation cohort (B, N=13). P value was estimated using two-tailed t test. C. Similarly, activity of each biomarker gene was estimated for the TARGET T-ALL cohort, from which an unsupervised clustering analysis was performed, as shown in the heatmap. Each row is a biomarker gene and each column represents a T-ALL case, with color discriminating the level of inferred gene activity. T-ALL subtype is indicated in the top row by color. D-E. Predicted LCK and PTCRA activity in the TARGET T-ALL cohort (N=261) using the biomarker model. Activity of LCK and PTCRA was estimated for each T-ALL case from its RNA-seq data by NetBID algorithm. T-ALL subtypes were defined as previously described (Liu et al., 2017). F. In TARGET cohort, dasatinib biomarker score of cases in LMO2/LYL1 subtype showed a bimodal distribution. Cases with high biomarker score (dasatinib-sensitive, blue curve) exhibited a worse event-free survival compared to those with low biomarker score. P-value was estimated using Cox regression. G-H. Differential gene expression analyses of dasatinib sensitivity in T-ALL. In the discovery cohort, differences in gene expression between dasatinib-sensitive vs -resistant T-ALL was examined using the Limma method based on a linear model and results are presented as the volcano plot compared (G). Pathway analysis was performed with 254 genes that met the significance and effect size threshold (adjusted P<1e-3 and log2 fold change >2), using the KEGG pathway database. P-value was inferred by Fisher exact test. I-J. Comparison of predicted dasatinib sensitivity in pediatric and adult T-ALL. I. Dasatinib biomarker score was significantly higher in pediatric cases than adults in the discovery cohort. This was also validated in an independent microarray-based T-ALL gene expression dataset (NCBI GSE32215) with 37 adult and 191 pediatric patient samples. J.T-ALL subtype was inferred from gene expression profile for cases in the GSE32215 dataset. Pediatric cases have a higher prevalence of the TAL1 and TAL2 subtypes whereas adults have a higher frequency of HOXA and LMO2/LYL1 subtypes. P value was estimated using two-tailed t test. Boxplots show summary of data in terms of the minimum, maximum, sample median, and the first and third quartiles.
Extended Data Fig. 7
Extended Data Fig. 7. SPI1-rearrangement is associated with developmental arrest and related to dasatinib sensitivity in T-ALL.
A. Dose-dependent cell death was determined for dasatinib using the ex vivo drug sensitivity assay as described in Methods. For each patient at each drug concentration, cells were tested in duplicates. B. Mouse Lin-Sca+Ckit+ (LSK) cells were isolated from bone marrow and transduced lentivirally with SPI1 fusion gene or empty vector. After in vitro differentiation in the presence of OP9-DL1 cells and Il7 and Flt3 ligand, LSK cells were subjected to flow-cytometry analysis. TCF7-SPI1 expressing cells exhibited differentiation blockade at DN stage while the empty control cells were able to extensively differentiate to double positive and single positive stages.
Extended Data Fig. 8
Extended Data Fig. 8. Activity of dasatinib sensitivity-related genes across normal T cell developmental stages in mouse and human.
A-B. The activity of dasatinib sensitivity genes vary by T cell differentiation stage in mouse. RNA-based gene expression profile was obtained from the previously published dataset (Mingueneau et al., 2013), and NetBID was used to infer gene activity. A. NetBID-inferred activity of the 30 biomarker genes. Each mouse T cell developmental stage is represented as a column and each row indicates different genes in the biomarker panel. Gene activity is represented by color (low to high as blue to red). B. NetBID-inferred activity of PTCRA and LCK. Horizontal bars indicate the mean of gene activity for each T cell population. DN3–4 stages are highlighted in red. C-E. NetBID-inferred dasatinib biomarker score and activity of PTCRA and LCK in 10 normal human T cell developmental stages. RNA-based gene expression profile of human T cells was obtained from the previously published dataset (Casero et al., 2015). NetBID was used to infer LCK (D) and PTCRA (E) activity and biomarker score (C). Thy3 and Thy4 (approximately equivalent to DN3–4 and DN4 stages in mouse) are highlighted in red.
Extended Data Fig. 9
Extended Data Fig. 9. Relationship of LCK/BXL-XL/BCL2 activities with dasatinib and venetoclax sensitivity.
A. LCK activity was inversely correlated with venetoclax sensitivity in vitro. LCK activity was inferred from RNA-seq data using NetBID in the discovery cohort (P value was estimated using ANOVA). B-D. ETP T-ALL is associated with high BCL2 and low LCK/BCL-XL activity. BCL2/LCK/BCL-XL activity was estimated for cases in the TARGET cohort. Each case was annotated with ETP status. ETP cases exhibit low activity of LCK (B) and BCL-XL (D) while have high BCL2 activity (C). P-value was estimated using ANOVA. Boxplots show summary of data in terms of the minimum, maximum, sample median, and the first and third quartiles. E. NetBID analysis of venetoclax sensitivity in a subset of T-ALL case in the discovery cohort (N=34 patients) identified 656 driver genes for drug response. Genes in the Pre-TCR signaling pathway were most enriched in pathway analysis (downregulation linked to venetoclax sensitivity). F-M. Single cell transcriptomic analysis identified intra-leukemia heterogeneity in LCK activity. T-ALL cells from SJ53 were incubated with dasatinib or vehicle for 4 days in vitro. scRNA-seq was then performed using viable cells from each group separately but transcription profiling data was pooled for subsequent analyses. Vehicle-treated cells mimicked naïve and sensitive to dasatnib whereas cells survived dasatinib exposure (dasatinib-treated) represented drug resistant cell population. F. tSNE visualization shows the distribution of dasatinib-treated (brick red) and naïve (green) cells in SJ65 and SJ53. Single cell RNA-seq and data analyses were described in Methods. G. LCK and BCL-XL activity was inferred by NetBID from single cell RNA-seq of SJ66 and SJ53. P value were calculated using Pearson correlation, and color indicates cell populations (C1, C2, and C3 represented dasatinib resistant [red], responsive [green] and sensitive [blue] groups). P value was estimated using Pearson correlation. H. Left panel, unsupervised clustering analysis of scRNA-seq of vehicle and dasatinib-treated T-ALL cells from SJ53. Each dot represent a single cell visualized in a two-dimensional projection by t-SNE. Three clusters (C1, C2, and C3, in red, green, and blue, respectively) were identified using k-means clustering. Right panel, cell composition of each cluster is visualized by stack plot with red and green indicating the % of cells from vehicle or dasatinib-treated samples. C1, C2, and C3 consisted of increasing proportion of naïve dasatinib-sensitive cells, representing populations with low, intermediate, and high sensitivity to dasatinib, respectively. I. Distribution of Dasatinib biomarker score across three clusters. J. LCK activity was highest in cluster C3, intermediate in C2, and lowest in C1, paralleling the proportion of dasatinib-sensitive population. LCK activity is color-coded (from low to high, blue–red) on t-SNE plot. K. BCL2 activity was lowest in cluster C3, intermediate in C2, and highest in C1, paralleling the proportion of dasatinib-sensitive population. BCL2 activity is color-coded (from low to high, blue–red) on t-SNE plot. L. Inverse correlation of LCK and BCL2 activity at the single cell level in SJ53. Each dot represents a cell and color discriminate clusters C1, C2, and C3 (red, green, and blue, respectively). Correlation coefficient and P value were estimated using Pearson correlation. M. Differentiation stage of each population was projected by examining the gene expression signature characteristic of ETP or DN3/DN4 T cells. Signature was derived from differential expression analysis of mouse T cell expression dataset (Mingueneau et al., 2013). Heatmap indicates the average of each gene (rows) for cells within each cluster (columns), after Z-normalization.
Extended Data Fig. 10
Extended Data Fig. 10. Schematic summary of main analyses, experiments, and major findings of this study.
Text is highlighted in red to indicate those unique to this report and advances compared to previous findings.
Figure 1.
Figure 1.. Ex vivo pharmacotyping identified dasatinib-sensitive T-ALL.
A and B, dasatinib LC50 distribution in BCR-ABL1 B-ALL or those with ABL class fusions (N=71) and T-ALL (N=45). C. The proportion of dasatinib-sensitive T-ALL (marked in red) is significantly higher in children (44.4%) than in adults (16.7%). D. Comparison of dasatinib sensitivity with that to three other ABL inhibitors: imatinib (N=18), nilotinib (N=8) and ponatinib (N=10). LC50 correlation between each pair was evaluated using Spearman test. E. Circos plot of targets of four ABL inhibitors. TKIs (left) are connected to their purported targets (right), based on drug-target relationships previously described using systematic chemical proteomic profiling (Klaeger et al., 2017). The right half of the circle highlights the shared targets across these four inhibitors. For all the above panels, N represents the number of patients.
Figure 2.
Figure 2.. In vivo efficacy of dasatinib therapy in T-ALL.
A-B. Dose-response curves of dasatinib (A) and ponatinib (B) in T-ALL PDX cells used for in vivo efficacy studies. Leukemia cells were incubated with increasing concentration of drugs for 96 hours in the stromal cell co-culture system and cell viability was quantified using flow cytometry, as described in Methods. For each paitent sample at each drug concentration, cells were tested in duplicate. C. Leukemia burden in peripheral blood as a function of time in each T-ALL PDX models treated with dasatinib or vehicle. Dasatinib was given at 10mg/kg/day for 98 days until endpoint is met (e.g., leukemia burden reaches 80% or moribund for other reasons). In vivo efficacy of dasatinib treatment in PDX mouse model. P value was estimated using ANOVA test. Each curve represents an indidual mouse. D leukemia-free survival estimated for each T-ALL PDX model. The dasatinib treatment arm is shown in red curves and the vehicle treatment arm is shown in blue curves. P value was estimated using Cox regression model. Each treatment arm included 8 mice for cases 1, 2, and 3, and 6 mice per arm for case 4.
Figure 3.
Figure 3.. preTCR-LCK activation drives dasatinib sensitivity in T-ALL.
A Schema of the NetBID analysis for identifying drug sensitivity driver. By applying the SJARACNe algorithm to the published TARGET T-ALL RNA-seq dataset (N=261 patients), we first constructed a T-ALL interactome to describe signaling network in this leukemia. Then we perform network-based inference of gene activity (NetBID) using RNA-seq data of dasatinib-sensitive vs -resistant T-ALL (N=15 and 30 patients, respectively). Comparing gene activity between two groups, we identify drivers/master regulators of drug response. B. Pathway analysis of driver genes associated with dasatinib sensitivity. A total of 461 drug sensitivity driver genes were identified by using NetBID. Fisher exact test was used to assess the over-representation of each gene set in KEGG database in the drug sensitivity driver genes. C-D. Associations of preTCR pathway genes (C) and dasatinib target genes (D) with dasatinib sensitivity in T-ALL. Genes are shown as dots in networks based on their relationships defined by the T-ALL interactome, using SJARACNe. Driver genes up- and down-regulated in dasatinib-sensitive cases were marked as red and blue, respectively. Dot size corresponds to the P-value comparing gene activity in dasatinib-sensitive vs. -resistant cases. E. Phosphorylation level of LCK, ZAP70 and CD247 in fresh T-ALL PDX cells treated with various concentrations of dasatinib. Leukemia cells were incubated with dasatinib for 1 hour and phosphorylation was quantified by flow cytometry after intracellular staining with antibodies specific to each phospho-protein. Y-axis shows relative phospho-level of each molecule, with no drug as 100%; and x-axis indicates dasatinib concentration. Sensitive samples (N=7 independent PDX models) were plotted in dark colors while resistant samples (N=4 independent PDX models) were labeled in light colors. P value was estimated using Wilcoxon rank test. F. Phospho-proteomic profiling of dasatinib-sensitive vs resistant T-ALL (N=3 and 2 independent T-ALL PDX cases, represented by the left and right panels, respectively). T-ALL PDX cells were treated with dasatinib (10 nM for 1 hour) and subjected to TMT-based phospho-proteomics. Kinase activity was estimated on the basis of phosphorylation of known substrates (see Methods) and compared between baseline and after-dasatinib treatment. In the Volcano plots, each dot represents a unique kinase and the degree to which its activity is affected by dasatinib is indicated by Log2 transformed fold change (dasatinib treated versus baseline, x-axis) and–log10 transformed P-value (estimated using two-sided t test) (y-axis). Kinases with significant changes by dasatinib treatment are highlighted in blue and their sizes represent the number of known substrate phosphorylation sites. G. Correlation of dasatinib LC50 with that of LCK-specific inhibitors nintedanib and WH 4–023 (green and red, respectively) in T-ALL PDX cells (N=11 cases). P values were estimated using Pearson correlation test. H-I. Genome-scale CRISPR-Cas9 screening of T-ALL cell lines (N=3 unique cell lines) compared to all other cancer cell lines (N=686 cell lines) (H) or other hematologic malignancy cell lines (N=73 cell lines) (I). Each point represents one gene in the screen. The effect size on the x-axis represents the mean difference in dependency score between the T-ALL lines compared to other cell lines screened with negative effect size indicating greater dependency in T-ALL compared to other cell lines. The y-axis represents the statistical significance of enrichment calculated as -log10(q-value) from a two-sided t-test with Benjamini Hochberg correction. Standard deviation is plotted as error bar.
Figure 4.
Figure 4.. Biomarker model predicts dasatinib sensitivity across T-ALL subtypes.
A. Heatmap of NetBID-inferred activity of 30 drug sensitivity driver genes in the dasatinib pharmacotyping cohort as discovery (N=45 patients) and in the validation set (N=13 patients). To identify this panel, the 461 drivers associated with ex vivo dasatinib response were filtered against the preTCR pathway genes and known dasatinib targets. The top 15 rows show genes associated with dasatinib sensitivity while the bottom 15 rows represent genes driving dasatinib resistance. B-C. receiver operating characteristic curve analysis of the dasatinib biomarker score performance in the discovery and validation cohorts, respectively. D. Predicted dasatinib sensitivity in the TARGET T-ALL cohort (N=261) using the biomarker model. A biomarker score was estimated for each T-ALL case from its RNA-seq data and NetBID-inferred gene activity. T-ALL subtypes were defined as previously described (Liu et al., 2017). E. Survival analysis of T-ALL cases predicted as dasatinib-sensitive vs -resistant in the TARGET cohort (dasatinib biomarker score > or ≤ 0.6), indicating disparate treatment outcome of conventional chemotherapy. P value was estimated using Cox regression with the biomarker score as a continuous variable. F. White blood cell count at diagnosis was compared between T-ALL cases with predicted dasatinib sensitivity vs resistance in the TARGET cohort. P value was estimated using Wilcoxon rank test. Boxplots show summary of data in terms of the minimum, maximum, sample median, and the first and third quartiles.
Figure 5.
Figure 5.. Somatic genomic abnormalities in dasatinib-sensitive T-ALL.
A. Oncoplot summarizes somatic genomic abnormalities in the T-ALL pharmacotyping cohort. Each column represents one sample and its dasatinib sensitivity is listed in the top row. Cases with SPI1-rearrangement are marked as red in the “Fusion” row. The type of genomic profiling (whole exome seq and/or RNA-seq) is indicated in the second row. Genomic data analyses (fusion gene and sequence mutation calling) were performed as described in Methods. B. NOTCH1 mutations were more common in dasatinib-sensitive T-ALL compared to cases resistant to this drug (shown in the top and bottom panel, respectively). Mutation calling was performed using pipeline described previously and in Methods, from paired whole exome-seq, whole genome-seq, and/or leukemia RNA-seq.
Figure 6.
Figure 6.. Association of T cell differentiation arrest with dasatinib sensitivity in T-ALL.
A. Inferred dasatinib sensitivity biomarker score for 19 mouse T-cell populations representing different developmental stages (N=3 mice for each stage). Published RNA expression profile (Mingueneau et al., 2013) was used as input of NetBID to infer gene activities from which dasatinib biomarker score was calculated. Dasatinib biomarker score approached the maximal level starting at DN3a-DN3b-DN4 stage (highlighted in red). Horizontal bars indicate the mean biomarker score for each T cell population. B. Differentiation stage of dasatinib-sensitive vs -resistant T-ALL. NetBID-based gene activity profiles of human T-ALL and mouse T cells from differentiation stages (Mingueneau et al., 2013) were pooled after mapping to the same set of genes using BioMart. 465 genes had a coefficient of variation >0.5 and were included in clustering analysis using tSNE. Shaded circles represent three distinctive clusters inferred using the k-means method. Circle and triangle indicate T-ALL and normal T cell populations, respectively . C. Developmental arrest at DN3 stage of mouse hematopoietic stem and progenitor cells by ectopic expression of TCF7-SPI1. Mouse Lin-Sca+Ckit+ (LSK) cells were isolated from bone marrow and transduced lentivirally with SPI1 fusion gene or empty vector, followed by in vitro differentiation in the presence of OP9-DL1 cells, with Il7 and Flt3 ligand. The upper panels show CD25 and CD44 expression pattern in CD4/CD8 double negative population by flow cytometry, to define DN1, 2, 3, and 4 populations as labeled. D. LCK phosphorylation in mouse LSK cells transduced with TCF7-SPI1 expression vector and empty vector. At the end of in vitro differentiation assay (Panel C), mouse cells were subjected to pohopho-flow cytometry using LCK (Y394) antibody. Standard deviation was estimated from N=3 independent transduction and P value was derived from two-sided t test. E. Growth inhibition of mouse DN3 thymocytes by dasatinib in vitro. Primary mouse CD4 and CD8 double-negative thymocytes were isolated from thymus and incubated with dasatinib (100nM) for two days. Viable cell counts were performed by flow-cytometry using DAPI. DN3 T cells show the highest sensitivity to dasatinib. *P<0.05, P values for DN1, 2, 3 and 4 are 0.000388, 0.395572, 0.000043 and 0.000020, respectively. P values were estimated by two-sided t test. Standard deviation is plotted as error bar and is derived from N=3 unique mice. Center value represents mean.
Figure 7.
Figure 7.. Differentiation-dependent activation of BCL2 and BCL-XL and its relation to T-ALL response to dasatinib and venetoclax A-B.
Association of BCL2 (A) or BCL-XL (B) activity with dasatinib sensitivity in T-ALL. Gene activity was inferred by NetBID analyses of the N=45 cases in the T-ALL pharmacotyping cohort and compared between dasatinib-sensitive and -resistant samples with P values estimated using two-sided t-test. C. Dynamic change of BCL2 and BCL-XL activity across normal T-cell differentiation stages (N=3 for each stage and bar represents the mean for each population). Gene activity was estimated from published mouse gene expression dataset (Mingueneau et al., 2013), as described in Figure 6. DN3a/DN3b/DN3b-4 stages are highlighted in red. D. Dasatinib sensitivity was associated with venetoclax resistance in T-ALL. Within N=45 cases in the T-ALL pharmacotyping cohort, N=34 were tested for venetoclax sensitivity ex vivo, Venetoclax LC50 was compared between dasatinib-sensitive vs -resistant T-ALL, with P values estimated using two-sided t-test. In the same cohort, T-ALL sensitivity to venetoclax was associated with high BCL2 and low BCL-XL activity, respective (E and F, N=10, 18, 6 patients in the Resistant, Responsive, and Senstive groups, respectively). P values were estimated using ANOVA. G. Inverse correlation of the effects of gene activity on dasatinib sensitivity vs venetoclax sensitivity in T-ALL. Each dot represents a gene with Z-score plotted on the x and y axis to indicate the association of its activity with dasatinib and venetoclax sensitivity, respectively, as estimated by NetBID in the T-ALL pharmacotyping cohort. Marked in red are example genes up-regulated in dasatinib-sensitive cases but downregulated in venetoclax-sensitive cases. Those marked in green exhibited the opposite pattern of association with drug sensitivity. Correlation of two sets of Z scores was evaluated using Spearman correlation test. H-I. BCL2 and BCL-XL activity across subtypes in TARGET cohort (N=261 patients). Boxplots show summary of data in terms of the minimum, maximum, sample median, and the first and third quartiles.
Figure 8.
Figure 8.. Single cell transcriptomic analysis identified intra-leukemia heterogeneity in LCK and BCL2 signaling, T-cell maturation, and dasatinib response.
T-ALL cells from SJ65 were incubated with dasatinib or vehicle for 4 days in vitro. scRNA-seq was then perfomred using viable cells from each group separately but transcription profiling data was pooled for subsequent analyses. Vehicle-treated cells mimiced naïve and sensitive to dasatnib whereas cells survived dasatinib exposure (dasatinib-treated) represented drug resistant cell population. A. Left panel, unsupervised clustering analysis of scRNA-seq of vehicle and dasatinib-treated T-ALL cells from SJ65. Each dot represent a single cell visualized in a two-dimensional projection by t-SNE. Three clusters (C1, C2, and C3, in red, green, and blue, respectively) were identified using k-means clustering. Right panel, cell composition of each cluster is visualized by stack plot with red and green indicating the % of cells from vehicle or dasatinib-treated samples. C1, C2, and C3 consisted of increasing proportion of naïve dasatinib-sensitive cells, representing populations with low, intermediate, and high sensitivity to dasatinit, respectively. B. Distribution of dasatinib biomarker score across three clusters, with C3 showing the highest predicted sensitivity and greatest proportion of vehicle-treated cells. C. LCK activity was highest in cluster C3, intermediate in C2, and lowest in C1, paralelling the proportion of dasaitnib-sensitive population. LCK activity is color-coded (from low to high, blue–red) on t-SNE plot. D BCL2 activity was lowest in cluster C3, intermediate in C2, and highest in C1, paralelling the proportion of dasaitnib-sensitive population. BCL2 activity is color-coded (from low to high, blue–red) on t-SNE plot. E. Inverse correlation of LCK and BCL2 activity at the single cell level in SJ65. Each dot represent a cell and color discriminate clusters C1, C2, and C3 (red, green, and blue, respectively). Correlation coefficient and P value were estimated using Pearson correlation. F. Differentiation stage of each population was prejected by examining the gene expression signature charateristic of ETP or DN3/DN4 T cells. Signature was derived from differential expression analysis of mouse T cell expression dataset (Mingueneau et al., 2013). Heatmap indicates the average of each gene (rows) for cells within each cluster (columns), after Z-normalization.

Comment in

References

    1. Pui CH et al. Childhood Acute Lymphoblastic Leukemia: Progress Through Collaboration. J Clin Oncol 33, 2938–48 (2015). - PMC - PubMed
    1. Hunger SP & Mullighan CG Acute lymphoblastic leukemia in children. N Engl J Med 373, 1541–52 (2015). - PubMed
    1. Slayton WB et al. Dasatinib Plus Intensive Chemotherapy in Children, Adolescents, and Young Adults With Philadelphia Chromosome-Positive Acute Lymphoblastic Leukemia: Results of Children’s Oncology Group Trial AALL0622. J Clin Oncol 36, 2306–2314 (2018). - PMC - PubMed
    1. Shen S et al. Effect of Dasatinib vs Imatinib in the Treatment of Pediatric Philadelphia Chromosome-Positive Acute Lymphoblastic Leukemia: A Randomized Clinical Trial. JAMA Oncol (2020). - PMC - PubMed
    1. Roberts KG et al. Targetable kinase-activating lesions in Ph-like acute lymphoblastic leukemia. N Engl J Med 371, 1005–15 (2014). - PMC - PubMed

Publication types

MeSH terms