. 2021 Jul 20;2(7):100329.
doi: 10.1016/j.xcrm.2021.100329. Epub 2021 Jun 15.

Serological analysis reveals an imbalanced IgG subclass composition associated with COVID-19 disease severity

Affiliations

Serological analysis reveals an imbalanced IgG subclass composition associated with COVID-19 disease severity

Jennifer L Yates et al. Cell Rep Med. .

Abstract

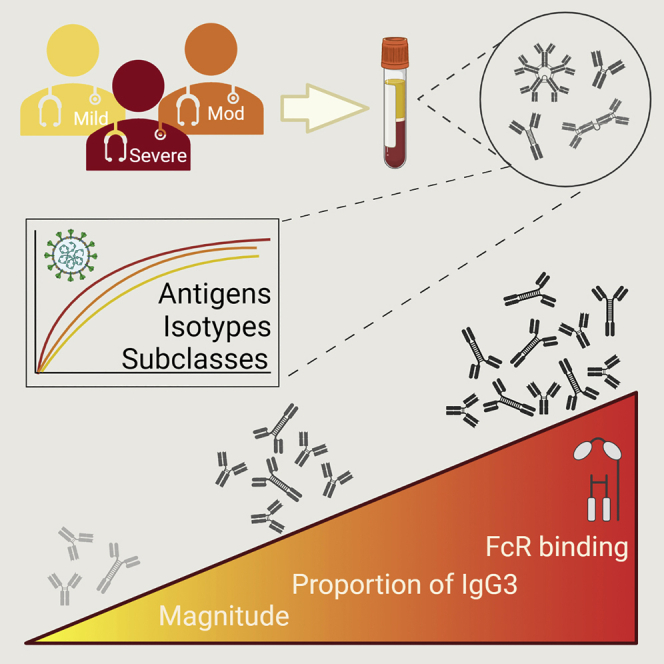
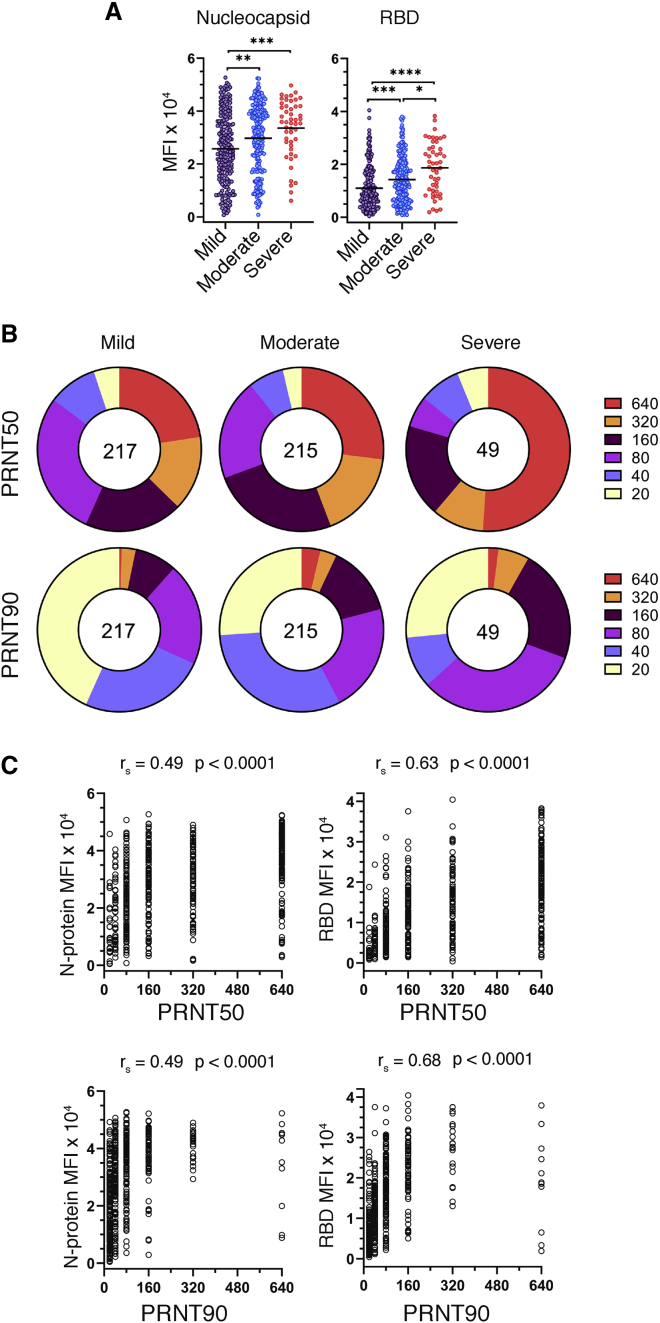
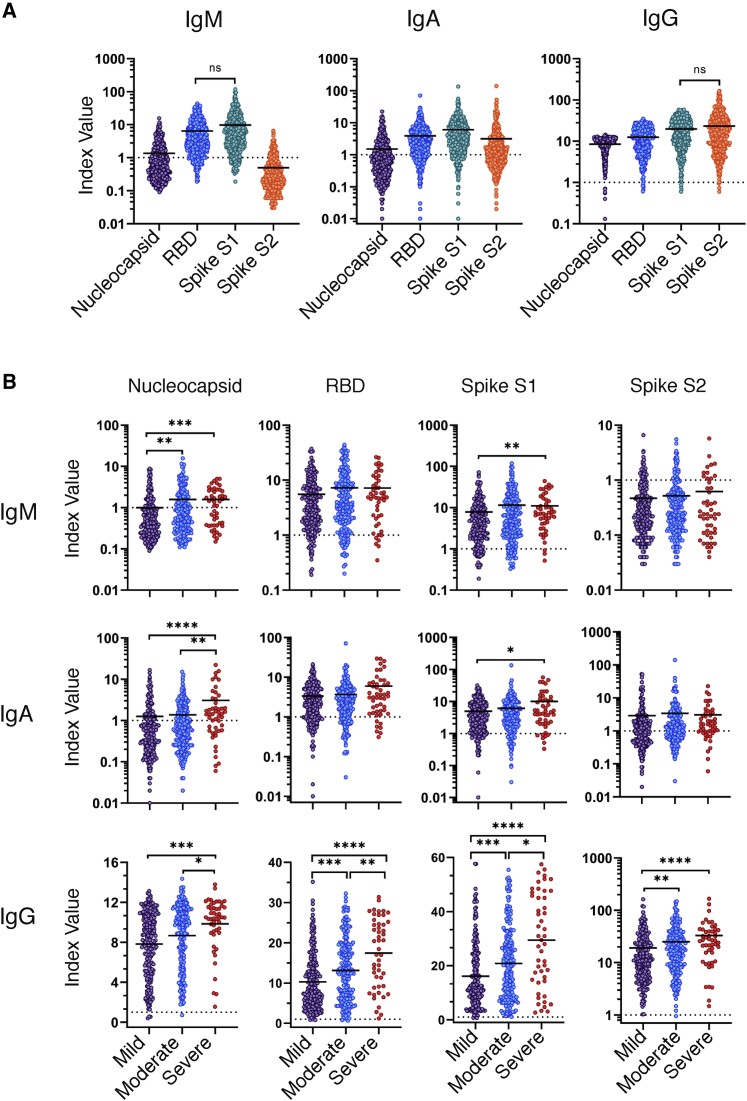
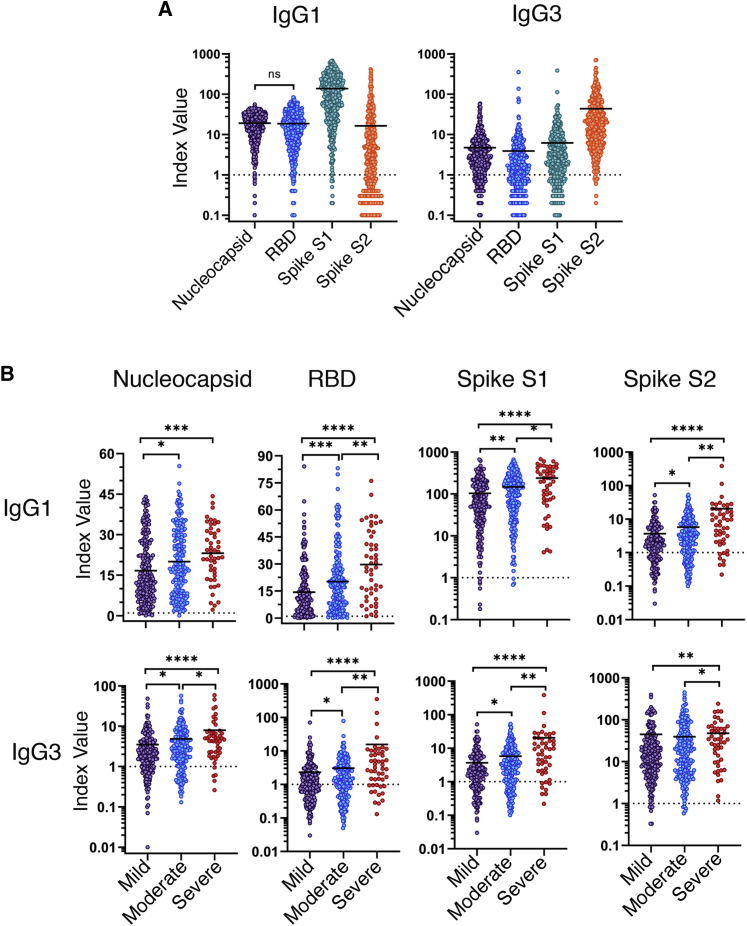
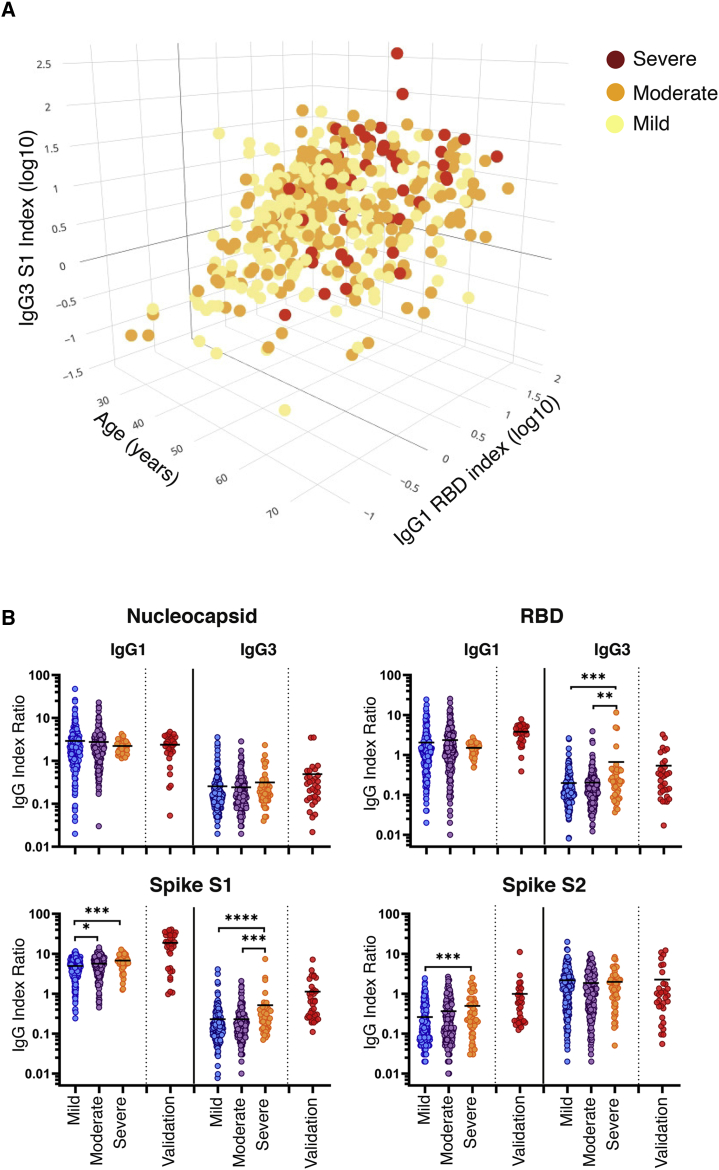
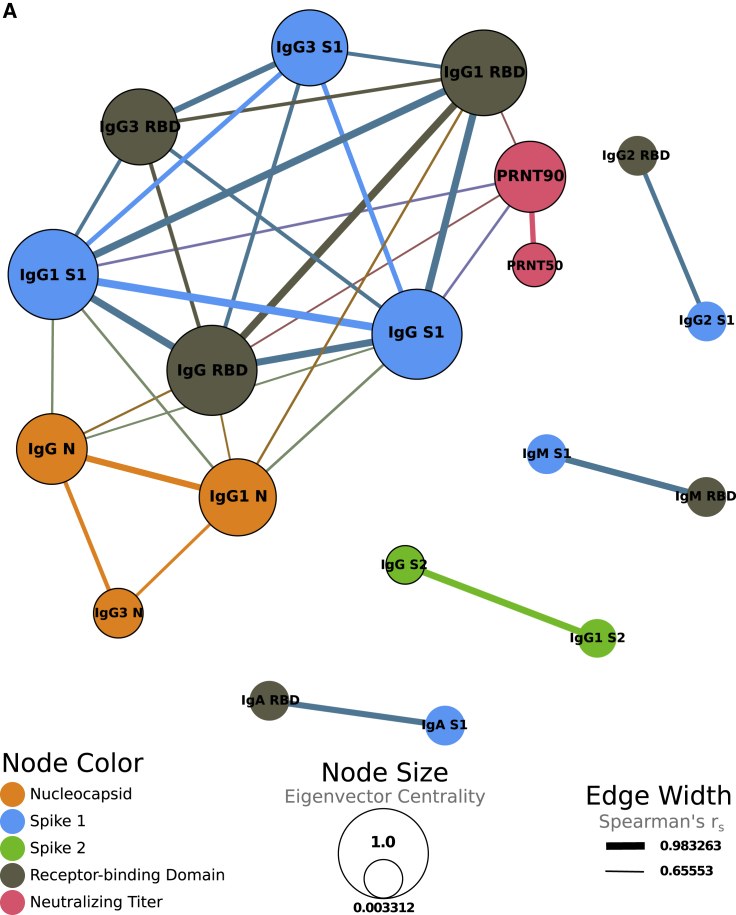
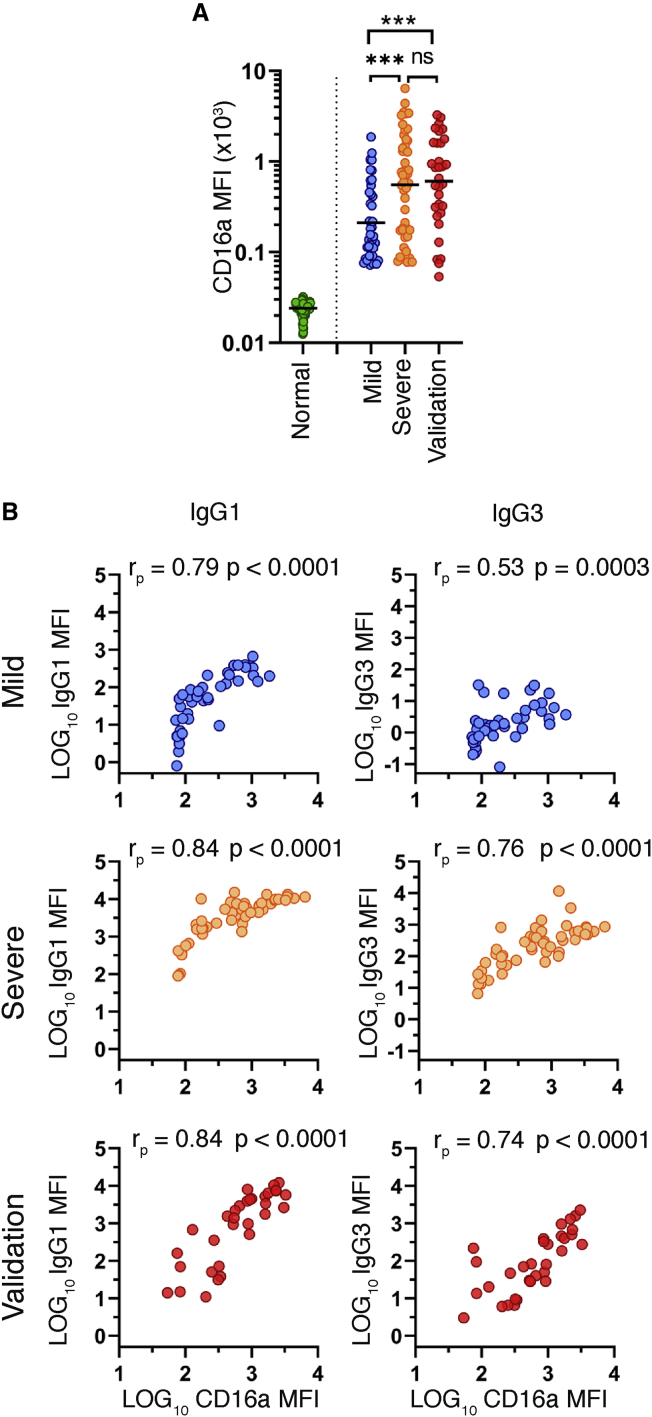
Coronavirus disease 2019 (COVID-19) is associated with a wide spectrum of disease presentation, ranging from asymptomatic infection to acute respiratory distress syndrome (ARDS). Paradoxically, a direct relationship has been suggested between COVID-19 disease severity and the levels of circulating severe acute respiratory syndrome coronavirus 2 (SARS-CoV-2)-specific antibodies, including virus-neutralizing titers. A serological analysis of 536 convalescent healthcare workers reveals that SARS-CoV-2-specific and virus-neutralizing antibody levels are elevated in individuals that experience severe disease. The severity-associated increase in SARS-CoV-2-specific antibody is dominated by immunoglobulin G (IgG), with an IgG subclass ratio skewed toward elevated receptor binding domain (RBD)- and S1-specific IgG3. In addition, individuals that experience severe disease show elevated SARS-CoV-2-specific antibody binding to the inflammatory receptor FcɣRIIIa. Based on these correlational studies, we propose that spike-specific IgG subclass utilization may contribute to COVID-19 disease severity through potent Fc-mediated effector functions. These results may have significant implications for SARS-CoV-2 vaccine design and convalescent plasma therapy.

Keywords: COVID-19; Fc-effector functions; IgG subclass; SARS-CoV-2; serology.


Conflict of interest statement

The authors declare no competing interests.

Figures

None
Graphical abstract
Figure 1
Figure 1
Relationship of antibody production and virus neutralization capability with COVID-19 disease severity Serum specimens from convalescent COVID-19 donors were analyzed for reactivity to SARS-CoV-2 antigens and neutralization capacity. (A) Median fluorescence intensity (MFI) of total Ig (IgM, -A, and -G) reactivity to SARS-CoV-2 nucleocapsid and RBD as determined by a microsphere immunoassay on convalescent COVID-19 serum specimens, grouped by disease severity (n = 481). Statistical significance was determined by the non-parametric Kruskal-Wallis test, where ∗p < 0.05, ∗∗p < 0.001, ∗∗∗p < 0.0001, and ∗∗∗∗p < 0.00001 adjusted for multiple comparisons by Dunn’s test. (B) Reciprocal plaque reduction neutralization titer (PRNT) 50 and 90 dilutions based on a live virus assay on convalescent COVID-19 individuals, grouped by disease severity (n = 481). The relative size of each pie slice represents the percentage of specimens with a given titer. The center number represents the number of specimens in each group. (C) PRNT50 and PRNT90 titers plotted against SARS-CoV-2 nucleocapsid or RBD MFI. Graphs and Spearman’s correlations are based on the full cohort (n = 536) patient specimens.
Figure 2
Figure 2
Isotype and antigen distribution of the SARS-CoV-2-specific antibody response Serum specimens from convalescent COVID-19 donors were analyzed for reactivity of IgM, IgA, and IgG specific to the SARS-CoV-2 nucleocapsid, RBD, S1 subunit, or S2 subunit. Index values represent the raw MFI divided by the cutoff value (3 standard deviations above the mean) determined by the average MFI of a panel of 94 pre-pandemic normal human serum specimens (cutoff = dashed line). (A) Index values for IgM, IgA, and IgG reactivity to SARS-CoV-2 antigens on the full cohort (n = 536). (B) Index values for the IgM, IgA, and IgG reactivity to SARS-CoV-2 antigens separated by COVID-19 disease severity (n = 481). Statistical significance was determined by the non-parametric Kruskal-Wallis test, where ∗p < 0.05, ∗∗p < 0.001, ∗∗∗p < 0.0001, and ∗∗∗∗p < 0.00001 adjusted for multiple comparisons by Dunn’s test. See also Table S2.
Figure 3
Figure 3
IgG subclass and antigen distribution of the SARS-CoV-2-specific antibody profile across COVID-19 disease severities Serum specimens from convalescent COVID-19 donors were analyzed for reactivity of IgG1 and IgG3 specific to the SARS-CoV-2 nucleocapsid, RBD, S1 subunit, or S2 subunit. Index values represent the raw MFI divided by the cutoff value (3 standard deviations above the mean) determined by the average MFI of a panel of 94 pre-pandemic normal human serum specimens (cutoff = dashed line). Reactivity of IgG1, IgG2, and IgG3 to SARS-CoV-2 nucleocapsid, RBD, S1 subunit, or S2 subunit of the full patient cohort (A) or grouped by disease severity (B) is shown. Index value represents the raw MFI divided by the background cutoff value determined by a panel of 94 normal human serum specimens. Statistical significance was determined by the non-parametric Kruskal-Wallis test, where ∗p < 0.05, ∗∗p < 0.001, ∗∗∗p < 0.0001, and ∗∗∗∗p < 0.00001 adjusted for multiple comparisons by Dunn’s test. See also Figure S1 and Table S4.
Figure 4
Figure 4
Identification of variables associated with COVID-19 disease severity (A) Three-dimensional scatterplot depicting the optimal feature set of disease-severity-associated features (age, log10-transformed index values [MFI/cutoff] for S1-specific IgG3, and RBD-specific IgG1) as determined by ordered probit regression and backward stepwise selection by Akaike information criterion. Data are displayed as the distribution of mild (yellow), moderate (orange), and severe (red) disease severities across variables in 478 patients. (B) Serum sample index ratios for IgG1 and -3 specific to the N, RBD, S1, and S2 subunits were calculated by dividing the IgG subclass index value by the paired total IgG index value (IgGsubclass/IgGtotal) for each antigen. Index ratios were grouped by disease by disease severity (n = 481). Statistical significance was determined by the non-parametric Kruskal-Wallis test, where ∗p < 0.05, ∗∗p < 0.001, ∗∗∗p < 0.0001, and ∗∗∗∗p < 0.00001 adjusted for multiple comparisons by Dunn’s test. See also Tables S5–S7.
Figure 5
Figure 5
Correlation of antibody measurements and COVID-19 clinical features (A) Correlation network displaying strongly correlated (Spearman’s rs > 0.65) variables. Edge thickness represents the magnitude of the correlation between variables. Node size represents eigenvector centrality, showing the influence of each node on the network. Node color represents whether that variable corresponds to an antibody targeting the nucleocapsid (orange), S1 (blue), S2 (green), or RBD (gray) regions or to neutralizing antibody titers (pink). Black borders around nodes correspond to variables with a significant correlation with severity determined by ordered probit regression modeling, while controlling for age as a confounding variable. All displayed correlations are statistically significant (Benjamini and Hochberg adjusted p < 0.05). See also Figure S2.
Figure 6
Figure 6
Association of Fc receptor binding to COVID-19 disease severity Serum specimens from 94 pre-pandemic normal human serum specimens, 43 specimens from the mild group, all 49 specimens from the severe group, and all 32 acute hospitalized specimens from the validation cohort were tested for CD16a (FcɣRIIIa) binding to trimeric full-length spike (FL-spike)-specific antibody. (A) MFI of FL-spike-specific CD16 binding as determined by a microsphere immunoassay. Statistical significance was determined by the non-parametric Kruskal-Wallis test, where ∗p < 0.05, ∗∗p < 0.001, ∗∗∗p < 0.0001, and ∗∗∗∗p < 0.00001 adjusted for multiple comparisons by Dunn’s test. (B) Pearson’s correlation comparing the log10-transformed MFI of CD16a binding to the log10-transformed MFI of S1-specific IgG1 or IgG3.

References

    1. McLaughlin C.C., Doll M.K., Morrison K.T., McLaughlin W.L., O’Connor T., Sholukh A.M., Bossard E.L., Phasouk K., Ford E.S., Diem K. High community SARS-CoV-2 antibody seroprevalence in a ski resort community, Blaine County, Idaho, US. preliminary results. medRxiv. 2020 doi: 10.1101/2020.07.19.20157198. - DOI
    1. Pollán M., Pérez-Gómez B., Pastor-Barriuso R., Oteo J., Hernán M.A., Pérez-Olmeda M., Sanmartín J.L., Fernández-García A., Cruz I., Fernández de Larrea N., ENE-COVID Study Group Prevalence of SARS-CoV-2 in Spain (ENE-COVID): a nationwide, population-based seroepidemiological study. Lancet. 2020;396:535–544. - PMC - PubMed
    1. Mathew D., Giles J.R., Baxter A.E., Oldridge D.A., Greenplate A.R., Wu J.E., Alanio C., Kuri-Cervantes L., Pampena M.B., D’Andrea K., UPenn COVID Processing Unit Deep immune profiling of COVID-19 patients reveals distinct immunotypes with therapeutic implications. Science. 2020;369:eabc8511. - PMC - PubMed
    1. Kuri-Cervantes L., Pampena M.B., Meng W., Rosenfeld A.M., Ittner C.A.G., Weisman A.R., Agyekum R.S., Mathew D., Baxter A.E., Vella L.A. Comprehensive mapping of immune perturbations associated with severe COVID-19. Sci. Immunol. 2020;5:eabd7114. - PMC - PubMed
    1. Chen G., Wu D., Guo W., Cao Y., Huang D., Wang H., Wang T., Zhang X., Chen H., Yu H. Clinical and immunological features of severe and moderate coronavirus disease 2019. J. Clin. Invest. 2020;130:2620–2629. - PMC - PubMed

Publication types