. 2021 Oct;69(10):2474-2487.
doi: 10.1002/glia.24054. Epub 2021 Jun 21.

Homogeneity or heterogeneity, the paradox of neurovascular pericytes in the brain

Affiliations

Homogeneity or heterogeneity, the paradox of neurovascular pericytes in the brain

Huimin Zhang et al. Glia. 2021 Oct.

Abstract

Pericytes are one of the main components of the neurovascular unit. They play a critical role in regulating blood flow, blood-brain barrier permeability, neuroinflammation, and neuronal activity. In the central nervous system (CNS), pericytes are classified into three subtypes, that is, ensheathing, mesh, and thin-strand pericytes, based on their distinct morphologies and region-specific distributions. However, whether these three types of pericytes exhibit heterogeneity or homogeneity with regard to membrane properties has been understudied to date. Here, we combined bulk RNA sequencing analysis with electrophysiological methods to demonstrate that the three subtypes of pericytes share similar electrical membrane properties in the CNS, suggesting a homogenous population of neurovascular pericytes in the brain. Furthermore, we identified an inwardly rectifying potassium channel subtype Kir4.1 functionally expressed in pericytes. Electrophysiological patch clamp recordings indicate that Kir4.1 channel currents in pericytes represent a small portion of the K+ macroscopic currents in physiological conditions. However, a significant augmentation of Kir4.1 currents in pericytes was induced when the extracellular K+ was elevated to pathological levels, suggesting pericytes Kir4.1 channels might play an important role as K+ sensors and contribute to K+ homeostasis in local neurovascular networks in pathology.

Keywords: Kir4.1 ion channels; electrical membrane properties; neurovascular unit; pericyte; potassium sensor.


Conflict of interest statement

The authors declare no competing interests.

Figures
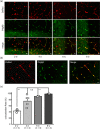
FIGURE 1
FIGURE 1
Specific labeling of pericytes in NG2DsRedBAC transgenic mice hippocampus during brain development. (a) Representative images showing the colocalization (in yellow) between DsRed (in red) and Pdgfrβ (in green) in NG2‐DsRed mouse hippocampus at postnatal 8 weeks. Scale bars, 20 μm. (b) Representative images at high resolution showing the colocalization (in yellow) between DsRed (in red) and Pdgfrβ (in green) at 8‐week NG2‐DsRed mouse hippocampus. Scale bar, 20 μm. (c) Summary bar graph shows the colocalization ratio between DsRed and Pdgfrβ in NG2‐DsRed mice hippocampus at different developmental stages. 2‐week‐old group: 43.31% ± 3.21, n = 3 mice; 4‐week‐old group: 75.88% ± 10.11, n = 4 mice; 6‐week‐old group: 91.55% ± 0.68, n = 3 mice; 8‐week‐old group: 99.45% ± 0.55, n = 4 mice. The error bars represent SEM, two‐tailed unpaired T‐test, p values are indicated as compared with postnatal 8‐week‐old group as control. n.s indicates not significant
FIGURE 2
FIGURE 2
Characterization of electrical membrane properties of the three subtypes of pericytes. (a) Representative images showing the distinct morphology of three subtypes of post‐fixed pericytes loaded with Alexa Fluor 488 in NG2DsRedBAC mouse hippocampus. The colocalization between DsRed (in red) and Alexa 488 (in green) is shown in yellow. Scale bars, 10 μm. (b) Bar graph summary showing the resting membrane potentials of three subtypes of pericytes. n = 7 cells for each group. The error bars represent SEM ANOVA Tukey–Kramer multiple comparisons, n.s indicates not significant. (c) Bar graph summary showing the membrane resistances of three subtypes of pericytes. n = 5 cells for each group. The error bars represent SEM ANOVA Tukey–Kramer multiple comparisons, n.s indicates not significant. (d) Representative traces show the voltage‐dependent macroscopic currents from thin‐strand (in red, n = 7 cells), mesh (in blue, n = 8 cells) and ensheathing (in green, n = 5 cells) pericytes. (e) Summary graph shows the average I/V plot of three subtypes of pericytes as indicated in (d). There is no significant difference of macroscopic K+ currents among the three subtypes of pericytes
FIGURE 3
FIGURE 3
Bulk RNA sequencing analysis and single‐cell RT‐PCR in 8‐week‐old NG2‐DsRed transgenic mice. (a) Experimental diagram showing the approach for DsRed‐labeled pericyte collection from a 8‐week‐old NG2‐DsRed transgenic mouse hippocampus by patch clamp method. (b) The heat map shows the abundance of mRNA (based on lg(FPKM + 1)) for inwardly rectifying K+ channel subunits expressed in pericytes. The FPKM value of each inwardly rectifying K+ channel subunits gene is: Kcnj8: 159.00; Kcnj10: 15.90; Kcnj9: 14.26; Kcnj4: 10.01; Kcnj12: 7.07; Kcnj3: 6.08; Kcnj6: 2.14; Kcnj2: 1.08; Kcnj15: 0.25; Kcnj16: 0.13; Kcnj13: 0.041. The pie chart shows the proportion of each inwardly rectifying K+ channel gene expressed in pericytes based on the results of RNA‐seq transcriptome analysis, n = 4 mice. Notably, high level of kcnj10 mRNA expression was found in DsRed‐labeled pericytes. (c) Experimental diagram showing the approach for RNA isolation from single pericytes in situ. Each subtype of pericyte is identified by performing whole‐cell patch‐clamp recordings and the DsRed fluorescent expression at their region‐specific distribution along the blood vessels. (d) At the end of recordings, the pericyte's cytoplasm is extracted by using glass pipettes for subsequent RT‐PCR. Representative images show that thin‐strand, mesh and ensheathing pericytes are positive for both DsRed and Kir4.1 mRNA expression, whereas a DsRed negative cell does not express Kir4.1 mRNA. n = 3 cells for each subtype of pericytes. Amplicon size for each mRNA: Kir4.1: 168 bp, DsRed: 394 bp, GAPDH: 317 bp
FIGURE 4
FIGURE 4
Elevation of external K+ activates Kir4.1 channels in pericytes. (a) Representative traces show macroscopic K+ currents (in black), macroscopic currents after bath application of Ba2+ (in red) and Ba2+‐sensitive currents (in gray) in a whole‐cell patched pericyte in NG2‐DsRed transgenic mouse hippocampus. (b) Average I/V plot shows there is no detectable Ba2+‐sensitive currents in pericytes under normal conditions at 2.5 mM [K+]o. The error bars represent SEM, n = 12 cells. (c) Representative traces show macroscopic K+ currents in 15 mM [K+]o (in black), macroscopic currents after bath application of Ba2+ in 15 mM [K+]o (in red) and Ba2+‐sensitive currents in 15 mM [K+]o (in blue) in a whole‐cell patched pericyte in NG2‐DsRed transgenic mouse hippocampus. (d) Average I/V plot shows the macroscopic and Ba2+‐sensitive currents in 15 mM [K+]o. The error bars represent SEM, n = 7 cells. (e) Representative traces show macroscopic K+ currents in 50 mM [K+]o (in black), macroscopic currents after bath application of Ba2+ in 50 mM [K+]o (in red) and Ba2+‐sensitive currents in 15 mM [K+]o (in green) in a whole‐cell patched pericyte in NG2‐DsRed transgenic mouse hippocampus. (f) Average I/V plot shows the macroscopic and Ba2+‐sensitive currents in 50 mM [K+]o. the error bars represent SEM n = 11 cells. (g) Bar graph summary shows the augmentation in Ba2+‐sensitive currents under 2.5 mM [K+]o (in gray), 15 mM [K+]o (in blue) and 50 mM [K+]o (in green) when the cell's voltage was held at −142 mV. N = 12, 7 and 11 cells for 2.5, 15, and 50 mM [K+]o group, respectively. *** indicates p < .001, two‐tailed unpaired T‐test. (h) Bar graph summary shows the percentage of Ba2+‐sensitive currents from the total macroscopic currents under 2.5 mM [K+]o (in gray), 15 mM [K+]o (in blue), and 50 mM [K+]o (in green) when the cell's voltage was held at −142 mV. n = 12, 7, and 11 cells for 2.5, 15, and 50 mM [K+]o group, respectively. The error bars represent SEM. *** indicates p < .001, two‐tailed unpaired T‐test
FIGURE 5
FIGURE 5
Astrocytic Kir4.1 channel currents do not change under 2.5 mM [K+]o and 50 mM [K+]o. (a) Representative images show that a large number of GFAP‐labeled astrocytes evenly distribute in the CA1 region of wild‐type mouse hippocampus. (b) Bar graphs summary show the RMPs and membrane input resistances of astrocytes. n = 10 cells recorded. The error bars represent SEM. (c) Representative traces show macroscopic K+ currents (in black), macroscopic currents after bath application of Ba2+ (in red) and Ba2+‐sensitive Kir4.1 currents (in blue) in a whole‐cell patched astrocyte under 2.5 mM [K+]o in wild‐type mouse hippocampus. (d) Average I/V plot shows the Ba2+‐sensitive Kir4.1 currents in astrocytes in 2.5 mM [K+]o. n = 11 cells. (e) Representative traces show macroscopic K+ currents (in black), macroscopic currents after bath application of Ba2+ (in red) and Ba2+‐sensitive Kir4.1 currents (in green) in a whole‐cell patched astrocyte under 50 mM [K+]o in wild‐type mouse hippocampus. (f) Average I/V plot shows the macroscopic K+ currents and Ba2+‐sensitive Kir4.1 currents in 50 mM [K+]o. n = 10 cells. (g) Bar graph summary shows the Ba2+‐sensitive Kir4.1 currents in 2.5 mM [K+]o (in blue) and 50 mM [K+]o (in green) when the cell's voltage was held at −142 mV. n = 11 and 10 cells for 2.5 and 50 mM [K+]o group, respectively. n.s indicates not significant, two‐tailed unpaired T‐test. (h) Bar graph summary shows a decrease of the percentage of Ba2+‐sensitive Kir4.1 currents among total macroscopic K+ currents in 50 mM [K+]o (in green) when the cell's voltage was held at −142 mV. n = 11 and 10 cells for 2.5 and 50 mM [K+]o group, respectively. The error bars represent SEM. *** indicates p < .001, two‐tailed unpaired T‐test
FIGURE 6
FIGURE 6
(a) Representative traces show macroscopic K+ currents (in black) after bath application of the Kir6.1 channel inhibitor glibenclamide (10 μM) (in red) and glibenclamide‐sensitive Kir6.1 currents (in gray) under 15 mM [K+]o in a whole‐cell patched pericyte in NG2‐DsRed transgenic mouse hippocampus. (b) Representative traces show macroscopic K+ currents (in black), macroscopic currents after bath application of the Kir4.1 channel antagonist VU0134992 (15 μM) (in red) and VU‐sensitive Kir4.1 currents (in purple) under 15 mM [K+]o in a whole‐cell patched pericyte in NG2‐DsRed transgenic mouse hippocampus. (c) Left panel shows the average I/V plot of the Kir6.1 channel‐mediated currents and Kir4.1 channel‐mediated currents under 15 mM [K+]o. Right panel shows the bar graph summary of the Kir6.1 current and Kir4.1 current when the cell's voltage was held at −142 mV under 15 mM [K+]o. n = 6 for each group. The error bars represent SEM. ** indicates p < .01, two‐tailed unpaired T‐test. (d) Upper panel shows the experimental diagram of the approach for recording inward K+ channel currents of pericytes in hypoxia. The lower panel shows two representative traces of inward K+ currents of a recorded pericyte in control condition (in black) and in hypoxic condition (in red). The red arrow indicates the augmentation of K+ currents in pericyte induced by hypoxia. (e) Bar graph summary shows the inward K+ currents in hypoxia relative to the control with the holding voltage at −142 mV, n = 7 cells. The error bars represent SEM. ** indicates p < .01, two‐tailed paired T‐test

Similar articles

Cited by

References

    1. Attwell, D., Mishra, A., Hall, C. N., O'Farrell, F. M., & Dalkara, T. (2016). What is a pericyte? Journal of Cerebral Blood Flow & Metabolism, 36(2), 451–455. 10.1177/0271678x15610340 - DOI - PMC - PubMed
    1. Berthiaume, A. A., Hartmann, D. A., Majesky, M. W., Bhat, N. R., & Shih, A. Y. (2018). Pericyte structural remodeling in cerebrovascular health and homeostasis. Frontiers in Aging Neuroscience, 10, 210. 10.3389/fnagi.2018.00210 - DOI - PMC - PubMed
    1. Birbrair, A. (2018). Pericyte biology: Development, homeostasis, and disease. Advances in Experimental Medicine and Biology, 1109, 1–3. 10.1007/978-3-030-02601-1_1 - DOI - PubMed
    1. Bondjers, C., He, L., Takemoto, M., Norlin, J., Asker, N., Hellström, M., … Betsholtz, C. (2006). Microarray analysis of blood microvessels from PDGF‐B and PDGF‐Rbeta mutant mice identifies novel markers for brain pericytes. Federation of American Societies for Experimental Biology Journal, 20(10), 1703–1705. 10.1096/fj.05-4944fje - DOI - PubMed
    1. Cao, C., Goo, J. H., Lee‐Kwon, W., & Pallone, T. L. (2006). Vasa recta pericytes express a strong inward rectifier K+ conductance. American Journal of Physiology, Regulatory, Integrative and Comparative Physiology, 290(6), R1601–R1607. 10.1152/ajpregu.00877.2005 - DOI - PubMed

Publication types

MeSH terms

Substances