Loss of neuronal Miro1 disrupts mitophagy and induces hyperactivation of the integrated stress response
- PMID: 34152608
- PMCID: PMC8280823
- DOI: 10.15252/embj.2018100715
Loss of neuronal Miro1 disrupts mitophagy and induces hyperactivation of the integrated stress response
Abstract
Clearance of mitochondria following damage is critical for neuronal homeostasis. Here, we investigate the role of Miro proteins in mitochondrial turnover by the PINK1/Parkin mitochondrial quality control system in vitro and in vivo. We find that upon mitochondrial damage, Miro is promiscuously ubiquitinated on multiple lysine residues. Genetic deletion of Miro or block of Miro1 ubiquitination and subsequent degradation lead to delayed translocation of the E3 ubiquitin ligase Parkin onto damaged mitochondria and reduced mitochondrial clearance in both fibroblasts and cultured neurons. Disrupted mitophagy in vivo, upon post-natal knockout of Miro1 in hippocampus and cortex, leads to a dramatic increase in mitofusin levels, the appearance of enlarged and hyperfused mitochondria and hyperactivation of the integrated stress response (ISR). Altogether, our results provide new insights into the central role of Miro1 in the regulation of mitochondrial homeostasis and further implicate Miro1 dysfunction in the pathogenesis of human neurodegenerative disease.
Keywords: Parkinson’s disease; Rhot1; Rhot2; eIF2α; megamitochondria.
© 2021 The Authors. Published under the terms of the CC BY 4.0 license.
Conflict of interest statement
G.L‐D. is supported by AstraZeneca Pharmaceuticals post‐doctoral programme (000033622/1363780). R.B., D.C. and N.J.B. are or have been employees of AstraZeneca Pharmaceuticals.
Figures

- A–E
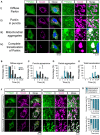
(A) Representative images (and details from boxed regions) of WT MEF cells transfected with YFPParkin (green) and treated with FCCP (10 µM) to induce mitophagy. Cells were immunostained with anti‐Tom20 (magenta) to reveal the mitochondrial network. Each row represents one stage in the process of mitophagy that has been used to score the progression of mitophagy at different time points for the different conditions tested (the specific time point of each example is indicated in the image). From top to bottom: (i) “Diffuse Parkin” defines cells where Parkin expression is homogenously distributed throughout the cytoplasm (quantified in B). (ii) Soon after mitochondrial damage, Parkin appears enriched in small “puncta” throughout the cytoplasm localising within isolated mitochondria (quantified in C). (iii) Later in the process, these puncta aggregate into bigger structures accumulating in perinuclear regions (quantified in D). (iv) The process of Parkin translocation eventually affects all the mitochondrial population which usually collapses into several large structures possibly forming part of big autolysosomes in the perinuclear region (quantified in D). Scoring was performed from 3 independent experiments (n = 3; one‐way ANOVA with Dunnett post‐test).
- F, G
(F) Representative images (and details from boxed regions) of WT MEF cells transfected with GFPPINK1 (green) and treated with FCCP (10 µM) to induce mitophagy. Cells were immunostained with anti‐Tom20 (magenta) to reveal the mitochondrial network. Each row represents one of the three categories of GFP signal used to describe PINK1 stabilisation on mitochondria after mitochondrial damage (cytoplasmic, intermediate and mitochondrial). The scoring of these categories was used to describe PINK1 stabilisation on mitochondria in WT and MiroDKO cells at different time points shortly after mitochondrial insult (G). Data collected from three independent experiments (n = 3).

- A
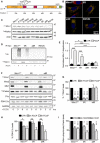
Schematic representation of hMiro1 sequence highlighting domains and lysine residues (Lys) in its sequence. Key lysine residues reported to be ubiquitinated upon mitochondria damage and mutated to generate the mycMiro15R mutant construct are highlighted.
- B
Representative images showing full‐length control and selected Miro1 lysine mutants (Miro15R, Miro1allR and Miro1R572K) expressing in MiroDKO MEF cells. All constructs (myc‐tag, green) localise to mitochondria (Tom20, red).
- C
Immunoblot showing efficient expression of Miro1 lysine mutants in FlagParkin‐expressing SH‐SY5Y cells.
- D, E
Ubiquitination assay showing that Miro1 lysine mutants have reduced ubiquitination upon FCCP treatment (1 h, 10 μM) in FlagParkin‐overexpressing SH‐SY5Y. The effect is quantified in (E) (n = 4 independent experiments for Miro1WT and Miro15R and n = 3 for Miro1allR and Miro1R572K, ANOVA with Sidak’s post hoc test).
- F–I
Representative western blot showing a degradation assay in FlagParkin‐overexpressing SH‐SY5Y cells transfected with Miro1WT, Miro15R or Miro1allR constructs and treated with FCCP (10 μM) for 3 or 6 h. Quantification of Miro1 levels (G), the matrix protein PDH‐E1α in (H) and Parkin levels (I) (n = 4 independent experiments; ANOVA with Sidak’s post hoc test).

- A
Representative images at 3 h of FCCP treatment (10 µM) of YFPParkin‐expressing (green) MiroDKO cells co‐transfected with the specified myc‐tagged versions of Miro1 (cyan). Tom20 (red) was used to reveal the mitochondrial network. A detail of YFPParkin translocation onto the mitochondrial network is also shown for each condition.
- B, C
Quantification of the fraction of cells showing advanced stages of the mitophagic process (cells showing mitochondrial aggregation due to advanced Parkin translocation or the complete translocation of Parkin onto all the mitochondrial network) at 1 h (B) or 3 h (C) after FCCP treatment (data collected from at least 3 independent experiments: WT n = 7, MiroDKO n = 8, +mycMiro1WT = 7, mycMiro15R = 3, mycMiro1allR = 3; mycMiro2 = 3; one‐way ANOVA with Dunnett post‐test).
- D
Western blots and quantification of Miro1 degradation in MiroDKO cells co‐expressing YFPParkin and the indicated myc‐tagged Miro1 constructs and treated with FCCP (10 µM) for the indicated times (n = 3 different experiments; two‐way ANOVA with Dunnett post‐test; comparisons between Miro1WT and Miro1allR are represented with yellow asterisks, comparisons between Miro1WT and Miro15R are represented in green, and comparisons between Miro15R and Miro1allR are represented in black).
- E
Representative images at 24 h of FCCP treatment (10 µM) of YFPParkin‐expressing (green) MiroDKO cells co‐transfected with the specified myc‐tagged versions of Miro1 (cyan). Tom20 (red) was used to reveal the mitochondrial network. Expression of both ubiquitin mutants (Miro15R and Miro1allR – arrowheads) protects from the mitophagic clearance of mitochondria (arrows) after damage.
- F
Quantification of the fraction of cells showing the complete loss of Tom20 signal of mitochondria after 24 h of FCCP treatment (data collected from at least three independent experiments: MiroDKO n = 8, mycMiro1WT = 7, mycMiro15R = 3, mycMiro1allR = 3; one‐way ANOVA with Dunnett post‐test).

Representative confocal images of the soma of WT and Miro1KO cortical neurons expressing YFPParkin and MtDsRed after valinomycin treatment at the indicated time points (scale bars = 5 µm).
Airyscan confocal images of Parkin recruitment after 5 h of valinomycin treatment in WT and Miro1KO neuronal processes (scale bars = 2.5 µm).
Fluorescent linescans of YFPParkin and MtDsRed signal in WT and Miro1KO neurons after 5 h of valinomycin treatment (lines shown in A).
Quantification of Parkin recruitment to mitochondria (YFPParkin signal overlapping MtDsRed signal. Intensity adjusted and normalised to t = 0) in WT and Miro1KO neurons following valinomycin treatment (n = 15 cells for all conditions per genotype over 3 neuronal preparations; two‐way ANOVA).
Quantification of mitochondrial occupancy (area of MtDsRed signal in soma/entire area of soma) in the somas of WT and Miro1KO neurons following valinomycin treatment (n = 15 cells for all conditions per genotype over 3 neuronal preparations; two‐way ANOVA).
Quantification of mitochondrial clearance in somas of WT and Miro1KO neurons between 2 and 5 h of valinomycin treatment (n = 15 cells for all conditions per genotype over 3 neuronal preparations; unpaired t‐test).
Representative confocal images of WT, Miro1KO and PINK1KO cortical neurons immunostained with MAP2 (cyan) and pS65‐Ub (green) after valinomycin treatment (scale bars = 20 µm).
Quantification of pS65‐Ub signal intensity within MAP2 signal (normalised to MAP2 area and t = 0) in Miro1WT, Miro1KO and PINK1KO neurons following valinomycin treatment (n = 3, 4 and 3 embryos from WT, Miro1KO and PINK1KO embryos, respectively, 6 ROIs per condition; two‐way ANOVA).
Representative confocal images of the soma of Miro1KO cortical neurons expressing Miro1WT and mutant forms of Miro1, YFPParkin and MtDsRed without valinomycin treatment (scale bars = 10 µm). Quantification of Parkin co‐localisation with MtDsRed (YFPParkin signal overlapping MtDsRed signal. Intensity adjusted) in the soma of Miro1KO and PINK1KO cortical neurons (n = 12 cells for all conditions per genotype over 3 neuronal preparations; one‐way ANOVA).
Representative confocal images of the soma of Miro1KO cortical neurons expressing WT and mutant forms of Miro1, YFPParkin and MtDsRed after 5 h of valinomycin treatment (scale bars = 10 µm). Quantification of Parkin recruitment to mitochondria (normalised to t = 0) in Miro1KO and PINK1KO cortical neurons following valinomycin treatment (n = 12 cells for all conditions per genotype over 3 neuronal preparations, two‐way ANOVA).

- A
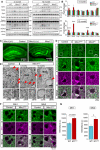
Representative blots of 4‐ and 12‐month‐old hippocampal lysates from control, Miro1CKO and Miro2KO.
- B
Quantification of protein levels in 4‐month lysates and 12‐month lysates (n = 3 animals/genotype at 4 months and n = 4 animals/genotype at 12 months; one‐way ANOVA with post hoc Dunnett’s test).
- C
Representative images of hippocampal regions from control and Miro1CKO crossed with mitoDendra animals.
- D
Details from cortical regions of control, Miro1CKO and Miro2KO animals at 12 months of age showing large mitochondrial structures occurring only in the case of Miro1CKO animals.
- E–G
Electron microscopy images of control and Miro1CKO brains showing the ultrastructure of the mitochondrial compartment. The mitochondrial units in Miro1CKO cells are enlarged and show altered cristae structure at 4 months of age. This process is progressive as mitochondrial structures appear larger and with reduced intra‐mitochondrial complexity at 12 months of age. Representative images (F) and quantification (G) of Mfn1 and Mfn2 staining in cortical slices from 12‐month WT and Miro1CKO mice (n = 4 animals/genotype; Student’s t‐test).

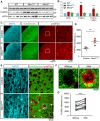
Representative western blot images of brain lysates from 12‐month WT, Miro1CKO and Miro2KO mice immunoblotted with the antibodies stated.
Quantification of eIF2α and P‐eIF2α band intensity (normalised to actin band intensity) from 12‐month WT, Miro1CKO and Miro2KO brain lysates. Phosphorylation of eIF2α is defined as P‐eIF2α/eIF2α (n = 4 mice per genotype, unpaired t‐test).
Representative confocal images of cortical regions of 12‐month mitoDendra crossed control and Miro1CKO mice stained with MAP2 and P‐eIF2α.
Quantification of P‐eIF2α signal intensity from cortical regions of 12‐month mitoDendra‐crossed control and Miro1CKO mice (n = 4 mice per genotype; unpaired t‐test).
Representative confocal images (63×) of cortical regions of 12‐month mitoDendra‐crossed control and Miro1CKO mice stained with MAP2 and P‐eIF2α. Arrows indicate the presence of megamitochondria (> 2.5 µm2) and stars indicate neuronal somas without megamitochondria.
Example zoom images of neuronal somas with and without megamitochondria from cortical regions of 12‐month mitoDendra‐crossed Miro1CKO mice stained with P‐eIF2α.
Quantification P‐eIF2α signal intensity (a.u.) from neuronal somas with and without megamitochondria from cortical regions of 12‐month mitoDendra‐crossed Miro1CKO (n = 16 sections from 4 mice; paired t‐test).
References
Publication types
MeSH terms
Substances
Grants and funding
LinkOut - more resources
Full Text Sources
Molecular Biology Databases
Research Materials

