. 2021 Aug 2;131(15):e148542.
doi: 10.1172/JCI148542.

Cytomegalovirus mediates expansion of IL-15-responsive innate-memory cells with SIV killing function

Affiliations

Cytomegalovirus mediates expansion of IL-15-responsive innate-memory cells with SIV killing function

Gema Méndez-Lagares et al. J Clin Invest. .

Abstract

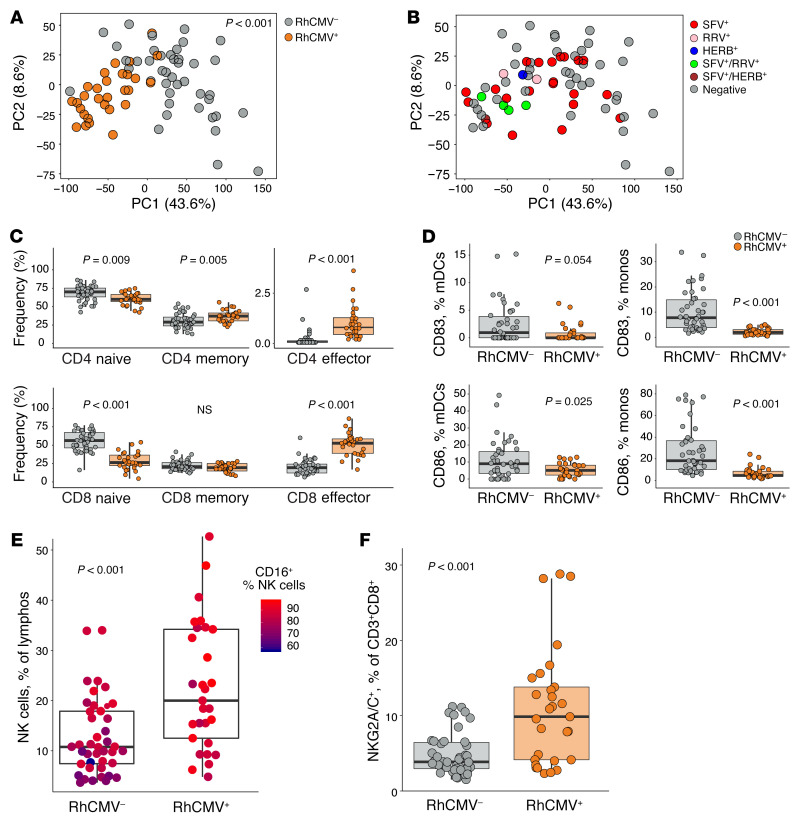
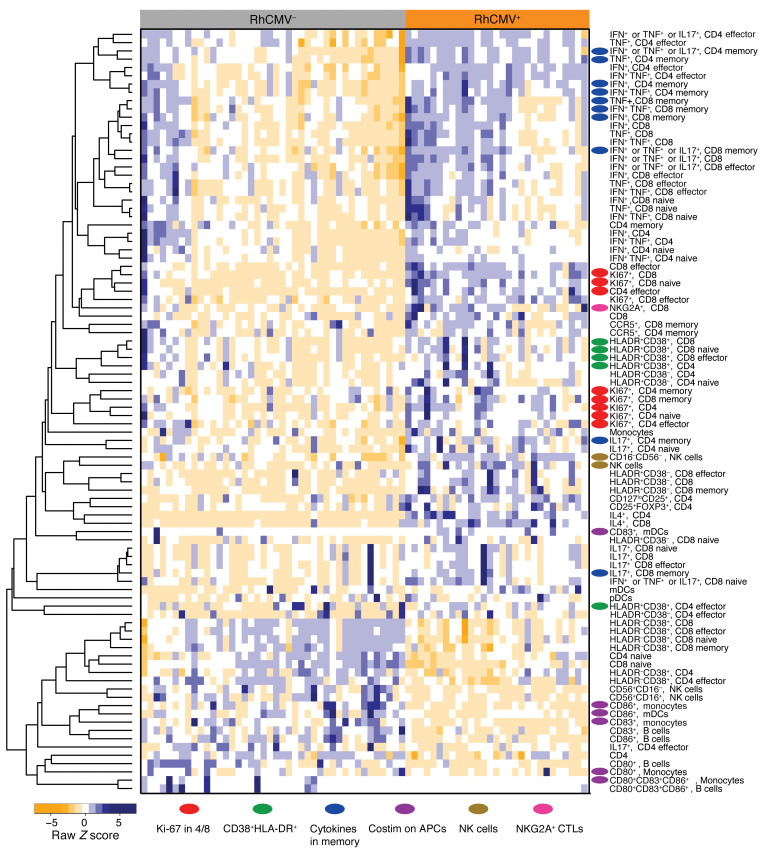
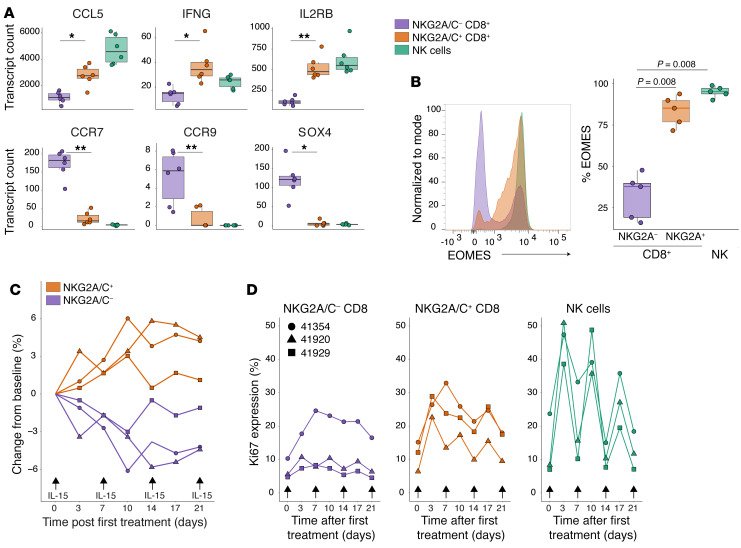
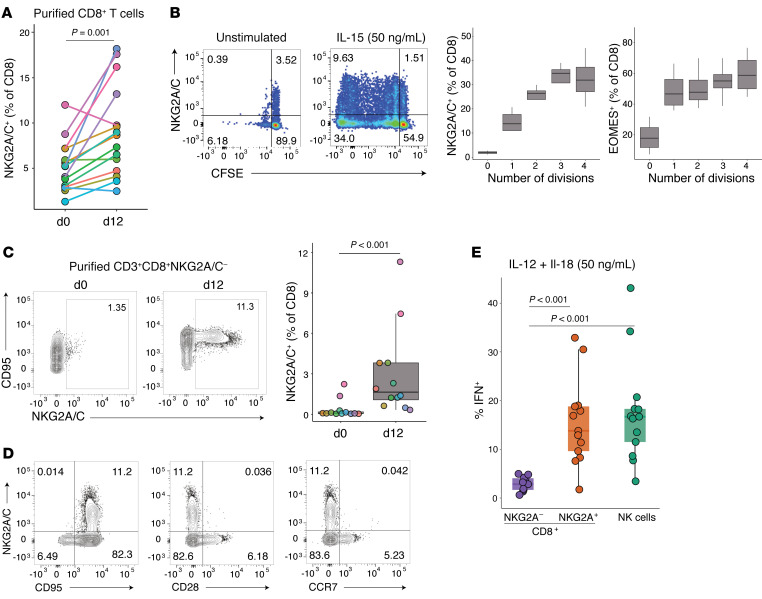
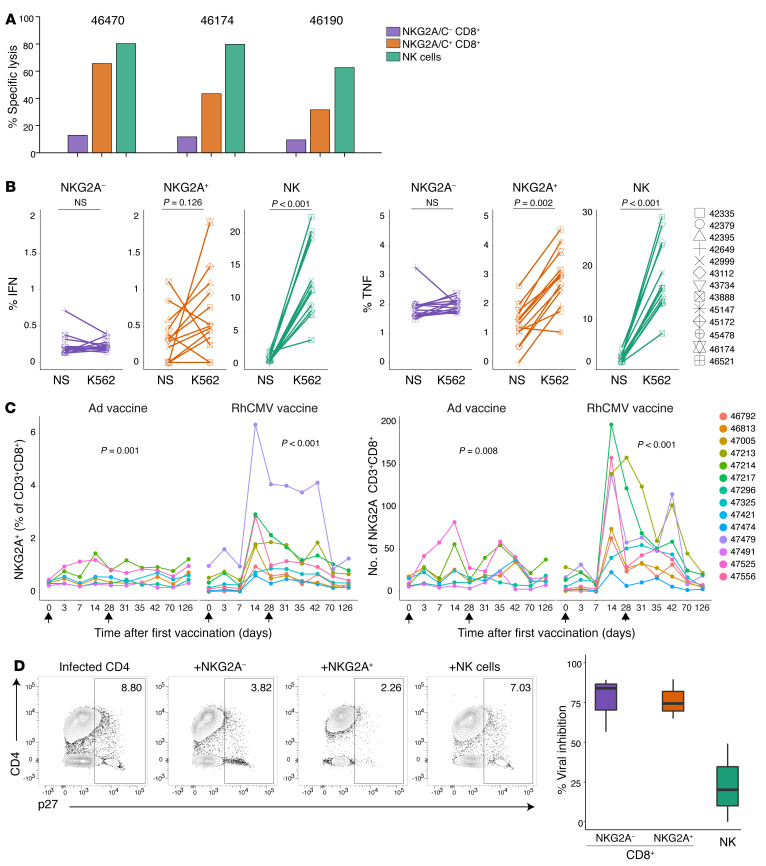
Interindividual immune variability is driven predominantly by environmental factors, including exposure to chronic infectious agents such as cytomegalovirus (CMV). We investigated the effects of rhesus CMV (RhCMV) on composition and function of the immune system in young macaques. Within months of infection, RhCMV was associated with impressive changes in antigen presenting cells, T cells, and NK cells-and marked expansion of innate-memory CD8+ T cells. These cells express high levels of NKG2A/C and the IL-2 and IL-15 receptor beta chain, CD122. IL-15 was sufficient to drive differentiation of the cells in vitro and in vivo. Expanded NKG2A/C+CD122+CD8+ T cells in RhCMV-infected macaques, but not their NKG2-negative counterparts, were endowed with cytotoxicity against class I-deficient K562 targets and prompt IFN-γ production in response to stimulation with IL-12 and IL-18. Because RhCMV clone 68-1 forms the viral backbone of RhCMV-vectored SIV vaccines, we also investigated immune changes following administration of RhCMV 68-1-vectored SIV vaccines. These vaccines led to impressive expansion of NKG2A/C+CD8+ T cells with capacity to inhibit SIV replication ex vivo. Thus, CMV infection and CMV-vectored vaccination drive expansion of functional innate-like CD8 cells via host IL-15 production, suggesting that innate-memory expansion could be achieved by other vaccine platforms expressing IL-15.

Keywords: Cellular immune response; Immunology; Infectious disease; Innate immunity; T cells.


Conflict of interest statement

Conflict of interest: The authors have declared that no conflict of interest exists.

Figures

Figure 1
Figure 1. Extensive effects of RhCMV on the macaque immune system.
(A) PCA summarizing variability in all immune parameters measured by flow cytometry. Dot plots represent values along the first and second principal component axes for RhCMV macaques (gray dots) and RhCMV+ macaques (orange dots). (B) PCA plot with dots colored according to presence of other common viral infections: SFV (red dots), RRV (pink dots), HERB (blue dots), SFV+ and RRV+ (green dots), SFV+ and HERB+ (brown dots), and seronegative (gray dots). (C) Percentage of naive (CD28+CD95), memory (CD28+CD95+), and effector (CD28CD95+) cells among CD4+ and CD8+ T cells in RhCMV and RhCMV+ groups. (D) Percentage of CD83+ and CD86+ among mDCs (CD3CD20CD16CD14HLADR+CD11c+CD123) and monocytes (CD3CD20HLADR+CD14+) in RhCMV and RhCMV+ groups. (E) Percentage of NK cells (CD3CD20CD8+NKG2A+) in RhCMV and RhCMV+ groups, colored according to the fraction of NK cells that were CD16+. (F) Percentage of NKG2A/C+CD8+ CTLs (CD3+CD8+NKG2A+) in RhCMV and RhCMV+ groups. Peripheral blood immunophenotypes were characterized in 42 RhCMV and 29 RhCMV+ rhesus macaques. Box plots show the median value, 25th and 75th quartiles, and the range of values. Permutational MANOVA (function vegan:adonis) was used to assess correlations between dissimilarity of samples and RhCMV serostatus in A. Wilcoxon rank-sum tests were used to calculate P values in CG.
Figure 2
Figure 2. Heatmap of immune phenotypes differently expressed by RhCMV groups.
Wilcoxon rank sum tests were used to identify immune subsets found to be significantly different between RhCMV+ and RhCMV- groups. Immune cell subsets that were found significantly different between groups (P < 0.05) were included to generate the heatmap.
Figure 3
Figure 3. Gene expression profiles of dendritic cells, NK cells, and T cells in RhCMV and RhCMV+ rhesus macaques.
(A) Venn diagram showing differently expressed genes (adjusted P < 0.05) in 3 sorted cell types examined for RhCMV and RhCMV+ macaques. (B) Venn diagram showing the top 25 significant (P < 0.05) KEGG pathways. (C) Volcano-plot representations of differentially expressed genes in the indicated KEGG pathways among CD11c+ DCs (top), NKG2A/CCD8+ T cells (middle), or NK cells (bottom) in RhCMV+ and RhCMV macaques. Each colored pie slice indicates membership of the corresponding gene in the KEGG pathway; colors defined in the key. Transcriptomic analysis was performed of flow-sorted cell types from 6 RhCMV+ and 6 RhCMV rhesus macaques. Differential expression analyses were conducted with the limma-voom Bioconductor pipeline, using a statistical model incorporating the flow-sorted cell population, RhCMV serostatus, and fragmentation time.
Figure 4
Figure 4. Gene expression of flow-sorted NKG2A/C+CD8+ T cells.
(A) MDS plot of transcript abundances using distances based on log2-fold differences. (B) Heatmap showing scaled values for transcripts that were found to be statistically different (adjusted P < 0.05) between NKG2A/C+ and NKG2A/C CD8+ T cells in 6 RhCMV+ macaques.
Figure 5
Figure 5. NKG2A/C+CD8+ T cells exhibit transcriptional and functional features of TVMs.
(A) Abundance of transcripts commonly expressed by TVMs in sorted cell populations from 6 RhCMV+ and 6 RhCMV rhesus macaques. (B) Left: Representative histogram showing expression of EOMES among gated NKG2A/C+CD8+ T cells, NKG2A/CCD8+ T cells or NK cells. Right: Percentage of EOMES+ in the 3 gated populations from 5 different macaques. Dynamics (C) and Ki-67 expression (D) of NKG2A/C+CD8+, NKG2A/CCD8+ T cells and NK cells following treatment of 3 RhCMV+ rhesus macaques with recombinant IL-15 (10 μg/kg) and IL-15Rα (40 μg/kg). Box plots show the median value, 25th and 75th quartiles, and the range of values. Wilcoxon signed-rank tests were used to compare values. *Adjusted P < 0.05, **Adjusted P < 0.001.
Figure 6
Figure 6. NKG2A/C+CD8+ T cells exhibit functional features of TVMs.
(A and B) Purified CD8+ T cells from 15 RhCMV+ rhesus macaques were cultured for 12 days with IL-15 (50 ng/mL). (A) Percentage of NKG2A-expressing CD8+ T cells on days 0 or 12. (B) Left: Representative plots showing NKG2A expression on dividing cells, which are marked by CFSE on day 12 in unstimulated and IL-15–stimulated cultures. Right: Graph showing the increase in NKG2A and EOMES expression on CD8+ T cells gated by division number (according to CFSE dilution), box plots show the median value, 25th and 75th quartiles, and the range of values, n = 5. (C and D) Purified NKG2A/C CD8+ CTLs from 12 RhCMV+ rhesus macaques were cultured for 12 days with IL-15 (50 ng/mL). (C) Left: Representative plots showing NKG2A expression on days 0 and 12. Right: Percentage of NKG2A-expressing CD8+ T cells on days 0 or 12. (D) Flow cytometry plots showing NKG2A/C, CD95, CD28, and CCR7 on day 12. (E) PBMCs from 13 RhCMV+ rhesus macaques were cultured for 48 hours with IL-12 and IL-18. IFN-γ expression was analyzed after gating on NKG2A/C+CD8+ T cells, NKG2A/CCD8+ T cells, or NK cells. The frequencies of IFN-γ–expressing cells among NKG2A/C+CD8+ T cells when cultured in medium alone was lower than 1.6%. Box plots show the median value, 25th and 75th quartiles, and the range of values. Wilcoxon signed-rank tests were used to compare values.
Figure 7
Figure 7. NKG2A/C+CD8+ T cells have functional capacities similar to those of NK cells.
(A) Cytolytic activity of sorted NKG2A/CCD8+ T cells, NKG2A/C+CD8+ T cells, or NK cells from 3 RhCMV+ rhesus macaques against Calcein AM-stained K562 at an E/T ratio of 5:1. (B) Resting PBMCs from 13 RhCMV+ rhesus macaques were incubated for 6 hours alone or with K562. IFN-γ and TNF-α expression were analyzed after gating on NKG2A/CCD8+ T cells, NKG2A/C+CD8+ T cells, or NK cells. Wilcoxon signed-rank tests were used to compare IFN-γ and TNF-α values. (C) Longitudinal representation of the percentage and absolute numbers of NKG2A/C+CD8+ T cells among lymphocytes before and after vaccination of 14 RhCMV rhesus macaques. Changes in numbers of NKG2A/C+CD8+ T cells with vaccination time were evaluated with Friedman tests. (D) Left: Representative FACS plots demonstrating viral outgrowth inhibition (assessed by intracellular Gag p27) observed when autologous, infected CD4+ T cells are cultured alone or in the presence of sorted NKG2A/CCD8+ T cells, NKG2A/C+CD8+ T cells, or NK cells at an E/T ratio of 1:1. Right: Percentage of viral inhibition. The assay was performed with spleen cells and PBMCs from necropsies, box plots show the median value, 25th and 75th quartiles, and the range of values, n = 3.

Similar articles

Cited by

References

    1. Santos Rocha C, et al. Subclinical cytomegalovirus infection is associated with altered host immunity, gut microbiota, and vaccine responses. J Virol. 2018;92(13):e00167-18. - PMC - PubMed
    1. Nakaya HI, et al. Systems analysis of immunity to influenza vaccination across multiple years and in diverse populations reveals shared molecular signatures. Immunity. 2015;43(6):1186–1198. - PMC - PubMed
    1. Brodin P, et al. Variation in the human immune system is largely driven by non-heritable influences. Cell. 2015;160(1-2):37–47. - PMC - PubMed
    1. Ardeshir A, et al. Breast-fed and bottle-fed infant rhesus macaques develop distinct gut microbiotas and immune systems. Sci Transl Med. 2014;6(252):252ra120. - PMC - PubMed
    1. Narayan NR, et al. Persistent effects of early infant diet and associated microbiota on the juvenile immune system. Gut Microbes. 2015;6(4):284–289. - PMC - PubMed

Publication types