. 2021 Jun 21;17(6):e1008364.
doi: 10.1371/journal.pcbi.1008364. eCollection 2021 Jun.

pyTFM: A tool for traction force and monolayer stress microscopy

Affiliations

pyTFM: A tool for traction force and monolayer stress microscopy

Andreas Bauer et al. PLoS Comput Biol. .

Abstract

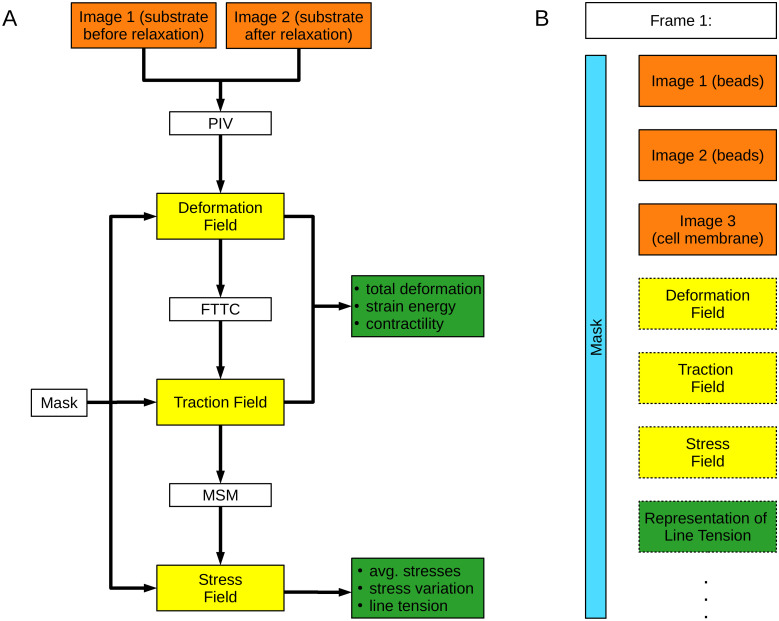
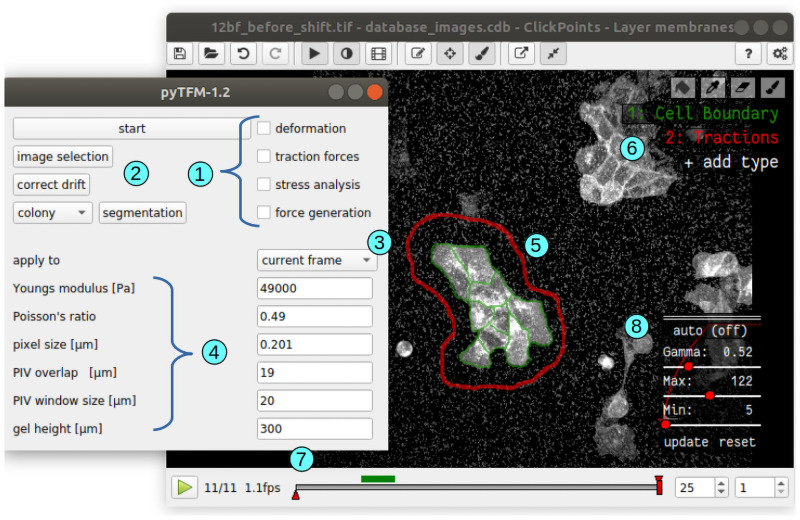
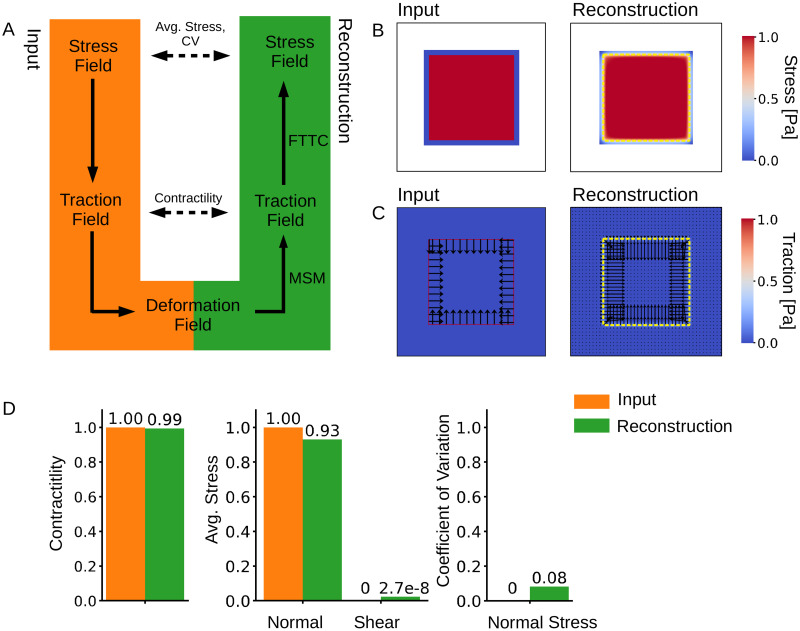
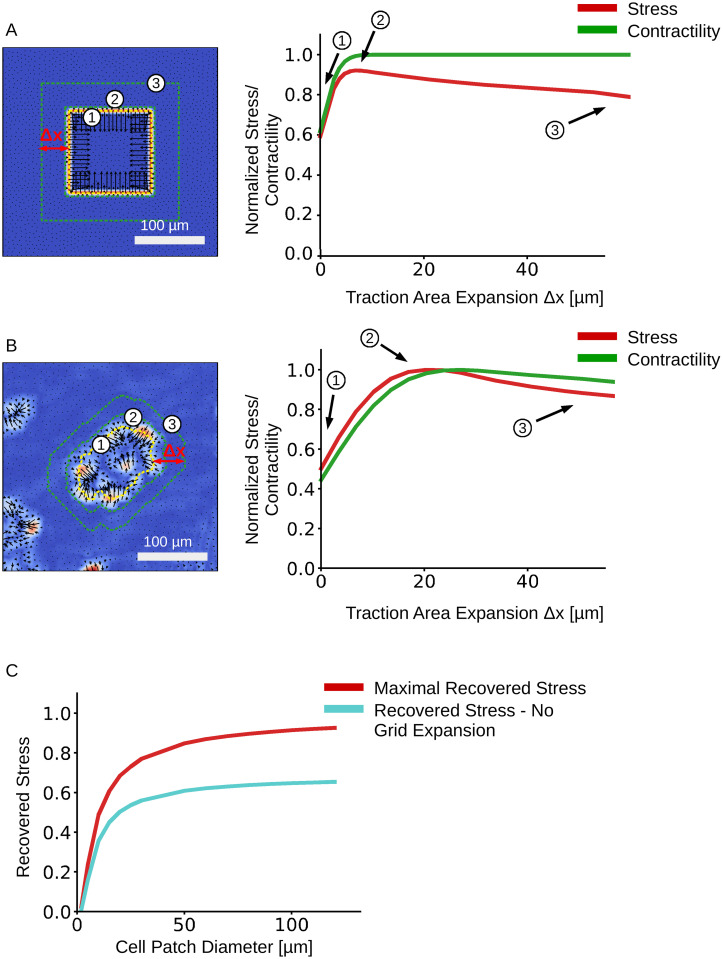
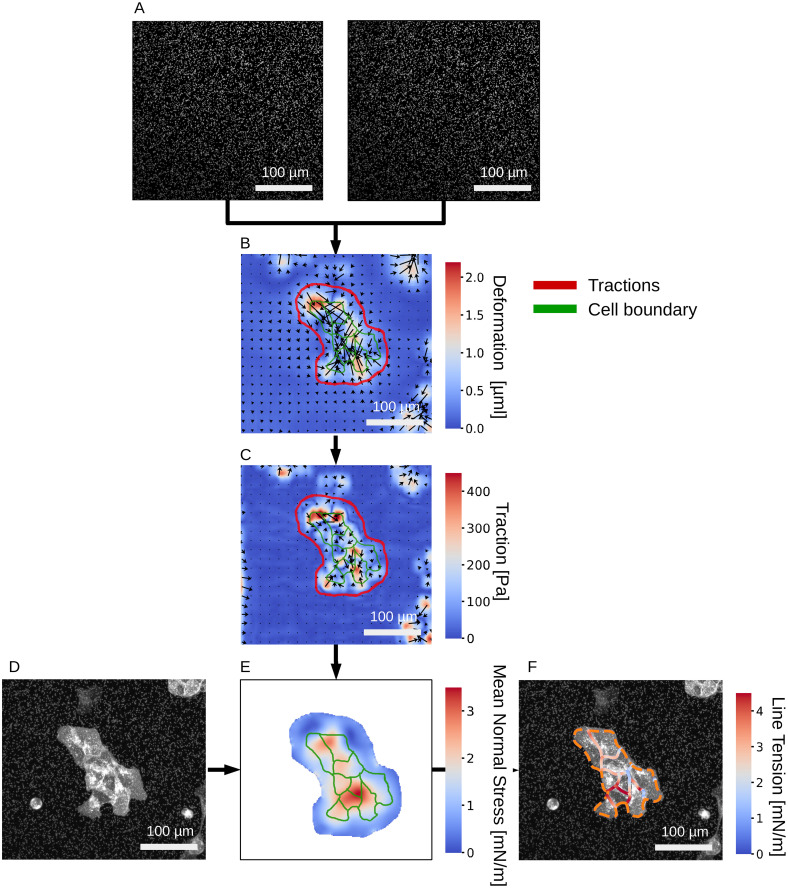
Cellular force generation and force transmission are of fundamental importance for numerous biological processes and can be studied with the methods of Traction Force Microscopy (TFM) and Monolayer Stress Microscopy. Traction Force Microscopy and Monolayer Stress Microscopy solve the inverse problem of reconstructing cell-matrix tractions and inter- and intra-cellular stresses from the measured cell force-induced deformations of an adhesive substrate with known elasticity. Although several laboratories have developed software for Traction Force Microscopy and Monolayer Stress Microscopy computations, there is currently no software package available that allows non-expert users to perform a full evaluation of such experiments. Here we present pyTFM, a tool to perform Traction Force Microscopy and Monolayer Stress Microscopy on cell patches and cell layers grown in a 2-dimensional environment. pyTFM was optimized for ease-of-use; it is open-source and well documented (hosted at https://pytfm.readthedocs.io/) including usage examples and explanations of the theoretical background. pyTFM can be used as a standalone Python package or as an add-on to the image annotation tool ClickPoints. In combination with the ClickPoints environment, pyTFM allows the user to set all necessary analysis parameters, select regions of interest, examine the input data and intermediary results, and calculate a wide range of parameters describing forces, stresses, and their distribution. In this work, we also thoroughly analyze the accuracy and performance of the Traction Force Microscopy and Monolayer Stress Microscopy algorithms of pyTFM using synthetic and experimental data from epithelial cell patches.


Conflict of interest statement

The authors have declared that no competing interests exist.

Figures

Fig 1
Fig 1. Workflow of pyTFM and image database organization.
A: Workflow of TFM and Monolayer Stress Microscopy analysis with pyTFM. B: Organization of the pyTFM ClickPoints database. Input images are colored in orange, intermediary results in yellow, and the final output in the form of scalar measures in green. The mask that defines the cell boundaries and the area over which strain energy, contractility and monolayer stresses are computed is colored light blue.
Fig 2
Fig 2. User interface of pyTFM.
1: Check boxes to select specific analysis steps. 2: Selection of input images, drift correction and semi automatic segmentation of cell borders. 3: Drop-down menu to select between analysing all frames in a database or analysing only the currently viewed frame. 4: Parameters for PIV and TFM. 5: User-selected region (red outline) and cell boundaries (green) for computing tractions, stresses, contractility, strain energy and line tensions. 6: ClickPoints tools to select the region and the cell boundaries by drawing masks. 7: ClickPoints navigation bar through frames. Layers are navigated with the Page Up and Page Down keys, and frames are navigated with the left and right arrow keys. 8: ClickPoints panel to adjust contrast and brightness of the image display. This is helpful for manually segmenting cell borders.
Fig 3
Fig 3. Accuracy of stress and traction force calculation.
A: We model a cell colony as a uniformly distributed square-shaped stress field for which we analytically compute a traction field and subsequently a deformation field. We use the deformation field as the input for Traction Force Microscopy and Monolayer Stress Microscopy to recover the traction and the stress fields. B: Input and reconstructed traction field. C: Input and reconstructed stress field. The yellow dashed line shows the extent of the original stress field. D: Contractility and average normal and shear stress and CV for the mean normal stress in the input and reconstructed traction and stress fields. The contractility is computed over an area that is 12 μm larger than the original stress field. Average normal and shear stresses and the CV of the mean normal stress are computed over the area of the original stress field.
Fig 4
Fig 4. Effect of increasing the traction area on stress and contractility recovery.
The predicted traction fields of a synthetic test system (A) and an MDCK cell patch (B). The outlines of 3 representative FEM-grids are shown on the left. The relationship between average normal stress and FEM-grid area is shown on the right. C: Influence of the cell patch size of a synthetic data set on the maximally recovered mean normal stress with FEM-grid expansion (red), and the recovered mean normal stress without FEM-grid expansion (turquoise).
Fig 5
Fig 5. Analysis of stress and force generation of a MDCK cell colony.
A: Images of substrate-embedded fluorescent beads before and after the cells are detached by trypsinization. B: Substrate deformation field. C: Traction field. The user selects the area (red outline) over which contractility, strain energy and cell stresses are subsequently calculated. D: Image of the cell colony; fluorescent membrane staining with tdTomato-Farnesyl. E: Absolute value of the Mean normal stress in the cell colony. F: Line tension along cell-cell borders. The orange dashed line marks the outer edge of the cell colony.

References

    1. Pelham RJ, Wang Yl. Cell locomotion and focal adhesions are regulated by substrate flexibility. Proceedings of the National Academy of Sciences. 1997;94(25):13661–13665. doi: 10.1073/pnas.94.25.13661 - DOI - PMC - PubMed
    1. Engler AJ, Sen S, Sweeney HL, Discher DE. Matrix Elasticity Directs Stem Cell Lineage Specification. Cell. 2006;126(4):677–689. doi: 10.1016/j.cell.2006.06.044 - DOI - PubMed
    1. Steinwachs J, Metzner C, Skodzek K, Lang N, Thievessen I, Mark C, et al.. Three-dimensional force microscopy of cells in biopolymer networks. Nature Methods. 2015;13(2):171–176. doi: 10.1038/nmeth.3685 - DOI - PubMed
    1. REHFELDT F, ENGLER A, ECKHARDT A, AHMED F, DISCHER D. Cell responses to the mechanochemical microenvironment Implications for regenerative medicine and drug delivery. Advanced Drug Delivery Reviews. 2007;59(13):1329–1339. doi: 10.1016/j.addr.2007.08.007 - DOI - PMC - PubMed
    1. Pascalis CD, Pérez-González C, Seetharaman S, Boëda B, Vianay B, Burute M, et al.. Intermediate filaments control collective migration by restricting traction forces and sustaining cell–cell contacts. Journal of Cell Biology. 2018;217(9):3031–3044. doi: 10.1083/jcb.201801162 - DOI - PMC - PubMed

Publication types