Comparative Study
. 2021 Oct 1:239:118286.
doi: 10.1016/j.neuroimage.2021.118286. Epub 2021 Jun 18.

Heritable functional architecture in human visual cortex

Affiliations
Comparative Study

Heritable functional architecture in human visual cortex

Ivan Alvarez et al. Neuroimage. .

Abstract

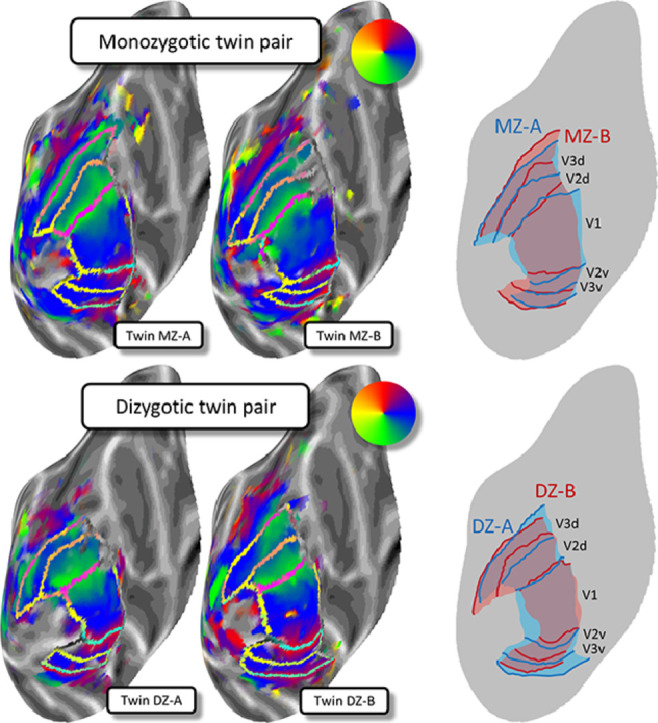
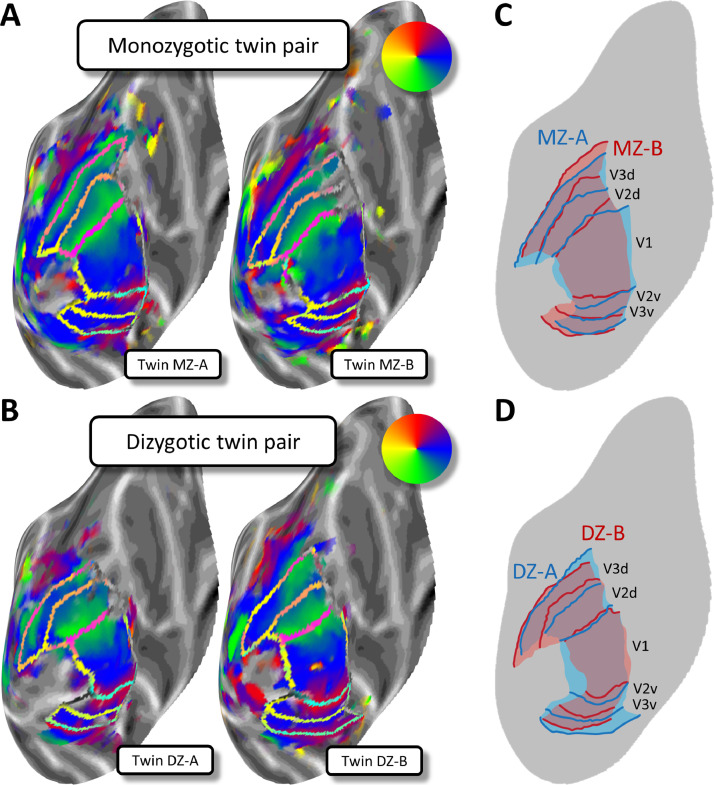
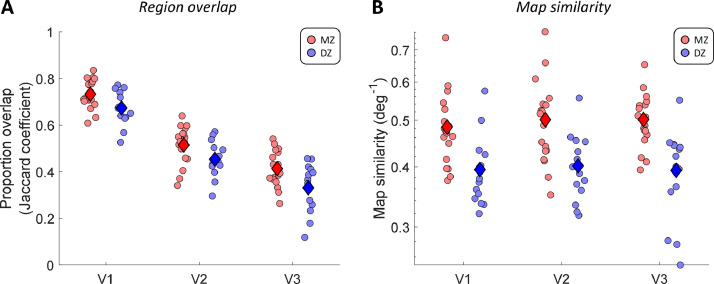
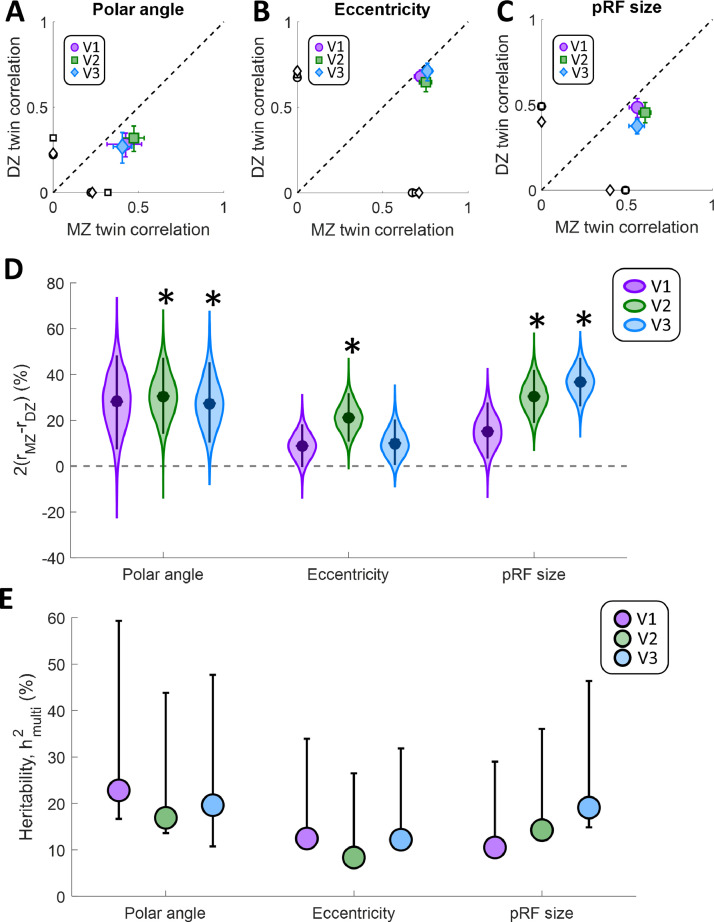
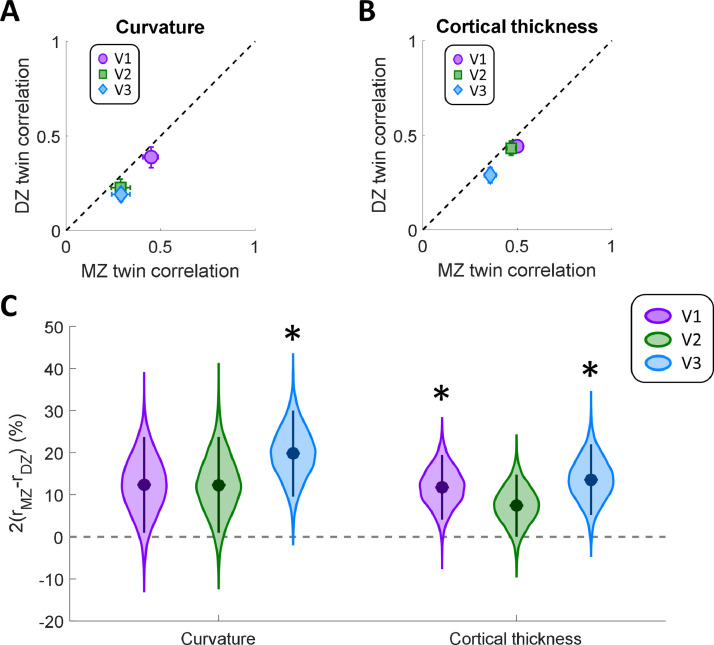
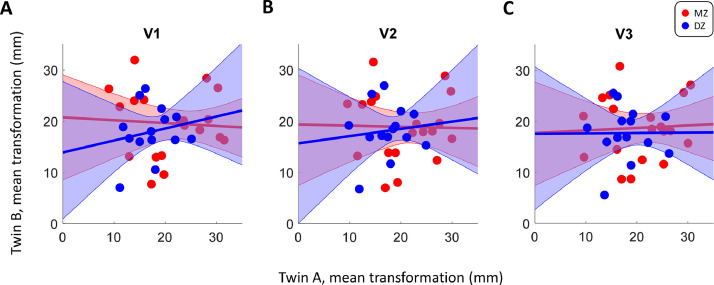
How much of the functional organization of our visual system is inherited? Here we tested the heritability of retinotopic maps in human visual cortex using functional magnetic resonance imaging. We demonstrate that retinotopic organization shows a closer correspondence in monozygotic (MZ) compared to dizygotic (DZ) twin pairs, suggesting a partial genetic determination. Using population receptive field (pRF) analysis to examine the preferred spatial location and selectivity of these neuronal populations, we estimate a heritability around 10-20% for polar angle preferences and spatial selectivity, as quantified by pRF size, in extrastriate areas V2 and V3. Our findings are consistent with heritability in both the macroscopic arrangement of visual regions and stimulus tuning properties of visual cortex. This could constitute a neural substrate for variations in a range of perceptual effects, which themselves have been found to be at least partially genetically determined. These findings also add convergent evidence for the hypothesis that functional map topology is linked with cortical morphology.

Keywords: Heritability; Population receptive fields; Retinotopic mapping; Twin study; Visual cortex; Visual processing.


Figures

Image, graphical abstract
Graphical abstract
Fig. 1
Fig. 1
A,B. Retinotopic polar angle maps for an identical MZ (A) and a non-identical DZ twin pair (B). Polar angle maps are shown on an inflated model of the cortical surface for the left occipital lobe. Cortical surfaces were normalized by aligning them to a common template. Each plot shows data from one individual. Greyscale indicates the cortical curvature, with darker patches corresponding to sulci, and lighter patches corresponding to gyri. The pseudo-color code (see insets) denotes the preferred polar angle in the visual field for a voxel at a given cortical location, as derived from population receptive field (pRF) analysis. The transparent borders show transition boundaries for visual areas V1, V2 and V3. C-D. Schematic retinotopic maps with the borders for both twins in the MZ (C) and DZ (D) twin pairs overlaid in distinct colors to allow a direct comparison.
Fig. 2
Fig. 2
Proportion of overlap (A) and multivariate map similarity (B) for visual regions V1-V3 between twins in each pair. Each dot denotes the results for one twin pair in each cortical region. Diamonds indicate the group means. Map similarity scores were calculated as the inverse of the Euclidean distance in a multivariate space of pRF parameters (see 2.3.2). Note that map similarity scores are shown on logarithmic scale. Statistical inference was conducted using the logarithm of this score. Red: MZ twins. Blue: DZ twins. (For interpretation of the references to color in this figure legend, the reader is referred to the web version of this article.)
Fig. 3
Fig. 3
Intra-class circular correlations for polar angle (A), and Spearman correlations for eccentricity (B), and pRF size (C). MZ twin pair correlations are plotted against those for DZ twins. The dashed line is the identity line. Error bars denote 95% confidence intervals derived through 10,000 bootstrap samples. The black symbols on the x- and y-axes denote the average correlation between unrelated participants across the whole sample. D. Correlation difference estimates for population receptive field parameters in each visual region. Data are shown for polar angle, eccentricity, and pRF size parameters, as derived from pRF analysis. Filled circles indicate the group means. The violin plot shows the bootstrap distribution for each pRF property and visual region, and the error bars denote 95% confidence intervals. Asterisks indicate significant differences at p < 0.05, after Bonferroni correction for multiple comparisons. E. Multidimensional heritability estimates for the same pRF parameters. Symbols indicate the observed heritability, error bars denote the 95% confidence interval from bootstrapping.
Fig. 4
Fig. 4
Intra-class Spearman correlations for cortical curvature (A), and thickness (B). MZ twin pair correlations are plotted against those for DZ twins. The dashed line is the identity line. Error bars denote 95% confidence intervals derived through 10,000 bootstrap samples. C. Correlation difference estimates for these anatomical parameters in each visual region. Data are shown for cortical curvature and thickness, as derived from surface reconstruction in FreeSurfer. Filled circles indicate the group means. The violin plot shows the bootstrap distribution for each pRF property and visual region, and the error bars denote 95% confidence intervals. Asterisks indicate significant differences at p < 0.05, after Bonferroni correction for multiple comparisons.
Fig. 5
Fig. 5
Comparison of the mean spatial transformation needed to align native brains to the template brain, separately for V1 (A), V2 (B), and V3 (C). Each dot denotes for a given twin pair the mean Euclidean distance between native vertices in a region and their location after cortical alignment. The solid lines denote the best fitting linear regression and the shaded regions shows the 95% confidence interval. Red: MZ. Blue: DZ. (For interpretation of the references to color in this figure legend, the reader is referred to the web version of this article.)

References

    1. Alvarez I., De Haas B.A., Clark C.A., Rees G., Schwarzkopf D.S. Comparing different stimulus configurations for population receptive field mapping in human fMRI. Front. Hum. Neurosci. 2015;9:96. doi: 10.3389/fnhum.2015.00096. - DOI - PMC - PubMed
    1. Anderson K.M., Ge T., Kong R., Patrick L.M., Spreng R.N., Sabuncu M.R., Yeo B.T.T., Holmes A.J. Heritability of individualized cortical network topography. Proc. Natl. Acad. Sci. U. S. A. 2021;118 doi: 10.1073/pnas.2016271118. - DOI - PMC - PubMed
    1. Benson N.C., Butt O.H., Datta R., Radoeva P.D., Brainard D.H., Aguirre G.K. The retinotopic organization of striate cortex is well predicted by surface topology. Curr. Biol. 2012 doi: 10.1016/j.cub.2012.09.014. CB. - DOI - PMC - PubMed
    1. Bergmann J., Genç E., Kohler A., Singer W., Pearson J. Smaller primary visual cortex is associated with stronger, but less precise mental imagery. Cereb. Cortex. 2015;186 doi: 10.1093/cercor/bhv186. bhv. - DOI - PubMed
    1. Bergmann J., Genç E., Kohler A., Singer W., Pearson J. Neural anatomy of primary visual cortex limits visual working memory. Cereb. Cortex. 2014 doi: 10.1093/cercor/bhu168. N. Y. N 1991. - DOI - PubMed