. 2021 Jun 21;40(1):201.
doi: 10.1186/s13046-021-02008-3.

USP1-dependent RPS16 protein stability drives growth and metastasis of human hepatocellular carcinoma cells

Affiliations

USP1-dependent RPS16 protein stability drives growth and metastasis of human hepatocellular carcinoma cells

Yuning Liao et al. J Exp Clin Cancer Res. .

Abstract

Background: Hepatocellular carcinoma (HCC) remains a medical challenge due to its high proliferation and metastasis. Although deubiquitinating enzymes (DUBs) play a key role in regulating protein degradation, their pathological roles in HCC have not been fully elucidated.

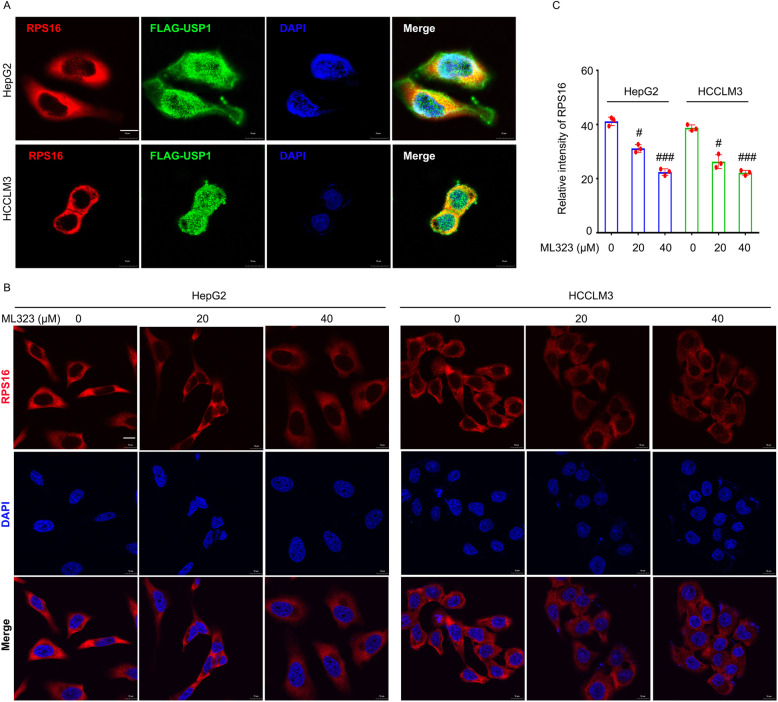
Methods: By using biomass spectrometry, co-immunoprecipitation, western blotting and immunofluorescence assays, we identify ribosomal protein S16 (RPS16) as a key substrate of ubiquitin-specific peptidase 1 (USP1). The role of USP1-RPS16 axis in the progression of HCC was evaluated in cell cultures, in xenograft mouse models, and in clinical observations.

Results: We show that USP1 interacts with RPS16. The depletion of USP1 increases the level of K48-linked ubiquitinated-RPS16, leading to proteasome-dependent RPS16 degradation. In contrast, overexpression of USP1-WT instead of USP1-C90A (DUB inactivation mutant) reduces the level of K48-linked ubiquitinated RPS16, thereby stabilizing RPS16. Consequently, USP1 depletion mimics RPS16 deficiency with respect to the inhibition of growth and metastasis, whereas transfection-enforced re-expression of RPS16 restores oncogenic-like activity in USP1-deficient HCC cells. Importantly, the high expression of USP1 and RPS16 in liver tissue is a prognostic factor for poor survival of HCC patients.

Conclusions: These findings reveal a previously unrecognized role for the activation of USP1-RPS16 pathway in driving HCC, which may be further developed as a novel strategy for cancer treatment.

Keywords: Degradation; Hepatocellular carcinoma; RPS16; USP1.


Conflict of interest statement

The authors declare no conflicts of interest.

Figures

Fig. 1
Fig. 1
USP1 interacts with and regulates RPS16. a Endogenous USP1 was immunoprecipitated from HepG2 cells. The USP1-interacting proteins were separated by SDS-PAGE and were presented by silver staining assay. b Biological process analysis of the USP1-interacting proteins was performed. The numbers of regulated genes in pathway categories are shown. c Representative USP1-interacting proteins are shown in the table. d USP1 was immunoprecipitated from HepG2 cells and immunoblotted to RPS4X, RPS18, and RPS16. e HepG2 cells were treated with USP1 siRNAs or control siRNAs for 48 h. The expression levels of USP1, RPS4X, RPS18, and RPS16 were determined by western blot. GAPDH was used as a loading control. f HepG2 cells were treated with indicating doses of ML323 for 24 h. The expression levels of RPS4X, RPS18, and RPS16 were determined by western blot. g HepG2 cells were treated with bortezomib (BTZ, 50nM) for 24 h. Western blot was performed to determine the expression level of RPS16. h Linear structure models of wide type USP1 (USP1-WT) and its truncated mutants (USP1-TMs). i HEK293T cells were transfected with HA-RPS16 and FLAG-USP1-WT or FLAG-USP1-TMs. FLAG was immunoprecipitated from HEK293T cells and immunoblotted to HA and FLAG
Fig. 2
Fig. 2
Morphological evidence of the interaction between USP1 and RPS16. a HepG2 and HCCLM3 cells were transfected with FLAG-USP1 plasmids for 48 h. Cell immunofluorescence assay was performed using FLAG-tag and RPS16 antibodies. b HepG2 and HCCLM3 cells were exposed to ML323 for 24 h. Cell immunofluorescence assay was performed using RPS16 antibodies. Representative images are shown. Scale bars, 10 μm. c Quantification of immunofluorescence assay in HCC cells
Fig. 3
Fig. 3
USP1 deubiquitinates and stabilizes RPS16. a HepG2 cells were exposed to ML323 in the absence or presence of BTZ (50 nM) for 24 h. The expression level of RPS16 was determined by western blot. b Quantification of the bands are shown. c HepG2 and HCCLM3 cells were exposed to cycloheximide (CHX, 50 µg/ml) for indicated time with or without the pretreatment of ML323 (for 24 h). The expression level of RPS16 was determined by western blot. d Quantification of the bands are shown. e HepG2 and HCCLM3 cells were exposed to CHX for indicated time with or without the pretreatment of USP1 siRNAs (for 48 h). The expression level of RPS16 was determined by western blot. (f) Quantification of the bands are shown. g RPS16 was immunoprecipitated from HepG2 cells stably expressing USP1 shRNAs or control shRNAs and immunoblotted to K48-linked ubiquitin and RPS16. MG132 (10 µM) was used to treat HepG2 cells for 6 h before harvest. h RPS16 was immunoprecipitated from HepG2 cells transfected with FLAG-USP1-WT, FLAG-USP1-C90A, or control plasmids, and immunoblotted to K48-linked ubiquitin and RPS16
Fig. 4
Fig. 4
Inhibition of USP1 reduces proliferation of HCC cells. a HepG2, HCCLM3, Hep3B, and Huh7 cells were exposed to ML323 for 48 h. Cell viability was determined by MTS assay from three independent repeats. b The indicated HCC cells were treated with USP1 siRNAs or control siRNAs for 72 h. Cell viability was determined by MTS assay from three independent repeats. c The knockdown efficiency of USP1 was determined by western blot. d HepG2 and HCCLM3 cells were treated with ML323 or USP1 siRNAs for 48 h. DNA duplicate was determined by EdU staining assay. Representative images are shown. Scale bars, 50 μm. and f Relative intensities of the images were calculated and quantified from three independent repeats. g HepG2 and HCCLM3 cells were treated with ML323 for 48 h. Colony formation assay was performed for 2 weeks. h Colony formation rate was calculated and quantified from three independent repeats
Fig. 5
Fig. 5
Inhibition of USP1 suppresses migration of HCC cells. a and b Transwell migration assay was performed in HepG2 and HCCLM3 cells treated with ML323, and cells stably expressing USP1 shRNAs or control shRNAs for 72 h. Representative images are shown. Scale bars, 50 μm. c and d Cell migration rate was calculated and quantified from three independent repeats. and f Western blotting analysis was performed in HepG2 and HCCLM3 cells exposed to ML323 for 48 h, and HCC cells stably expressing USP1 shRNAs or control shRNAs using indicated antibodies. Relative intensities of the bands are shown
Fig. 6
Fig. 6
USP1-promoted cell migration depends on RPS16 status. HepG2 and HCCLM3 cells were treated with RPS16 siRNAs or control siRNAs for 72 h. a Cell viability was determined by MTS assay. b DNA duplicate was determined by EdU staining assay. c and d Cell migration rate was determined by transwell migration assay. Representative images and quantitative data are shown. e Expressions of RPS16, Twist1 and Snail were determined by western blotting. f-i HepG2 and HCCLM3 cells were treated with ML323 in the absence or presence of HA-RPS16 for 72 h, or HepG2 and HCCLM3 cells stably expressing USP1 shRNAs or control shRNAs with or without the transfection of HA-RPS16 for 72 h. f Cell migration was determined by transwell assays. Representative images were shown. Scale bar, 50 μm. g Quantification of the percentage transwell/migrated cells was shown. h and i The protein levels of RPS16, Twist1, Snail, and HA were determined by western blotting analysis
Fig. 7
Fig. 7
Knockdown of USP1 reduces growth of HCC in vivo. HepG2 cells stably expressing USP1 shRNAs or control shRNAs were transplanted in nude mice for 27 days. a Images of HepG2 xenografts in each group are shown. b Tumor weight, c Tumor size, and d body weight of nude mice is shown. e Expressions of RPS16 and Ki67 in tumor tissues were determined by immunohistochemistry assay. Scale bar, 50 μm. f Relative intensities of RPS16 and Ki67 were calculated and quantified using an Image J software
Fig. 8
Fig. 8
Clinical relationship between USP1 and RPS16. a and b Expressions of USP1 and RPS16 at mRNA level in HCC in comparison with normal tissues from the TCGA database. c Kaplan-Meier curves from patients with HCC expressing low and high USP1 from the TCGA database. d Immunohistochemistry assay was performed in HCC and normal adjacent tissue microarray (n = 90). Representative images of USP1 and RPS16 are shown. e Quantification of the USP1 and RPS16 expression in tissues. f The correlation of USP1 and RPS16 protein levels in human HCC. g Kaplan-Meier curves from patients with HCC expressing low and high USP1/RPS16 from the tissue microarray. h Graphical summary of USP1-regulated proliferation and metastasis of HCC

References

    1. Bray F, Ferlay J, Soerjomataram I, Siegel RL, Torre LA, Jemal A. Global cancer statistics 2018: GLOBOCAN estimates of incidence and mortality worldwide for 36 cancers in 185 countries. CA Cancer J Clin. 2018;68:394–424. doi: 10.3322/caac.21492. - DOI - PubMed
    1. Finn RS, Zhu AX, Farah W, Almasri J, Zaiem F, Prokop LJ, Murad MH, Mohammed K. Therapies for advanced stage hepatocellular carcinoma with macrovascular invasion or metastatic disease: A systematic review and meta-analysis. Hepatology. 2018;67:422–35. doi: 10.1002/hep.29486. - DOI - PubMed
    1. Forner A, Reig M, Bruix J. Hepatocellular carcinoma. Lancet. 2018;391:1301–14. doi: 10.1016/S0140-6736(18)30010-2. - DOI - PubMed
    1. Krishnan MS, Rajan Kd A, Park J, Arjunan V, Garcia Marques FJ, Bermudez A, Girvan OA, Hoang NS, Yin J, Nguyen MH, et al. Genomic analysis of Vascular Invasion in Hepatocellular Carcinoma (HCC) Reveals Molecular Drivers and Predictive Biomarkers. Hepatology. 2020 doi: 10.1002/hep.31614. - DOI - PMC - PubMed
    1. El-Khoueiry AB, Sangro B, Yau T, Crocenzi TS, Kudo M, Hsu C, Kim TY, Choo SP, Trojan J, Welling THR, et al. Nivolumab in patients with advanced hepatocellular carcinoma (CheckMate 040): an open-label, non-comparative, phase 1/2 dose escalation and expansion trial. Lancet. 2017;389:2492–502. doi: 10.1016/S0140-6736(17)31046-2. - DOI - PMC - PubMed