. 2021 Dec 1;11(12):3028-3047.
doi: 10.1158/2159-8290.CD-20-1863.

Multiomic Analysis of Lung Tumors Defines Pathways Activated in Neuroendocrine Transformation

Affiliations

Multiomic Analysis of Lung Tumors Defines Pathways Activated in Neuroendocrine Transformation

Alvaro Quintanal-Villalonga et al. Cancer Discov. .

Abstract

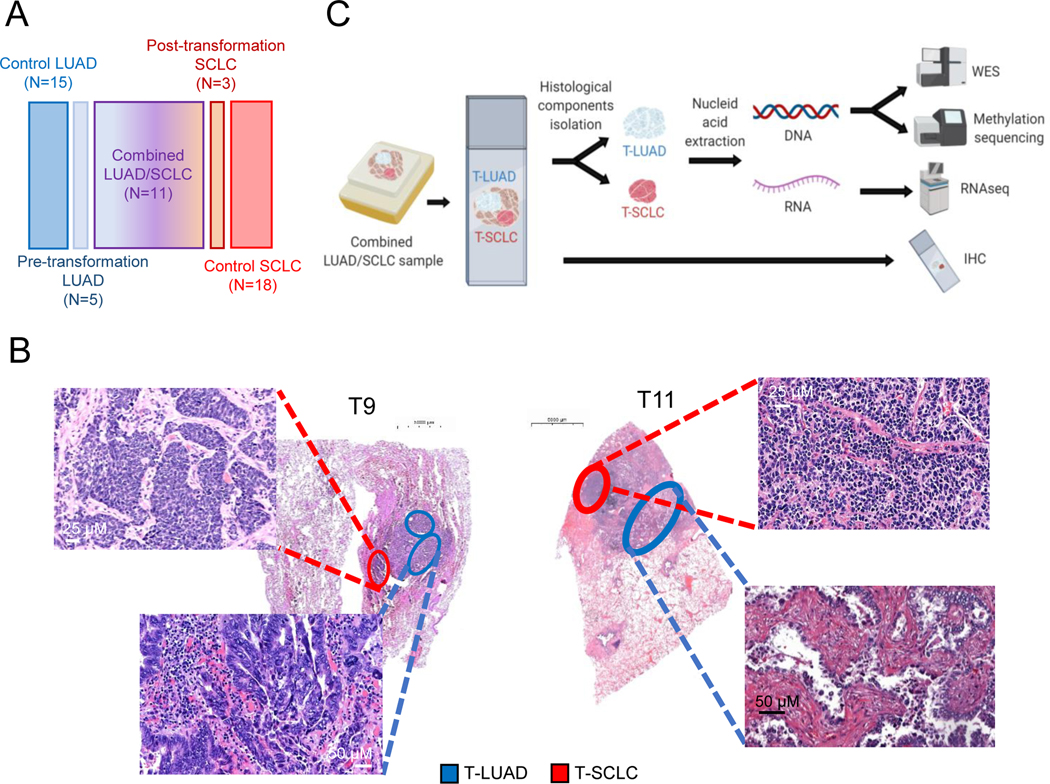
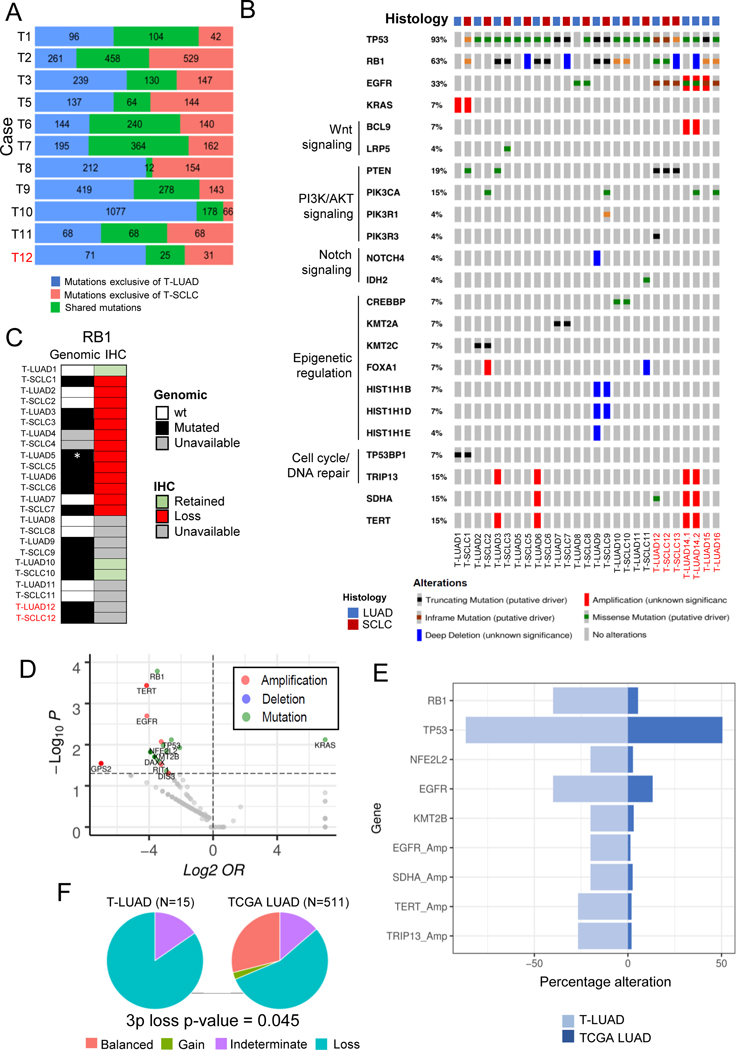
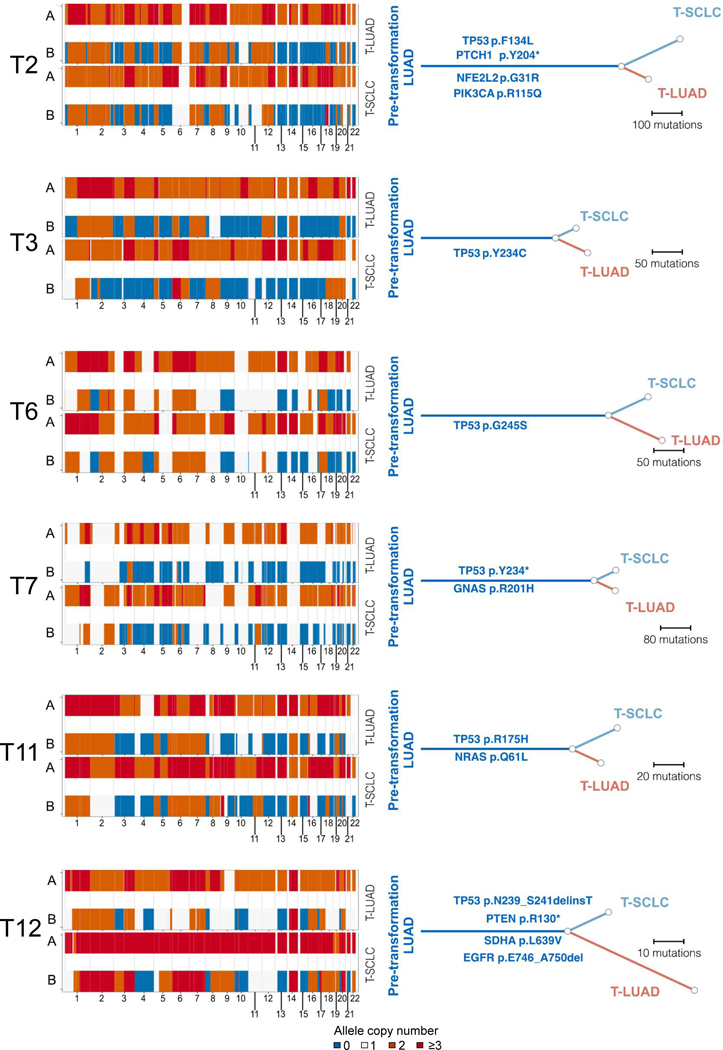
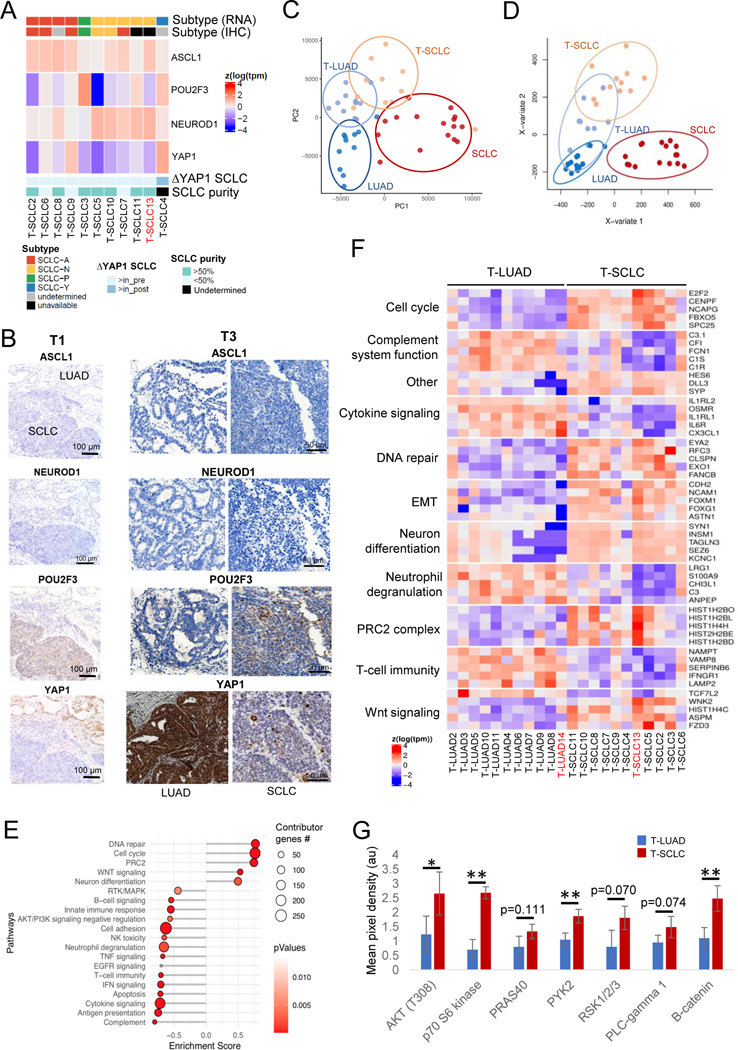
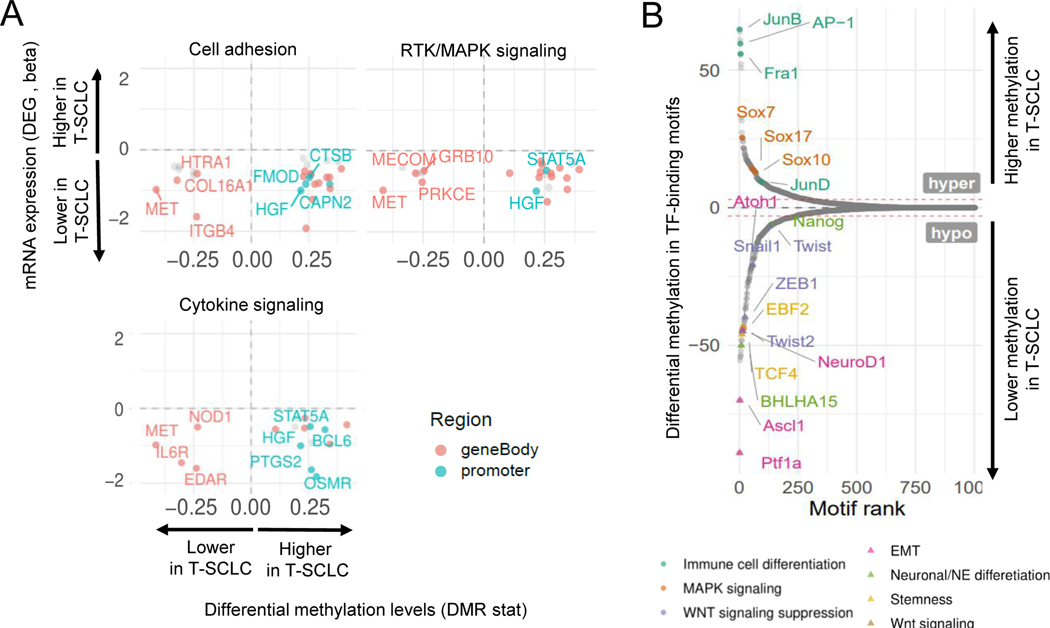
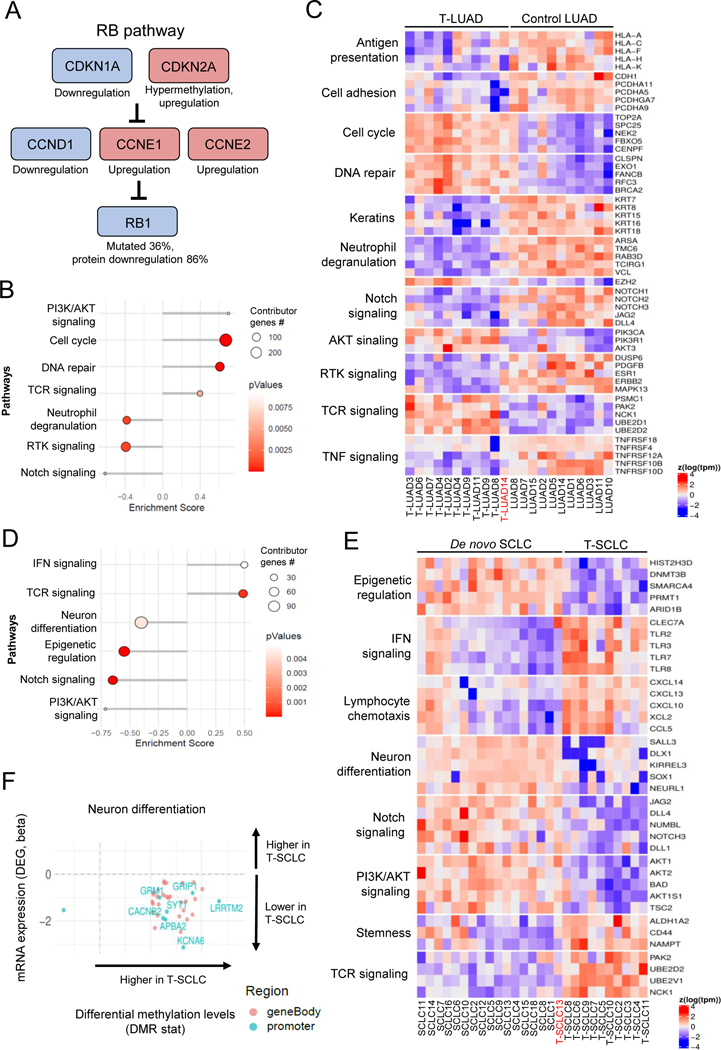
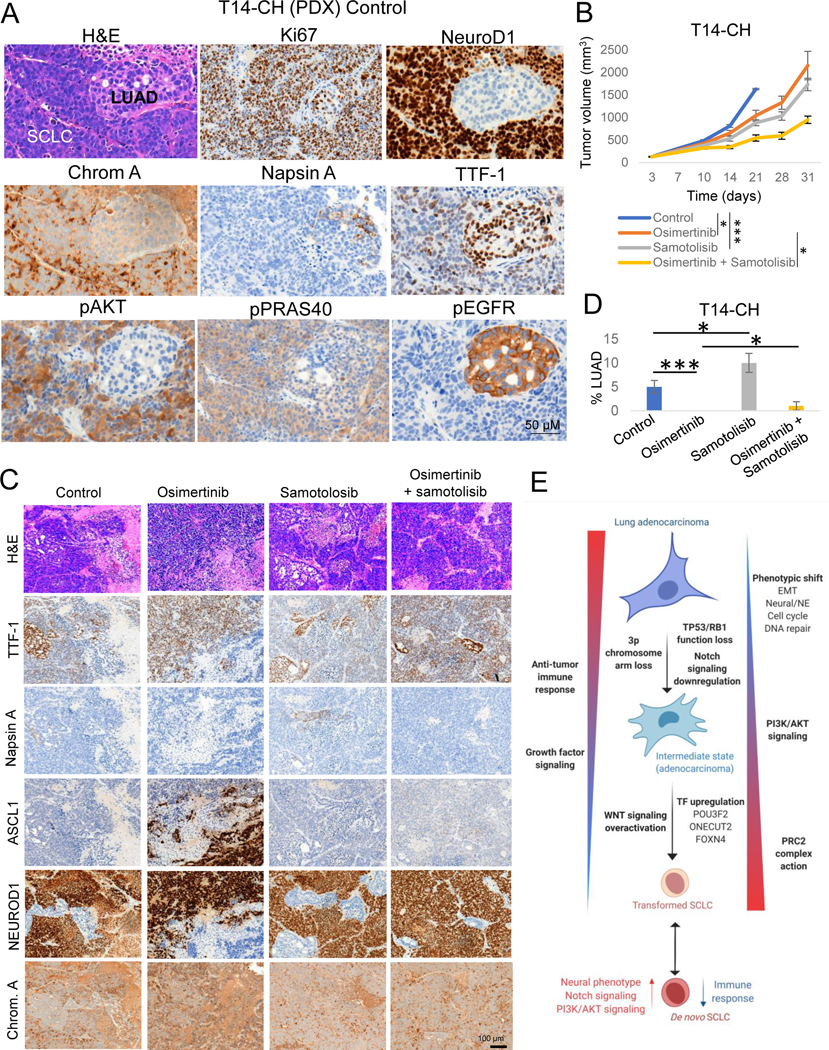
Lineage plasticity is implicated in treatment resistance in multiple cancers. In lung adenocarcinomas (LUAD) amenable to targeted therapy, transformation to small cell lung cancer (SCLC) is a recognized resistance mechanism. Defining molecular mechanisms of neuroendocrine (NE) transformation in lung cancer has been limited by a paucity of pre/posttransformation clinical samples. Detailed genomic, epigenomic, transcriptomic, and protein characterization of combined LUAD/SCLC tumors, as well as pre/posttransformation samples, supports that NE transformation is primarily driven by transcriptional reprogramming rather than mutational events. We identify genomic contexts in which NE transformation is favored, including frequent loss of the 3p chromosome arm. We observed enhanced expression of genes involved in the PRC2 complex and PI3K/AKT and NOTCH pathways. Pharmacologic inhibition of the PI3K/AKT pathway delayed tumor growth and NE transformation in an EGFR-mutant patient-derived xenograft model. Our findings define a novel landscape of potential drivers and therapeutic vulnerabilities of NE transformation in lung cancer.

Significance: The difficulty in collection of transformation samples has precluded the performance of molecular analyses, and thus little is known about the lineage plasticity mechanisms leading to LUAD-to-SCLC transformation. Here, we describe biological pathways dysregulated upon transformation and identify potential predictors and potential therapeutic vulnerabilities of NE transformation in the lung. See related commentary by Meador and Lovly, p. 2962. This article is highlighted in the In This Issue feature, p. 2945.


Conflict of interest statement

CONFLICT OF INTEREST

CAID receives research support from Bristol Myers Squibb.

CMR has consulted regarding oncology drug development with AbbVie, Amgen, Ascentage, Astra Zeneca, Bicycle, Celgene, Daiichi Sankyo, Genentech/Roche, Ipsen, Jazz, Lilly, Pfizer, PharmaMar, Syros, and Vavotek. CMR serves on the scientific advisory boards of Bridge Medicines, Earli, and Harpoon Therapeutics.

Figures

Figure 1.
Figure 1.. Multilayer molecular characterization of SCLC transformation.
Related to Supplementary Figure S1. (A) Schematic composition of the cohort under study. (B) Illustrative H&E images of two of our combined histology samples, showing spatial separation of both independently isolated histologic components. (C) Schema of processing of combined histology samples for molecular analyses.
Figure 2.
Figure 2.. Genomic characterization of SCLC transformation.
Related to Supplementary Figures S2–3. (A) Bar plot showing number of exonic mutations occurring specifically in the T-LUAD and T-SCLC components, and of mutations shared between these. (B) Oncoprint showing the most prevalent likely driver/non-VUS mutations and CNAs in the transformation samples, grouped by recurrent pathways. (C) Heatmap showing complementary genomic and immunohistochemical characterization of RB1 alterations. (D) Volcano plot showing enrichment of mutations/CNAs in T-LUAD versus TCGA LUAD cohort. (E) Bar plot showing prevalence (%) of mutations/CNA enriched in T-LUAD versus TCGA LUAD with over 25% prevalence in our cohort. (F) Pie charts showing the abundance of 3p chromosome arm lost in our T-LUAD cases versus TCGA LUAD. p-value for enrichment in 3p loss was calculated using the Fisher’s exact test for count data. Samples IDs in black and red indicate that they come from a combined histology specimen or a pre-/post-transformation specimen, respectively. Cohort sizes for these analyses were N=15 for T-LUAD and N=515 for LUAD TCGA (mutations) or N=511 for LUAD TCGA (CNAs).
Figure 3.
Figure 3.. Genomic mutation evolution of SCLC transformation.
Chromosomal gain/losses (at a segment level) in both alleles for matched LUAD and SCLC components for each case (left) and reconstruction of clonal evolution (right) in 4 combined histology and 1 pair of pre- and post-transformation cases. All oncogenic and hotspot mutations are annotated along their respective branch. Samples IDs in black and red indicate that they come from a combined histology specimen or a pre-/post-transformation specimen, respectively.
Figure 4.
Figure 4.. Transcriptomic, epigenomic and protein characterization of SCLC transformation.
Related to Supplementary Figures S4–5. (A) Heatmap showing mRNA expression of the SCLC subtype-determining TFs, tumor purity, highest TF expressed by IHC in the T-SCLC component and YAP1 mRNA expression in the T-SCLC component relative to their matched T-LUAD component, in the transformation samples. (B) IHC images for subtype-determining TFs in the SCLC-P T-SCLC cases (ch1 and ch3). (C) PCA analysis on the transcriptomes of our pre- and post-transformation samples, and of our control LUAD and de novo SCLC samples. (D) PLSDA analyses on the methylome of our T-LUAD and T-SCLC samples, and of our control LUAD and SCLC samples. (E) Pathway enrichment analyses on the DEGs of the T-LUAD versus T-SCLC comparison. (F) Heatmap highlighting DEGs of interest, grouped by recurrent pathways. (G) Bar plot showing differential phosphorylation of genes involved in the AKT/Wnt signaling pathways, and differential expression of β-catenin, as determined by an antibody array on pre- and post-transformation clinical and PDX samples. Samples IDs in black and red indicate that they come from a combined histology specimen or a pre-/post-transformation specimen, respectively. p-values legend: * p<0.05, **p<0.01.
Figure 5.
Figure 5.. Integrative RNA and methylation analyses of SCLC transformation.
Related to Supplementary Figure S4. (A) Scatter plots showing DEGs exhibiting differential methylation levels in T-LUAD versus control LUAD comparison, grouped by pathways of interest. Significantly differentially expressed (q value < 0.05 and beta >= log2(1.5)) and methylated (FDR < 0.5 and differential methylation level greater than 0.1) sites are highlighted. Those genes where increased gene body or promoter methylation is correlated to expression positively and negatively, respectively, are labeled. (B) Plot exhibiting differentially methylated transcription factor binding domains in T-SCLC versus T-LUAD. Interested TFs in this study are highlighted and labeled.
Figure 6.
Figure 6.. Integrative RNA and methylation analyses of T-LUAD and T-LUSC versus their control counterparts.
Related to Supplementary Figure S6 (A) Alterations in the RB pathway identified in T-LUAD. (B) Pathway enrichment analyses on the DEGs of the T-LUAD versus control LUAD comparison. (C) Heatmap highlighting DEGs of interest, grouped by recurrent pathways, of the T-LUAD versus control LUAD comparison. (D) Pathway enrichment analyses on the DEGs of T-SCLC versus de novo SCLC comparison. (E) Heatmap highlighting DEGs of interest, grouped by recurrent pathways, of T-SCLC versus de novo SCLC comparison. (F) Scatter plots showing DEGs exhibiting differential methylation levels in T-SCLC versus de novo SCLC comparison, grouped by pathways of interest. Significantly differentially expressed (q value < 0.05 and beta >= log2(1.5)) and methylated (FDR < 0.5 and differential methylation level greater than 0.1) sites are highlighted. Those genes where increased gene body or promoter methylation is correlated to expression positively and negatively, respectively, are labeled. Samples IDs in black and red indicate that they come from a combined histology specimen or a pre-/post-transformation specimen, respectively.
Figure 7.
Figure 7.. Potential therapeutic approaches for SCLC transformation.
Related to Supplementary Figure S7. (A) H&E and IHC markers of interest images showing combined LUAD and SCLC histology in the T14-CH PDX. (B) In vivo tumor growth of the combined LUAD/NE EGFR-mutant PDX model T14-CH with the EGFR inhibitor Osimertinib, the AKT inhibitor Samotolisib, or their combination. Group mean tumor size ± SEM is shown. Statistical differences in tumor sizes were assessed by a two-tailed Studentś t-test, using the tumor sizes for day 21 (control group endpoint) for those comparisons involving the control group, and on day 31 (experiment endpoint) for those comparisons involving the Osimertinib-treated group. (C) Representative H&E and IHC stains for the LUAD markers TTF-1 and Napsin A and the NE markers ASCL1, NEUROD1 and Chromogranin A, of tumors in each treatment arm. (D) Percentages of LUAD component per treatment group, showing the median ± standard deviation per group. Statistical differences were assessed by a two-tailed Studentś t-test. Diagnosis of each histological component was performed by a pathologist using morphological criteria and differential staining of LUAD (TTF-1, Napsin A), NE (ASCL1, NEUROD1, Chromogranin A) and other supporting (Ki67, pEGFR) markers. (E) Schematic of molecular and phenotype changes on the different steps of SCLC transformation. Our data suggest that transformation from LUAD to SCLC may be a progressive process involving multiple signaling pathways and phenotypic changes. This process may be initiated by the loss of TP53 and RB1, decreased dependence on RTK signaling and Notch signaling downregulation, and involve progressive activation of AKT and WNT signaling pathways, epigenomic regulation by the PRC2 complex and a number of additional epigenetic enzymes, acquisition of a neuronal and EMT phenotype, and downregulation of genes involved in multiple immune response pathways. Created with BioRender.com.p-values legend: * p<0.05, **p<0.01, ***<0.001.

Comment in

References

    1. Lawson DA, Kessenbrock K, Davis RT, Pervolarakis N, Werb Z. Tumour heterogeneity and metastasis at single-cell resolution. Nat Cell Biol [Internet]. Springer US; 2018;20:1349–60. Available from: 10.1038/s41556-018-0236-7 - DOI - PMC - PubMed
    1. Meacham CE, Morrison SJ. Tumour heterogeneity and cancer cell plasticity. Nature. 2013;501:328–37. - PMC - PubMed
    1. Quintanal-Villalonga Á, Chan JM, Yu HA, Pe’er D, Sawyers CL, Sen T, et al. Lineage plasticity in cancer: a shared pathway of therapeutic resistance. Nat Rev Clin Oncol [Internet]. Springer US; 2020;17:360–71. Available from: 10.1038/s41571-020-0340-z - DOI - PMC - PubMed
    1. Zhang Y, Zheng D, Zhou T, Song H, Hulsurkar M, Su N, et al. Androgen deprivation promotes neuroendocrine differentiation and angiogenesis through CREB-EZH2-TSP1 pathway in prostate cancers. Nat Commun [Internet]. Springer US; 2018;9. Available from: 10.1038/s41467-018-06177-2 - DOI - PMC - PubMed
    1. Miyoshi Y, Uemura H, Kitami K, Satomi Y, Kubota Y, Hosaka M. Neuroendocrine differentiated small cell carcinoma presenting as recurrent prostate cancer after androgen deprivation therapy. BJU Int. 2001;88:982–3. - PubMed

Publication types

MeSH terms