. 2021 Oct;32(10):2501-2516.
doi: 10.1681/ASN.2020081143. Epub 2021 Jun 21.

Single-Nucleus RNA Sequencing Identifies New Classes of Proximal Tubular Epithelial Cells in Kidney Fibrosis

Affiliations

Single-Nucleus RNA Sequencing Identifies New Classes of Proximal Tubular Epithelial Cells in Kidney Fibrosis

Yueh-An Lu et al. J Am Soc Nephrol. 2021 Oct.

Abstract

Background: Proximal tubular cells (PTCs) are the most abundant cell type in the kidney. PTCs are central to normal kidney function and to regeneration versus organ fibrosis following injury. This study used single-nucleus RNA sequencing (snRNAseq) to describe the phenotype of PTCs in renal fibrosis.

Methods: Kidneys were harvested from naïve mice and from mice with renal fibrosis induced by chronic aristolochic acid administration. Nuclei were isolated using Nuclei EZ Lysis buffer. Libraries were prepared on the 10× platform, and snRNAseq was completed using the Illumina NextSeq 550 System. Genome mapping was carried out with high-performance computing.

Results: A total of 23,885 nuclei were analyzed. PTCs were found in five abundant clusters, mapping to S1, S1-S2, S2, S2-cortical S3, and medullary S3 segments. Additional cell clusters ("new PTC clusters") were at low abundance in normal kidney and in increased number in kidneys undergoing regeneration/fibrosis following injury. These clusters exhibited clear molecular phenotypes, permitting labeling as proliferating, New-PT1, New-PT2, and (present only following injury) New-PT3. Each cluster exhibited a unique gene expression signature, including multiple genes previously associated with renal injury response and fibrosis progression. Comprehensive pathway analyses revealed metabolic reprogramming, enrichment of cellular communication and cell motility, and various immune activations in new PTC clusters. In ligand-receptor analysis, new PTC clusters promoted fibrotic signaling to fibroblasts and inflammatory activation to macrophages.

Conclusions: These data identify unrecognized PTC phenotype heterogeneity and reveal novel PTCs associated with kidney fibrosis.

Keywords: cell biology and structure; chronic kidney disease; epithelial; kidney tubule; mRNA; proximal tubule; renal epithelial cell; renal fibrosis; renal tubular epithelial cells; scRNA-seq.


Figures

None
Graphical abstract
Figure 1.
Figure 1.
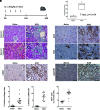
Descriptive analysis of the mouse model of fibrosis induced by repeated injection of Aristolochic Acid (AA). (A) Workflow of the animal model used. AA (2.5 mg/kg) was administered intraperitoneally (ip) on four occasions on days 0, 3, 7, and 10. (B) Significant difference of serum creatinine at the end of the experiment (n=7 in each group). (C) Masson trichrome stain of kidneys from a healthy mouse (left panels; naïve) and a mouse with chronic AAN (right panels; AAN) taken at day 28. Cytoplasm is stained red, collagen is stained blue, and nuclei are in dark brown, which helps to identify renal fibrosis. Significant fibrotic changes developed in the mouse kidney due to AAN. (D–F) IHC stain of Ki-67, α-smooth muscle actin (α-SMA), and HAVCR1 (Kim-1) in naïve and AAN kidneys. The micrographs shown are representative of four naïve mice and four AAN mice. (G and H) Quantification of collagen (cyan signal) in Masson trichrome stain and α-SMA signal were used to confirm fibrosis in the AAN model. (I) Nuclear Ki-67 DAB signal was used to quantify proliferating cells as a percentage of all hematoxylin-stained cells. Scale bars = 50 μm.
Figure 2.
Figure 2.
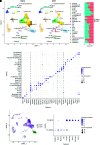
Clustering and cell-type identification of 23,885 nuclei using combined datasets from four naïve mice and four AAN mice. (A) UMAP plot of the combined dataset is shown by splitting conditions. We identified all major cell types in the kidney and four new classes of cells, labeled as proliferative cell and New–proximal tubule (PT) clusters 1–3. (B) The dot plot shows the expression levels and the percentages of gene expression of the canonical genes in each distinct cell type. (C) A feature plot of regional-specific genes shows the expression of Cyp2e1 (purple) in cortical PTCs and Cyp7b1 (green) in medullary PTCs. (D) Expression of canonical genes of PCs in the outer inner medullary collecting duct (OMCD) and the inner medullary collecting duct (IMCD) shows that the PCs from the two different regions were well clustered. ATL, ascending thing limb; CNT, connecting tubule; DCT1/DCT2, distal convoluted tubule 1/2; DTL, descending thin limb; IC-A, intercalated cell, type A; IC-B, intercalated cell, type B; S1/S2/S3, segment 1/2/3 of proximal tubule.
Figure 3.
Figure 3.
Gene expression profiles of PTC clusters. (A) The dot plot shows the expression levels and the percentages of gene expression in each cluster of the canonical genes in the normal and new classes of PTCs. (B–D) The volcano plots show the significant genes in differentially expressed gene analysis of the three New-PT clusters by comparing the RNA profiles of one cluster with all other clusters of the dataset. Significance was defined as a gene with an adjusted P value =0.05, a ≥0.25 average log fold difference between the two groups of cells, and the presence detected in at least 10% of cells in either of the two populations.
Figure 4.
Figure 4.
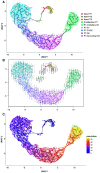
Trajectory, RNA velocity, and pseudotime analysis of the PTCs. (A) Trajectory analysis shows the dynamic process of the PTCs. RNA expression profiles change continuously along the anatomic axis in normal PTCs (PT-S1 to PT-S3). (B) RNA velocity analysis shows that New-PT1 is an intermediate cell type that may differentiate in two directions: “NewPT1–New-PT2–proliferative PT-normal PTCs and “New-PT1–New-PT3.” (C) PTC pseudotime analysis.
Figure 5.
Figure 5.
Immunofluorescence staining of the New-PT clusters. Costaining of sections from naïve and AAN kidneys for (A and B) SLCA4 and VCAM1, (C and D) HAVCR1 and P21, (E–H) Foxd1 and Akap12, and (I–L) Foxd1 and WT1. (F, H, J, and L) Foxd1, Akap12, and WT1 were detected in glomeruli as well as the tubulointerstitium. Arrowheads indicate cells exhibiting dual positivity (merged signal). Scale bars = 20 μm.
Figure 6.
Figure 6.
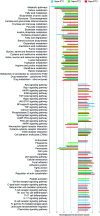
Pathway analysis using the KEGG databas identifies principal moelcular networks activated in each PT cluster. Results shows metabolic reprogramming, enrichment of cellular communication and cell motility, and various immune activations in New-PT clusters. The enrichment was calculated by comparing the RNA profiles of one New-PT cluster with all other PTC clusters. Pathways with a false discovery rate <0.25 are listed.
Figure 7.
Figure 7.
Ligand-receptor analysis identifies ligands expressed in PT clusters twinned with cognate receptors expressed in other cell clusters. (A) PTs S1–S3 are combined and labelled as "normal PT", and fibroblast-1 and -2 are combined and labelled as "fibroblast" for ligand-receptor analysis. A heat map shows the crossproduct of ligand gene expression from normal PT, New-PT1, New-PT2, New-PT3, and receptor gene expression from (B) fibroblast, (C) immune cells, and (D) normal PT. ATL, ascending thing limb; CNT, connecting tubule; DCT1/DCT2, distal convoluted tubule 1/2; DTL, descending thin limb; IC-A, intercalated cell, type A; IC-B, intercalated cell, type B; IMCD, inner medullary collecting duct; OMCD, outer inner medullary collecting duct; S1/S2/S3, segment 1/2/3 of proximal tubule.

References

    1. Lee JW, Chou CL, Knepper MA: Deep sequencing in microdissected renal tubules identifies nephron segment-specific transcriptomes. J Am Soc Nephrol 26: 2669–2677, 2015 - PMC - PubMed
    1. Meinild AK, Loo DD, Pajor AM, Zeuthen T, Wright EM: Water transport by the renal Na(+)-dicarboxylate cotransporter. Am J Physiol Renal Physiol 278: F777–F783, 2000 - PubMed
    1. Berg JMTJ, Stryer L: Biochemistry, 5th Ed., New York, W. H. Freeman, 2002
    1. Fattah H, Vallon V: Tubular recovery after acute kidney injury. Nephron 140: 140–143, 2018 - PMC - PubMed
    1. Chevalier RL: The proximal tubule is the primary target of injury and progression of kidney disease: Role of the glomerulotubular junction. Am J Physiol Renal Physiol 311: F145–F161, 2016 - PMC - PubMed

Publication types

MeSH terms

LinkOut - more resources