. 2021 Jun 29;118(26):e2019415118.
doi: 10.1073/pnas.2019415118.

Human intermediate progenitor diversity during cortical development

Affiliations

Human intermediate progenitor diversity during cortical development

Mark-Phillip Pebworth et al. Proc Natl Acad Sci U S A. .

Abstract

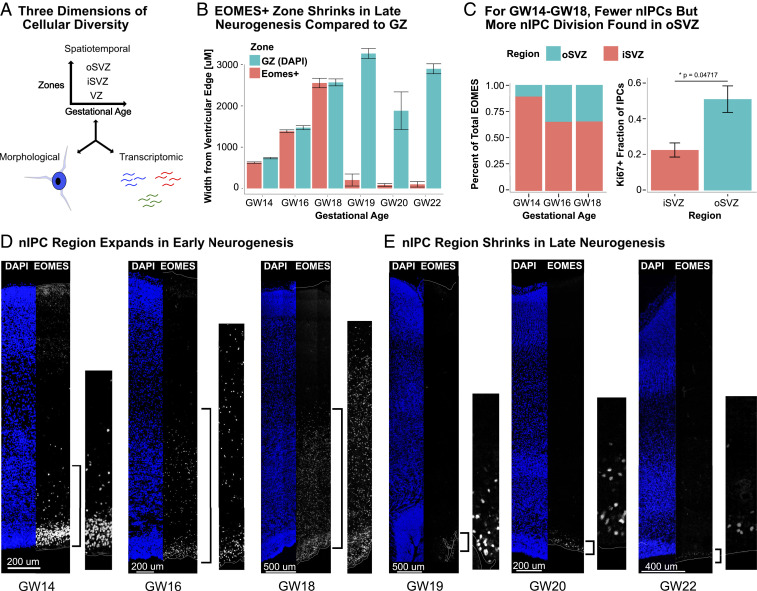
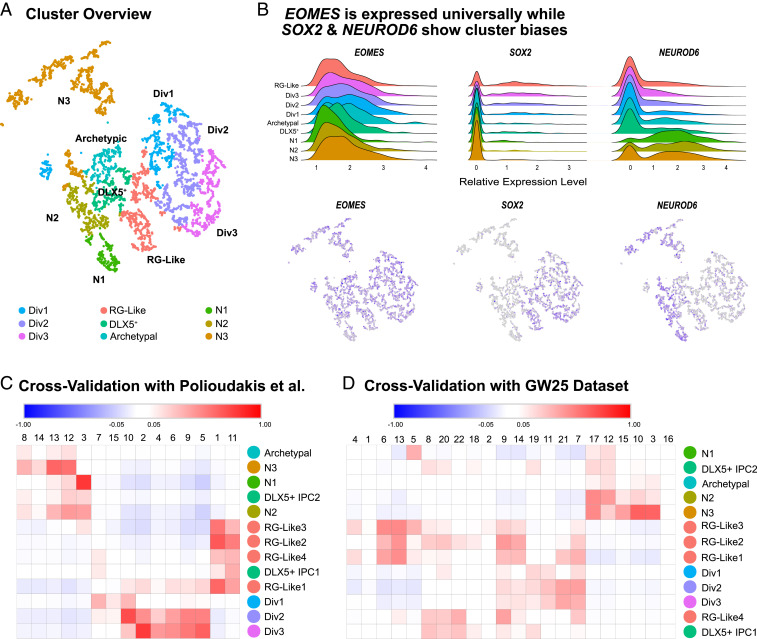
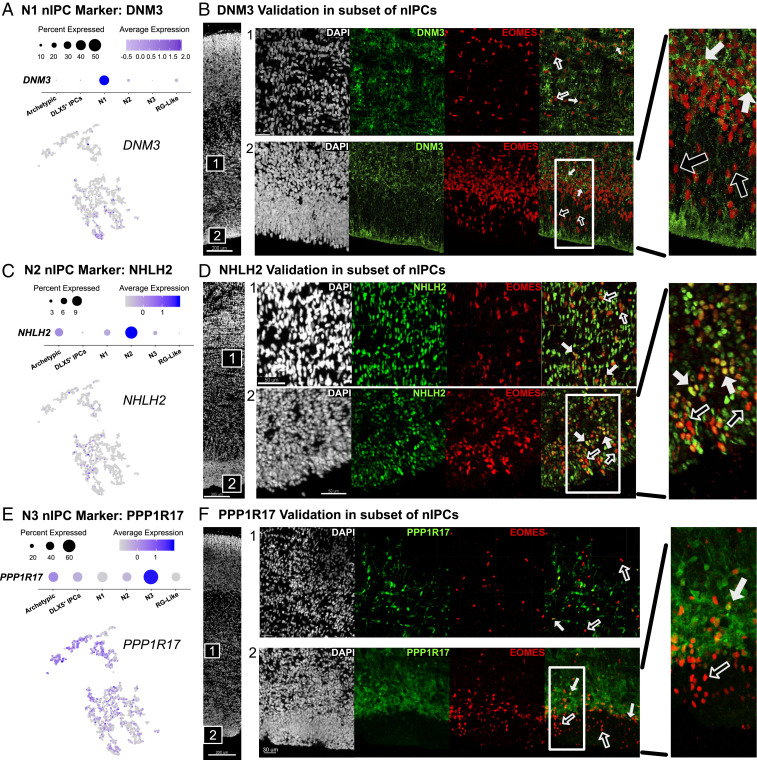
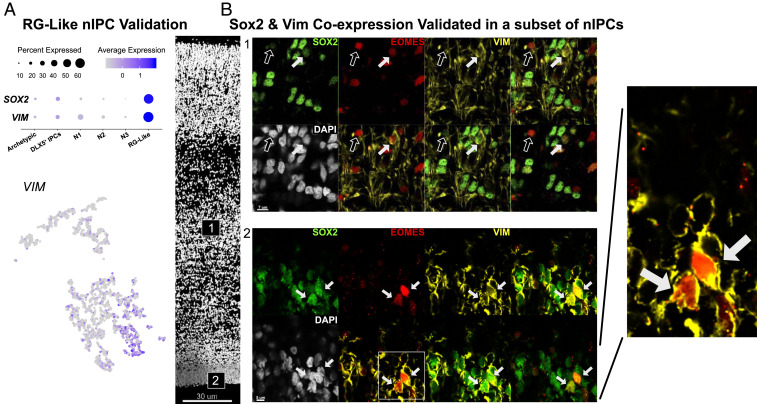
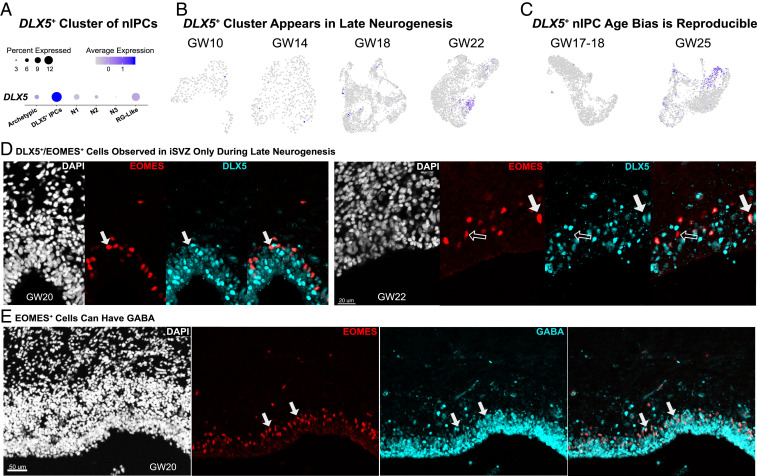
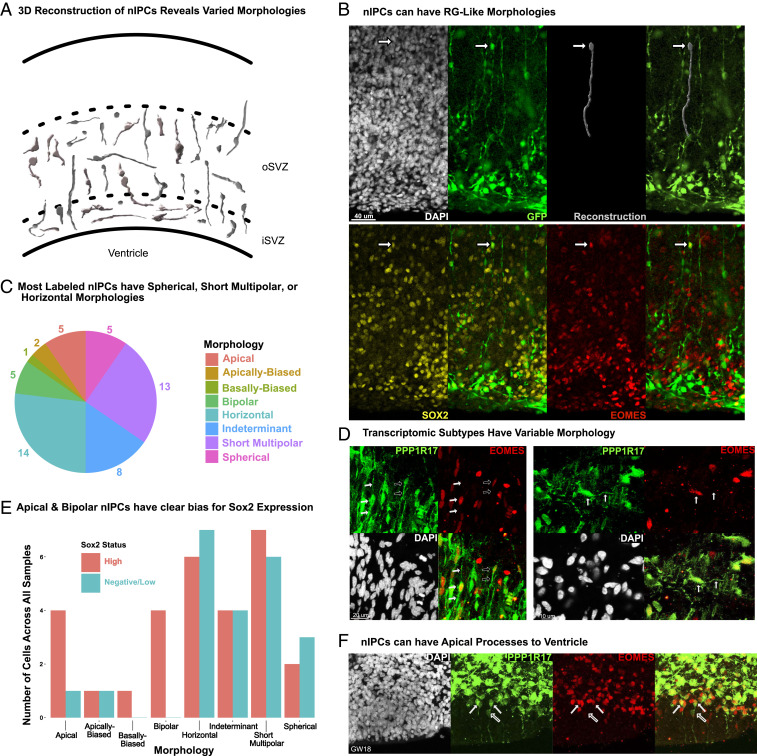
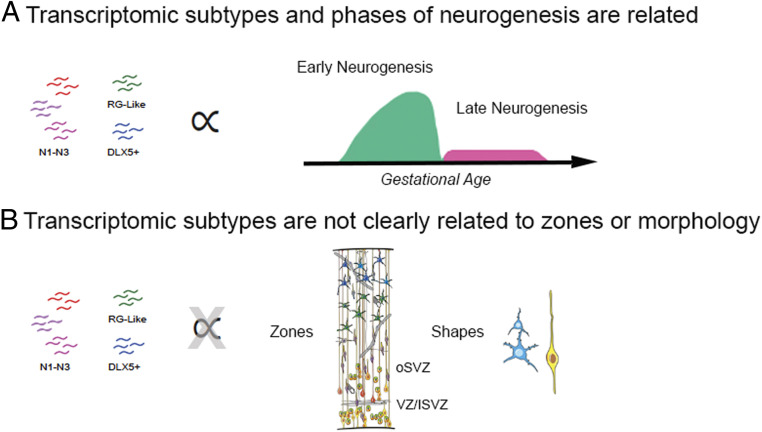
Studies of the spatiotemporal, transcriptomic, and morphological diversity of radial glia (RG) have spurred our current models of human corticogenesis. In the developing cortex, neural intermediate progenitor cells (nIPCs) are a neuron-producing transit-amplifying cell type born in the germinal zones of the cortex from RG. The potential diversity of the nIPC population, that produces a significant portion of excitatory cortical neurons, is understudied, particularly in the developing human brain. Here we explore the spatiotemporal, transcriptomic, and morphological variation that exists within the human nIPC population and provide a resource for future studies. We observe that the spatial distribution of nIPCs in the cortex changes abruptly around gestational week (GW) 19/20, marking a distinct shift in cellular distribution and organization during late neurogenesis. We also identify five transcriptomic subtypes, one of which appears at this spatiotemporal transition. Finally, we observe a diversity of nIPC morphologies that do not correlate with specific transcriptomic subtypes. These results provide an analysis of the spatiotemporal, transcriptional, and morphological diversity of nIPCs in developing brain tissue and provide an atlas of nIPC subtypes in the developing human cortex that can benchmark in vitro models of human development such as cerebral organoids and help inform future studies of how nIPCs contribute to cortical neurogenesis.

Keywords: cortex; development; human; neuronal; progenitor.


Conflict of interest statement

The authors declare no competing interest.

Figures

Fig. 1.
Fig. 1.
(A) The spatiotemporal, transcriptomic, and morphological diversity of nIPCs remains almost entirely unexplored. (B) The GZs expand in thickness during neurogenesis. The EOMES+ area expands until GW19, after which it virtually disappears in the oSVZ and diminishes in the iSVZ, as shown in E. Distance measurements were taken from the ventricle to the outermost EOMES+ cell. Error bars represent technical variations from nine independent measurements of one biological sample. The GW20 measurements represent an average of nine values from both the occipital and prefrontal cortex. Error bars are SD. (C) From GW14 to GW18, most nIPCs are found within the iSVZ, not the oSVZ. However, in the oSVZ, nIPCs costain with KI67 at a higher rate, indicating that these nIPCs are more proliferative (C). The percentage of total EOMES in the oSVZ or iSVZ is the number of EOMES+ nuclei in that region over the total EOMES+ nuclei for a given length along the ventricle. The KI67 fraction represents the percentage of EOMES+ nuclei that also stain for KI67 in a given region for a given length along the ventricle. Error bars are SD. (D) The number of nIPCs expand from GW14 to GW18, during early neurogenesis. (E) Around GW19, the number of nIPCs abruptly declines. A thin band of EOMES+ cells remains in the iSVZ, and few or no nIPCs are found in the oSVZ. This later distribution was evident in three out of four samples from GW19 to GW20 and all three samples after GW20.
Fig. 2.
Fig. 2.
(A) Overview of high-quality clusters in t-distributed stochastic neighbor embedding (tSNE) space. “Div” clusters are the dividing clusters. nIPC clusters (N1–N3) are biased for neuron genes. Archetypal nIPCs express classic nIPC genes, but do not express unique identifying markers. This cluster did not pass the statistical threshold for a biologically meaningful cluster. (B) Within EOMES-expressing nIPCs, SOX2 and NEUROD6 clearly differentiate clusters and guide interpretation. SOX2 is biased toward RG-like and dividing clusters, while NEUROD6 is biased toward neuron-like (N1–N3 nIPC) clusters. (C) Many clusters cross-validated well with specific clusters of EOMES-expressing cells from a previously published GW17–GW18 dataset. N3 and N1 nIPCs validated particularly well. (D) Several clusters showed a near one-to-one relationship with nIPC clusters from a separate validation dataset.
Fig. 3.
Fig. 3.
(A) N1 nIPCs are marked by DNM3. (B) DNM3 is expressed in a subset of nIPCs within both the iSVZ (2) and oSVZ (1) at GW14. Filled-in arrows represent colocalization and empty arrows represent nuclei with only EOMES. This theme carries through the rest of the figure. (C) N2 nIPCs are marked by strong NHLH2 expression. (D) NHLH2 is expressed in a subset of EOMES+ nuclei in both the iSVZ and the oSVZ. (E) N3 nIPCs are marked by strong PPP1R17 expression. (F) PPP1R17 can also be seen in a specific subset of EOMES+ cells in both the iSVZ and the oSVZ.
Fig. 4.
Fig. 4.
(A) RG-like nIPCs coexpress several classic RG genes including SOX2 and VIM. (B) VIM and SOX2 protein are colocalized with a subset of nIPCs in the iSVZ and the oSVZ. VIM, SOX2, and EOMES triple positive cells are marked by filled-in arrows. EOMES+ nuclei are marked by empty arrows.
Fig. 5.
Fig. 5.
(A) One cluster of nIPCs expresses DLX5. (B) This DLX5+ cluster appears at later ages in our dataset. The DLX5+ cluster is absent at GW10 and GW14. By GW18, this is a small cluster to the Left, and by GW22, there is a large cluster of DLX5+ cells. This pattern repeats with other datasets. For the GW17–GW18 Polioudakis et al. (16) dataset, a small cluster of DLX5+ cells is visible. (C) Our validation dataset (GW25) confirms a DLX5+ population. (D) DLX5 and EOMES costains a subset of EOMES+ cells at GW20 and GW22. Filled-in arrows mark costaining, and empty arrows mark EOMES staining. (E) EOMES+ cells at GW20 can also be GABA+, suggesting that inhibitory neurons may be generated from these nIPCs at this time. Colabeled cells are marked with filled-in arrows.
Fig. 6.
Fig. 6.
(A) A representation of reconstructed nIPCs based on GFP viral labeling and EOMES costaining. (B) nIPCs can have very long extensions that resemble radial glia. (C) Most labeled nIPCs either had no extensions (spherical), had minimal extensions (less than 30 μm), or had horizontal morphologies with long extensions that ran parallel to the VZ. (D) PPP1R17+/EOMES+ cells have varied morphologies with both apical and basal extensions (filled-in arrows) and with only apical extensions (empty arrows). Horizontal morphologies can also be found. (E) Sox2 expressing nIPCs can have varied morphologies. (F) nIPCs can contact the ventricle. EOMES+ cells with low PPP1R17 expression can have extensions to the ventricular edge. We observed this staining in all samples observed from GW14 to GW18.
Fig. 7.
Fig. 7.
Transcriptomic subtypes of IPCs are distinguished by their stage of differentiation (A) and are not distinguished by location or morphology (B).

References

    1. Hansen D. V., Lui J. H., Parker P. R. L., Kriegstein A. R., Neurogenic radial glia in the outer subventricular zone of human neocortex. Nature 464, 554–561 (2010). - PubMed
    1. Hevner R. F., From radial glia to pyramidal-projection neuron: Transcription factor cascades in cerebral cortex development. Mol. Neurobiol. 33, 33–50 (2006). - PubMed
    1. Noctor S. C., Martínez-Cerdeño V., Ivic L., Kriegstein A. R., Cortical neurons arise in symmetric and asymmetric division zones and migrate through specific phases. Nat. Neurosci. 7, 136–144 (2004). - PubMed
    1. Haubensak W., Attardo A., Denk W., Huttner W. B., Neurons arise in the basal neuroepithelium of the early mammalian telencephalon: A major site of neurogenesis. Proc. Natl. Acad. Sci. U.S.A. 101, 3196–3201 (2004). - PMC - PubMed
    1. Vasistha N. A., et al. ., Cortical and clonal contribution of Tbr2 expressing progenitors in the developing mouse brain. Cereb. Cortex 25, 3290–3302 (2015). - PMC - PubMed

Publication types

Substances