

Reduced levels of prostaglandin I2 synthase: a distinctive feature of the cancer-free trichothiodystrophy
- PMID: 34155103
- PMCID: PMC8255998
- DOI: 10.1073/pnas.2024502118
Reduced levels of prostaglandin I2 synthase: a distinctive feature of the cancer-free trichothiodystrophy
Abstract
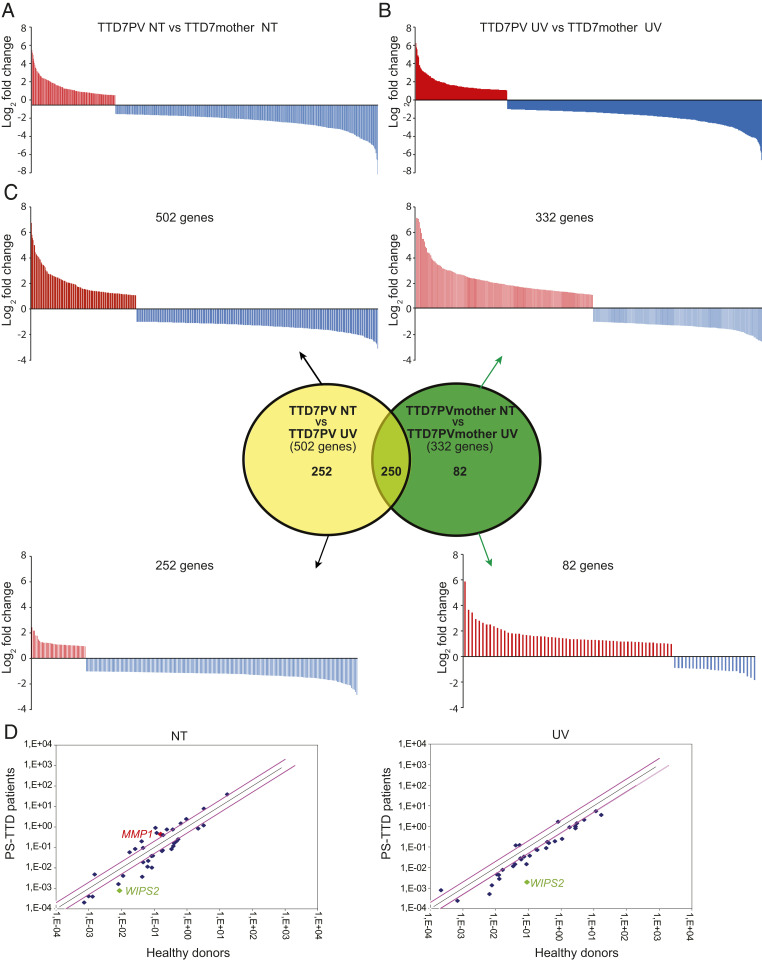
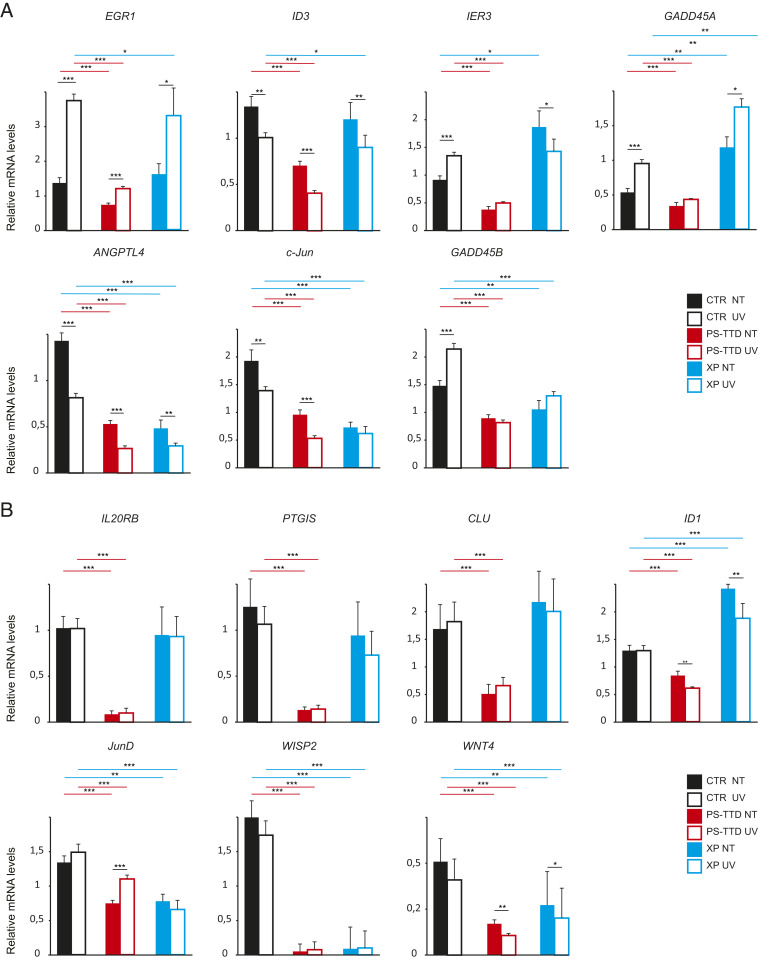
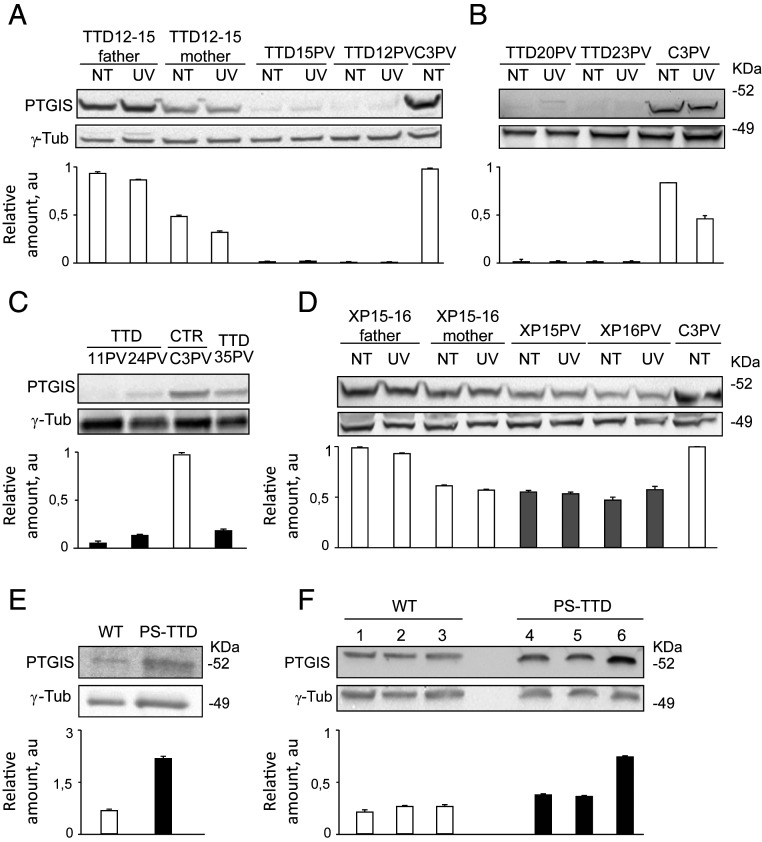
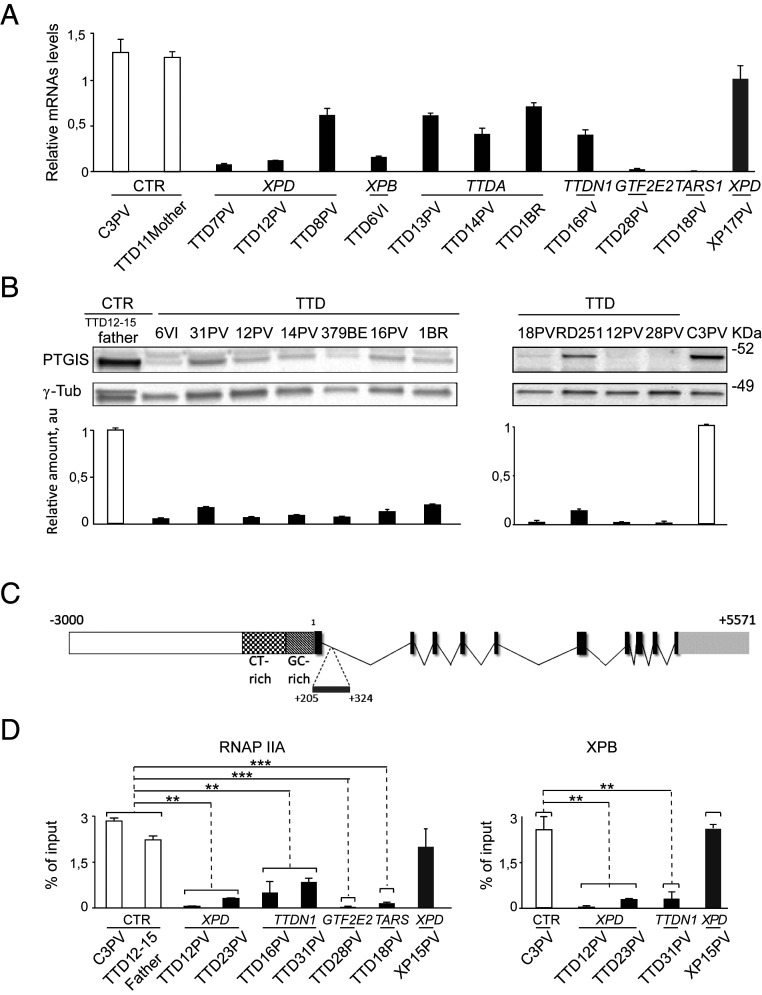
The cancer-free photosensitive trichothiodystrophy (PS-TTD) and the cancer-prone xeroderma pigmentosum (XP) are rare monogenic disorders that can arise from mutations in the same genes, namely ERCC2/XPD or ERCC3/XPB Both XPD and XPB proteins belong to the 10-subunit complex transcription factor IIH (TFIIH) that plays a key role in transcription and nucleotide excision repair, the DNA repair pathway devoted to the removal of ultraviolet-induced DNA lesions. Compelling evidence suggests that mutations affecting the DNA repair activity of TFIIH are responsible for the pathological features of XP, whereas those also impairing transcription give rise to TTD. By adopting a relatives-based whole transcriptome sequencing approach followed by specific gene expression profiling in primary fibroblasts from a large cohort of TTD or XP cases with mutations in ERCC2/XPD gene, we identify the expression alterations specific for TTD primary dermal fibroblasts. While most of these transcription deregulations do not impact on the protein level, very low amounts of prostaglandin I2 synthase (PTGIS) are found in TTD cells. PTGIS catalyzes the last step of prostaglandin I2 synthesis, a potent vasodilator and inhibitor of platelet aggregation. Its reduction characterizes all TTD cases so far investigated, both the PS-TTD with mutations in TFIIH coding genes as well as the nonphotosensitive (NPS)-TTD. A severe impairment of TFIIH and RNA polymerase II recruitment on the PTGIS promoter is found in TTD but not in XP cells. Thus, PTGIS represents a biomarker that combines all PS- and NPS-TTD cases and distinguishes them from XP.
Keywords: NER-defective disorders; PTGIS; TFIIH transcription.
Conflict of interest statement
The authors declare no competing interest.
Figures
Similar articles
-
Persistence of repair proteins at unrepaired DNA damage distinguishes diseases with ERCC2 (XPD) mutations: cancer-prone xeroderma pigmentosum vs. non-cancer-prone trichothiodystrophy.Hum Mutat. 2008 Oct;29(10):1194-208. doi: 10.1002/humu.20768. Hum Mutat. 2008. PMID: 18470933 Free PMC article.
-
Comparative study of nucleotide excision repair defects between XPD-mutated fibroblasts derived from trichothiodystrophy and xeroderma pigmentosum patients.DNA Repair (Amst). 2008 Dec 1;7(12):1990-8. doi: 10.1016/j.dnarep.2008.08.009. Epub 2008 Oct 10. DNA Repair (Amst). 2008. PMID: 18817897
-
A mutation in the XPB/ERCC3 DNA repair transcription gene, associated with trichothiodystrophy.Am J Hum Genet. 1997 Feb;60(2):320-9. Am J Hum Genet. 1997. PMID: 9012405 Free PMC article.
-
Xeroderma pigmentosum and related disorders: defects in DNA repair and transcription.Adv Genet. 2001;43:71-102. doi: 10.1016/s0065-2660(01)43004-5. Adv Genet. 2001. PMID: 11037299 Review.
-
Trichothiodystrophy: update on the sulfur-deficient brittle hair syndromes.J Am Acad Dermatol. 2001 Jun;44(6):891-920; quiz 921-4. doi: 10.1067/mjd.2001.114294. J Am Acad Dermatol. 2001. PMID: 11369901 Review.
Cited by
-
Prostaglandin I2 signaling prevents angiotensin II-induced atrial remodeling and vulnerability to atrial fibrillation in mice.Cell Mol Life Sci. 2024 Jun 15;81(1):264. doi: 10.1007/s00018-024-05259-3. Cell Mol Life Sci. 2024. PMID: 38878214 Free PMC article.
-
Identification of Prostaglandin I2 Synthase Rare Variants in Patients With Williams Syndrome and Severe Peripheral Pulmonary Stenosis.J Am Heart Assoc. 2024 May 7;13(9):e032872. doi: 10.1161/JAHA.123.032872. Epub 2024 Apr 19. J Am Heart Assoc. 2024. PMID: 38639351 Free PMC article.
-
PTGIS May Be a Predictive Marker for Ovarian Cancer by Regulating Fatty Acid Metabolism.Comput Math Methods Med. 2023 Feb 2;2023:2397728. doi: 10.1155/2023/2397728. eCollection 2023. Comput Math Methods Med. 2023. PMID: 36785673 Free PMC article.
-
Age or lifestyle-induced accumulation of genotoxicity is associated with a length-dependent decrease in gene expression.iScience. 2023 Mar 9;26(4):106368. doi: 10.1016/j.isci.2023.106368. eCollection 2023 Apr 21. iScience. 2023. PMID: 37013186 Free PMC article.
-
Trichothiodystrophy-causative pathogenic variants impair a cooperative action of TFIIH and DDX1 in R-loop processing.Nucleic Acids Res. 2025 Jul 19;53(14):gkaf745. doi: 10.1093/nar/gkaf745. Nucleic Acids Res. 2025. PMID: 40757642 Free PMC article.
References
-
- Marteijn J. A., Lans H., Vermeulen W., Hoeijmakers J. H. J., Understanding nucleotide excision repair and its roles in cancer and ageing. Nat. Rev. Mol. Cell Biol. 15, 465–481 (2014). - PubMed
-
- Compe E., Egly J. M., Nucleotide excision repair and transcriptional regulation: TFIIH and beyond. Annu. Rev. Biochem. 85, 265–290 (2016). - PubMed
Publication types
MeSH terms
Substances
LinkOut - more resources
Full Text Sources
Medical
Research Materials
